Salesman bad luck and red october
Chief Commander Aristarchus stood at the window and, with a slight sadness in his eyes, accompanied the flock of mosquitoes flying away to the south. Autumn. The end of the season. It's time for batons, loved by the residents of the city of N as a means of self-defense against bloodsuckers and a status object (it is known, an unbroken city dweller is prettier than the bitten one), pick up snow trolls from their gunsmiths from their arms shops.
In retail, the fall in demand for seasonal goods leads to a change in the assortment on the shelves and to the return of unclaimed residues to suppliers' warehouses. The mess is still. Not everyone can boast a balanced product portfolio. The end of the season can lead to a cash gap and suppliers try their best to reduce losses. Bad luck traveling salesman as she is.
The summer was hot, because the season was delayed - the idea settled in Aristarch's head - the annual rhythm of the winged migration definitely fit into some kind of framework predetermined by nature. What if there is a correlation between sales and weather?
Show me the correlation of the weather and sales of mosquito bludgeons, here's a gigabyte of summary tables in Excel - this is how I began to get acquainted with the returns of seasonal products.
The message was clear - to link money M with the weather W.

Hereinafter, the important signs will be denoted by big funny letters.
Do we have a plan? Of course, we have a plan:
Posing bad luck to a salesman
Nature of the data
Sales mechanics
Here is the correlation that Aristarchus was waiting for.
Model T
We sell model to sellers
Made, launched - improve
The shopkeeper inequality (Pareto's law) is a pair of endless moments
Meriay shopkeepers Hertz
Memo to the replicator
Debriefing or Traveling Salesman Rake
We had 54 months of sales of a team of 400 people in 30,000 outlets. The data in the summary tables of the monthly report on the sales of products by day - for each sales point. Of these, we restored transaction positions — orders of individual products with a unique date (here we accepted the assumption that the client placed one order on one day).
Weekly sales of batons demonstrate the seasonal nature of demand - at the end of September (week 36) the amount of liabilities on returns (simplifying, return is an order with a minus sign) exceeds sales income. The end of the season is coming.
The scale of the disaster - a third of the truncheon business

What if there is a correlation between sales and weather? Weather records will help us to answer the question. The history of the centralized collection of meteorological observations from around the planet by the US National Administration has been dragging on since the beginning of the last century, the most complete data are available from the 70s. One of the sources available for personal or academic use is GSOD . Having sales data in the specified interval, we can test the hypothesis graphically.
Sales are measured in money and pieces, and the weather?
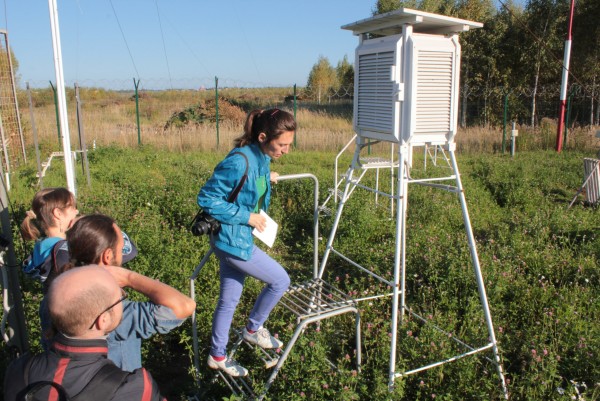
The weather in Kemerovo is measured in the same way as in Adelaide - these methods are standardized by the international community. The full list of official stations by member countries of the World Meteorological Organization contains unique identifiers (for example, the airport in Adelaide has WMO_ID = 94672 , and for the Kemerovo Center for Hydromorology and Environmental Monitoring WMO_ID = 29642 ), by which you can search for records in the archives. Special equipment resides in a psychromet booth at a height of 2 m above the ground - station staff use ladders to collect instrument readings.
Difficult is work - to make measurements with frequent 2 hours for the following indicators:
- T - air temperature, 2m above the ground,
- P is the air pressure (mm Hg. Art.) Reduced to sea level,
- U - relative humidity, 2m above the ground,
- Ff - wind speed, 10-12 m above the ground, average for 10 minutes,
- Tn is the minimum temperature in the last 12 hours,
- Tx - the maximum temperature in the last 12 hours,
- Td - dew point
- Tg is the minimum temperature of the soil surface at night.
As they say, everyone has his own
Meteorologists - observations make, traveling salesmen - sales. Transactions - fix orders.


Presumably, a good traveling salesman follows the procedure and route - tight time constraints oblige. Well, when many salespeople and exclusive. But not now. In our situation, sales representatives are hired by a distributor. We parse the sales data of distributors in the outlets - Sell-Out.
In principle, and this is the best practice, it would be good to keep records of the activities of traveling salesmen. Once we measured every tenth of almost two thousand - a week after the sales representative a supervisor walked with a stopwatch. I then processed these measurements. It was a long time ago and the measurement process was the following: following the traveling salesman relentlessly, his immediate supervisor measured all the stages of the visit and took notes in a notebook. At the end of the shift, at the regional office, he entered the table and sent it to us. Then two regions were noticeably distinguished - the quality of the data (completeness, column shifts) required cleaning. Two weeks of the experiment flew in light turmoil - each supervisor measured two salespeople. Then he asked the project manager about the success of sales in those regions - it turned out to be small. Since then, the rule has begun to measure the chances of success of salespeople purity of data. Our case is somewhere in the middle.
The data is collected from transactions that traveling salesmen enter into mobile devices and they have enough garbage - they were busy bringing addresses to the human form and it was bad for geocodes (I advised Aristarch to solve the problem by inviting an intern to an interesting junior monkeyjobber project) and here it is worth recommending to the chief trainees : 1) to think about input automation and 2) to save customer data, especially address ones - all of a sudden, you will want to send postcards for the new year to everyone, and you’ll get embarrassed by mail.
The ability to compare sales data with the plans and actions of marketing allows you to evaluate the effectiveness of methods in different weather conditions. The more we know about what is happening in the field with a traveling salesman, the better. And there a lot of interesting things happen, including a constant conflict of interests.
Briefly about the mechanics of the interaction of market participants in consumer products. Commodities reach consumers through a chain of intermediaries. Manufacturers (P1 and P2) compete at every step and the shelf in the store is the last frontier. Usually a couple of large suppliers struggle for the attention of distributors, small ones are not interesting to anyone and they have a hard time.
There are three types of transactions:
• Sell-In - from the manufacturer to the distributor,
• Sell-Out - from distributor to point of sale,
• Sell-through - to the consumer.
The present chief commander possesses sufficient bargaining power to convince distributors and retail outlets to share records. Market share - the most powerful argument. Trading networks are more likely to share information, and this practice is growing.
We depict the flow of money and weather
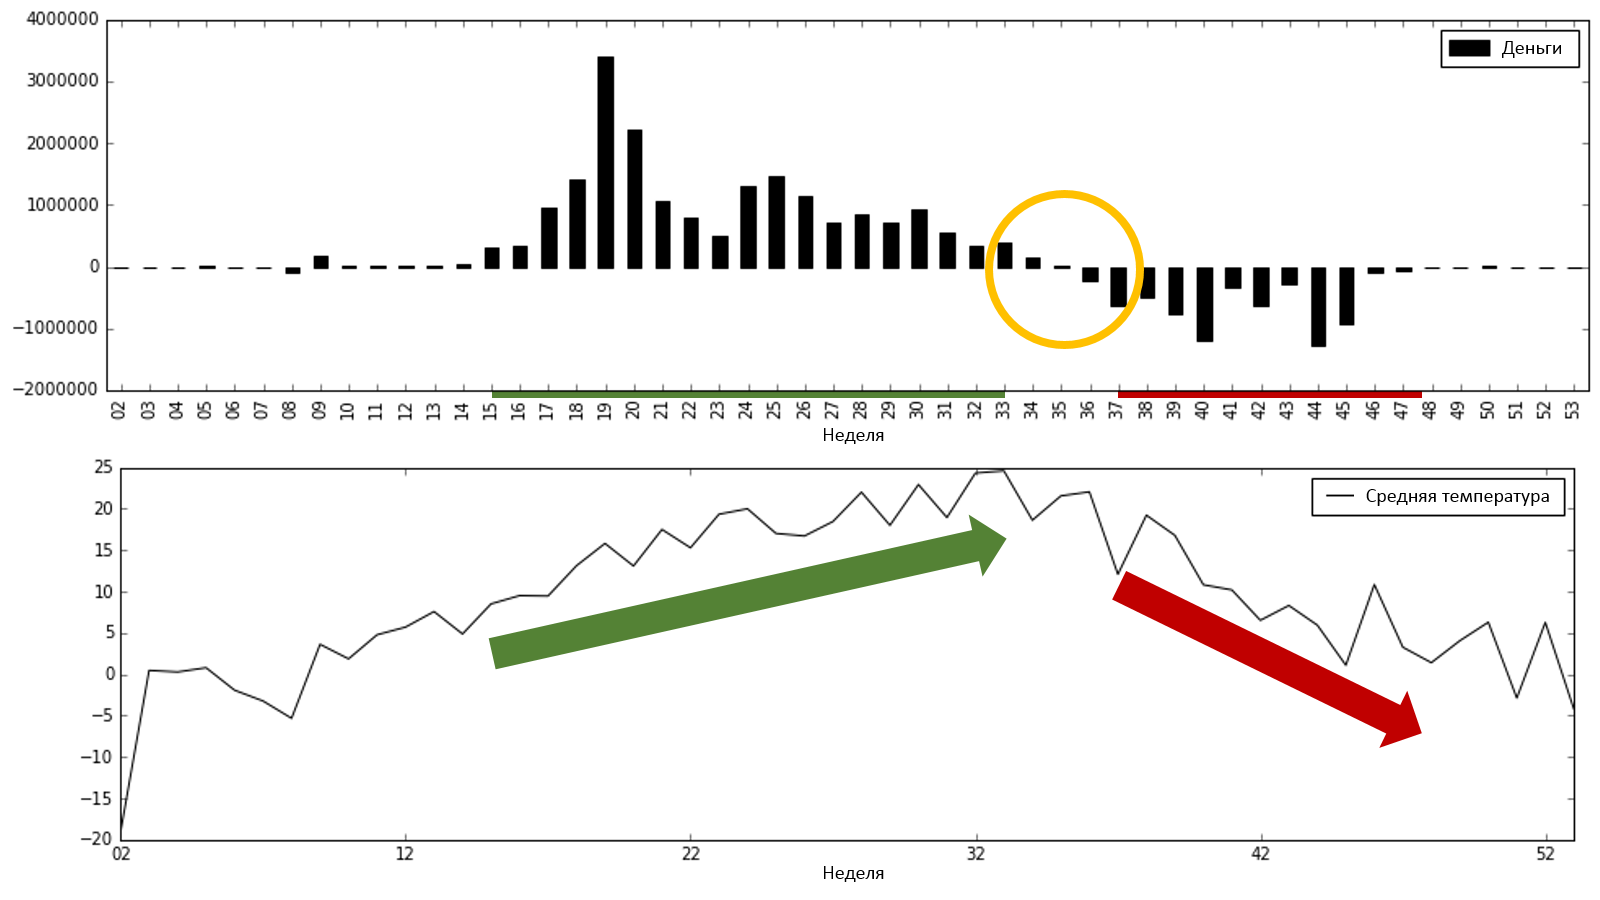
The demand for batons changes with the average temperature of the week. The end of the season coincides with the beginning of the cooling. This is generally for the market - our geography of sales is 603 thousand square kilometers - autumn at different times sweeps through cities and villages, so we have 10 weeks to return. Across the immense.
Why average temperature?
Minimalism. Laziness. Show off Well, personal experience - I like to sit in the summer with a book in the garden, but what a bad luck - mosquitoes. To brush off a baton and read at the same time is not very good, so you have to burn incense from them, then to warm the fumigator - the methods are harsh and distract from reading a little less than blood-sucking insects, and there is no place to find a better garden in the summer, because compromise is inevitable. I noticed that the delay between the arrival of evening freshness, when it is time to put on a sweatshirt and wrap yourself up in a hood, and the disappearance of mosquitoes is about half an hour minutes. For several days in a row, the air temperature was measured at this very time - about 19 ° C there is an invisible border separating the arrival of mosquitoes from the garden. So heuristics was born.
In addition, sales really correlate with the weather. Only with the answer "Pearson's correlation between returns and maximum temperature for the past 12 hours is 0.676722" I would not go to the chief executive officer - they will not understand.
Intermediate conclusion - we reviewed the history of operations of returning seasonal goods from retail to warehouses for distributors and outlined the traveling salesman’s bad luck with the dependence of sales on the environment (air temperature at 2m above the ground) at the time of shopping.
We will consider the arguments about the connection of the end of the season (the traveling salesman’s bad luck) with the weather sufficient for the transition to exercises in machine learning — our goal is to generalize dependence and create new knowledge that encourages action. For example - the decision to replace the assortment at each point in advance - as opposed to waiting for returns in the fall.
Lots of data - simple models work?
Argued that a large number of examples allows the use of simple models. Our data is decent - just over 8 million lines. By date and coordinates, we compared weather conditions with transactions and can try to solve the binary classification problem and train the algorithm to distinguish sales from returns.
Model T

')
Let's make stacking on the knee - a method in which the output of one model is fed to the input of another, allowing to achieve a better forecast quality in comparison with the use of models separately. For each transaction, we extend the data set with weather information for the three and seven days preceding the event. A sliding window is a hike, also a model. The use of interpretable algorithms is dictated by ergonomic considerations — selling on the HYIP wave is probably nice, but I was taught to believe that product knowledge and the ability to talk about the mechanics of its operation make the seller more successful.
In addition, the
Out of the box prediction accuracy - the proportion of correct answers - is 99%. It can be assumed that such an interpreter of the weather forecast will introduce minimal distortion.
In general, the choice of the quality metric is a crucial step and our case dictates the strategy of transparency - we choose the most interpreted models from the best. In the future, we will compare the family of machine learning algorithms and evaluate them by several parameters, such as: computational cost and scalability, availability of ready-to-use components, and operating costs. Now we are making the statement of the traveling salesman bad luck and offer an algorithm for solving.
So. We identified the salesman’s bad luck as the return of seasonal goods from retail stores and, with acceptable accuracy, solved it with machine learning tools using only one additional variable describing the state of the system. Now we can interpret the weather forecast and predict the end of the season, looking into the future for two weeks.
How to submit such a model to business?

I believe that the success of products built using machine learning depends on the habitual sound of questions for people. The task of the binary classification, which we have just solved, answers the question: “What will happen in the given conditions?” - this allows us to interpret the promises of weather forecasters for each day separately.
Paraphrasing the question, we come to a more convenient answer (and story).
We have a model for the end of the season, she is trained on the sales data and then we ask her the question: “How many of the 10 days will we sell based on the weather report?”
The answer is mapped onto the map, color coded: 10 corresponds to the British racing green, which should be associated with a good state of affairs; 0 we denote burgundy, which should cause a violent range of feelings in a prepared reader. The uncertainty of the answer 5 is expressed in a clearly Canary hue contrasting with the background.
Confirming the loyalty of the thesis about the most important of the arts, let us estimate the dynamics of the phenomenon over time - we will make frame-by-frame animations (the cartoon will be a prize for the replicator - launch the notebook and you will be happy). Flashes of red, at first timid among the summer palette of colors, foreshadow the end of the season, as dawn precedes the rising of the sun. A moment — and that’s the whole map is filled with the colors of the morning dawn. She came, sweeping food from the shelves and the blazing fire of red October, the ill luck of the traveling salesman, and behind her the winter, and brought all this to the cities, people, but for the beginning greenery.
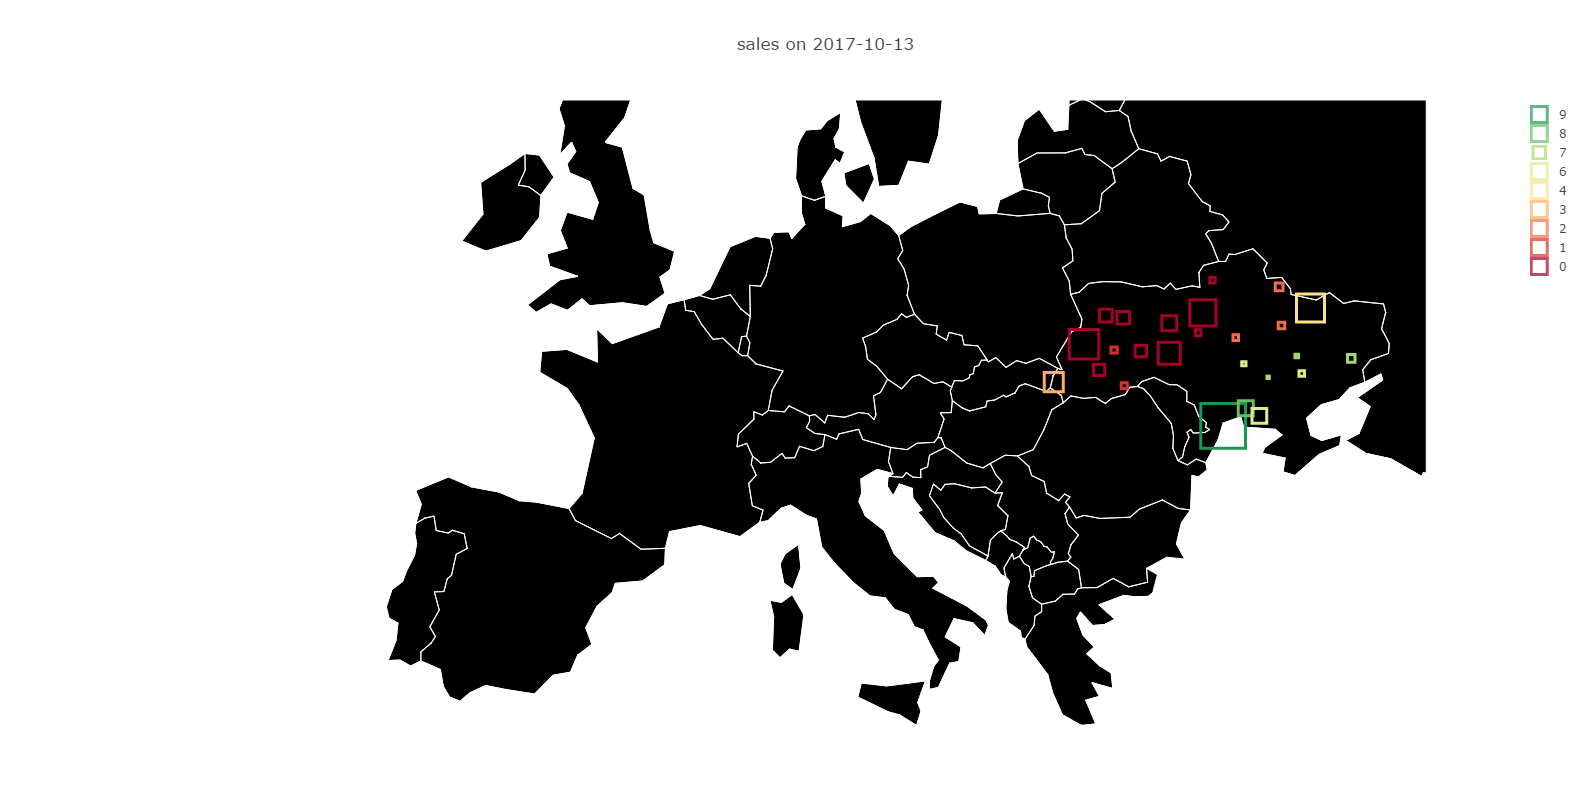
Color coding leaves the point on the map free to express one more idea - it can be just a historical volume of business, or a solution to a regression problem - a sales forecast, which we'll talk about later.
Chief Commander leaned over the map. “I finally see my sales,” the leader burst out. A handful of glowing points in the north foreshadowed turmoil. One had only to close his eyes, as in the ears of the horde of traveling salesmen rushing through cities and villages, now sleeping peacefully and still not knowing that they would wake up anxiously tomorrow, it was time to change the goods on the shelves, the end of the season crept louder and louder.
* * *
Scene Two
In which we decompose the range of clients by analyzing the frequency of visits and increase the accuracy of the T model by an order of magnitude.
Here, perhaps, it is worthwhile to designate a belated preface and introduce yourself. What is happening and described in these notes is one of the episodes of the research that took place within the framework of my second magistracy. Watching salespeople — and not always the obvious conclusions drawn from data analysis — that's what this story is about.
My name is Vadim Safronov and I am an SAP salesman salesman support engineer - presales engineer.
Chief Commander Aristarchus leaned over the map. The north blossomed in shades of red. Hundreds of crystal experts - a regional division in sales assigns a team of traveling salesmen to the locality - this is who tomorrow will fuss. The north is a harsh terrain and it’s unrealistic to visit all seven thousand gun shops before it closes the passes with snow.
And what if not all shopkeepers are equally sweet?
The magnitude of customer inequality is quite accurately described by an elegant formula:
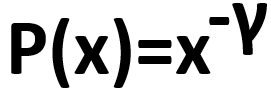
Pareto's law - the probability of an event greater than x is proportional to the degree x, γ is usually from 2 to 3.
Distribution network - all together the chain of distributor-salesman-shop - has the properties of models of the small world. This is expected, because sales are relationships between people and the dynamics of the system are similar to those in other social networks. Graph theory provides tools to describe what is happening. Consider a couple of popular and well-known concept managers. Long tail (long tail) and the rise in price of over-achievements (diminishing returns) - a small part of clients creates a large share of operations and profits and a disproportionate increase in costs - a penalty for perfectionism (or a payment for the height of the level).
Why even graphs?
The idea of customer relationship management suggests relationships between business partners (the central entity in the SAP CRM world). The network effect in consumer products is observed both in the amount of business with customers and in the popularity of products. Describing relationship chains and displaying them as edges in a graph where the nodes are business partners, we get a new data structure that allows interesting transformations and calculations, for example, Page Rank. On the practical correspondence of the frequency of a visit by a salesman to a shop with the probability of being there at a random point in time and the expected ergodicity of a traveling salesman, an exciting comparative experiment can be performed. (excuse: previously seen data is no longer possible and it is forbidden to use - as it will be that suitable for open analysis - a gash
Many, many tasks from the life of a traveling salesman are solved on graphs. And it is beautiful. For example, the usual 80/20 proportion between operations - how applicable?
Traditional statistics are all based on the central limit theorem, which assumes independence between the individual data points in the sample under study. The Pareto law, on the contrary, suggests a close relationship between the elements in the system — the characteristic quality of network structures. An explanation of the formation of such a strongly left- leaning distribution with a heavy tail (preferred connection model) was first suggested by Barabasi : when there is a choice and an opportunity to establish the priority of action, the dynamics of the process will be non-Poisson. For example, if the network grows and new nodes form connections with existing ones, preferring to join the ones most connected with probability p, or randomly choosing a neighbor with probability 1-p. Depending on the value of the parameter, the resulting graph is random (Erdos-Raine model) with p = 0, or it has a small diameter inherent in small world models (the maximum shortest path between two nodes), high clustering (neighboring nodes are often interconnected, for example , ).
– – . – γ – , (2007). , , , – γ . powerLaw. – , .
: 1) 2) - , – – .
The test of the cumulative power distribution function: a graph in a double logarithmic scale.

The Pareto rule is close to our case and 20% of shopkeepers bring 90% of the money.
THE MOST IMPORTANT EFFECT:
In sales, the concept of average does not make sense, since the variance is infinite
« »? (RU) (EN) — .
– .
– – , , -, . . . . .
Recall, our data represents the positions of orders that are known: product, quantity, customer, traveling salesman, calendar day, coordinates. Add the variable T - ambient temperature - this data we can get from open sources (GSOD).
We construct a sign of customer behavior - the frequency of placing orders by retail outlets. We know that the majority of orders are made on the spot, at the point of sale - the distributor's client. Lazy salespeople, it happens, go to the telephone mode of collecting orders - they say, this immediately affects the efficiency - sales fall.
As a measure of the frequency of visits - it will allow to decompose the range of clients into separable sets - we take the average frequency of visits in Hertz.
Algorithm
for each client (point of sale):
- – ( , , ).
- . 10 . ['A', 'B', 'C', 'D', 'E', 'F', 'G', 'H', 'I', 'J'], – .
- .
- 2
. , .

, , ( 100 - ). , – – , – 3% .
, – .
Improving the quality of the forecast by an order is noticeable! At the cost of a relatively simple calculation of the frequency of visiting the store by a traveling salesman, we achieved a 99.9% share of correct classifier answers. Now we can expand the range of questions to the model and get answers to: “How many of the 10 next days will our most profitable customers buy?” Or “When will this customer stop buying?” - due to the customer behavior.
The final model T + F

:
1)
2)
3)
?
. . – . ? – , – . - , .
* * *
, - , 2017
, !
. , . – .
, .
:
— 54 37 , 17 , – – . (2017)
— 30 34 7 . (2016)
— – . (2014)
— , . . (2007)
, – , .
!
* * *
:
— , . , . (UPD: — , , , )
— , , (, – , ). – ETL 30 .
— – .
* * *
Announcement: Scene Three, in which we measure bad luck and the Prophet first appears.
( this is the code that does everything described )
Source: https://habr.com/ru/post/339338/
All Articles