Brain monitoring
Monitoring of equipment and key software is the basics of system administration. But we all comprehend them differently. Over 10 years of work in IT, my attitude to monitoring went through three stages:
Denial Do not monitor anything, users will report when they have problems.
Anger Monitor everything you can and cannot, notify everyone, including those who are not very interested, that the load on the CPU on the web server was 95% for 30 seconds.
Humility Business do not care for the processor / memory / disks. He is more interested in, better or worse after the changes in the infrastructure. We must work on the advance.
Under the cut - the details of the evolution of my relationship.
Negation
It all started a long time ago, in a distant galaxy. I studied at the university and worked in two places “you are a programmer”:
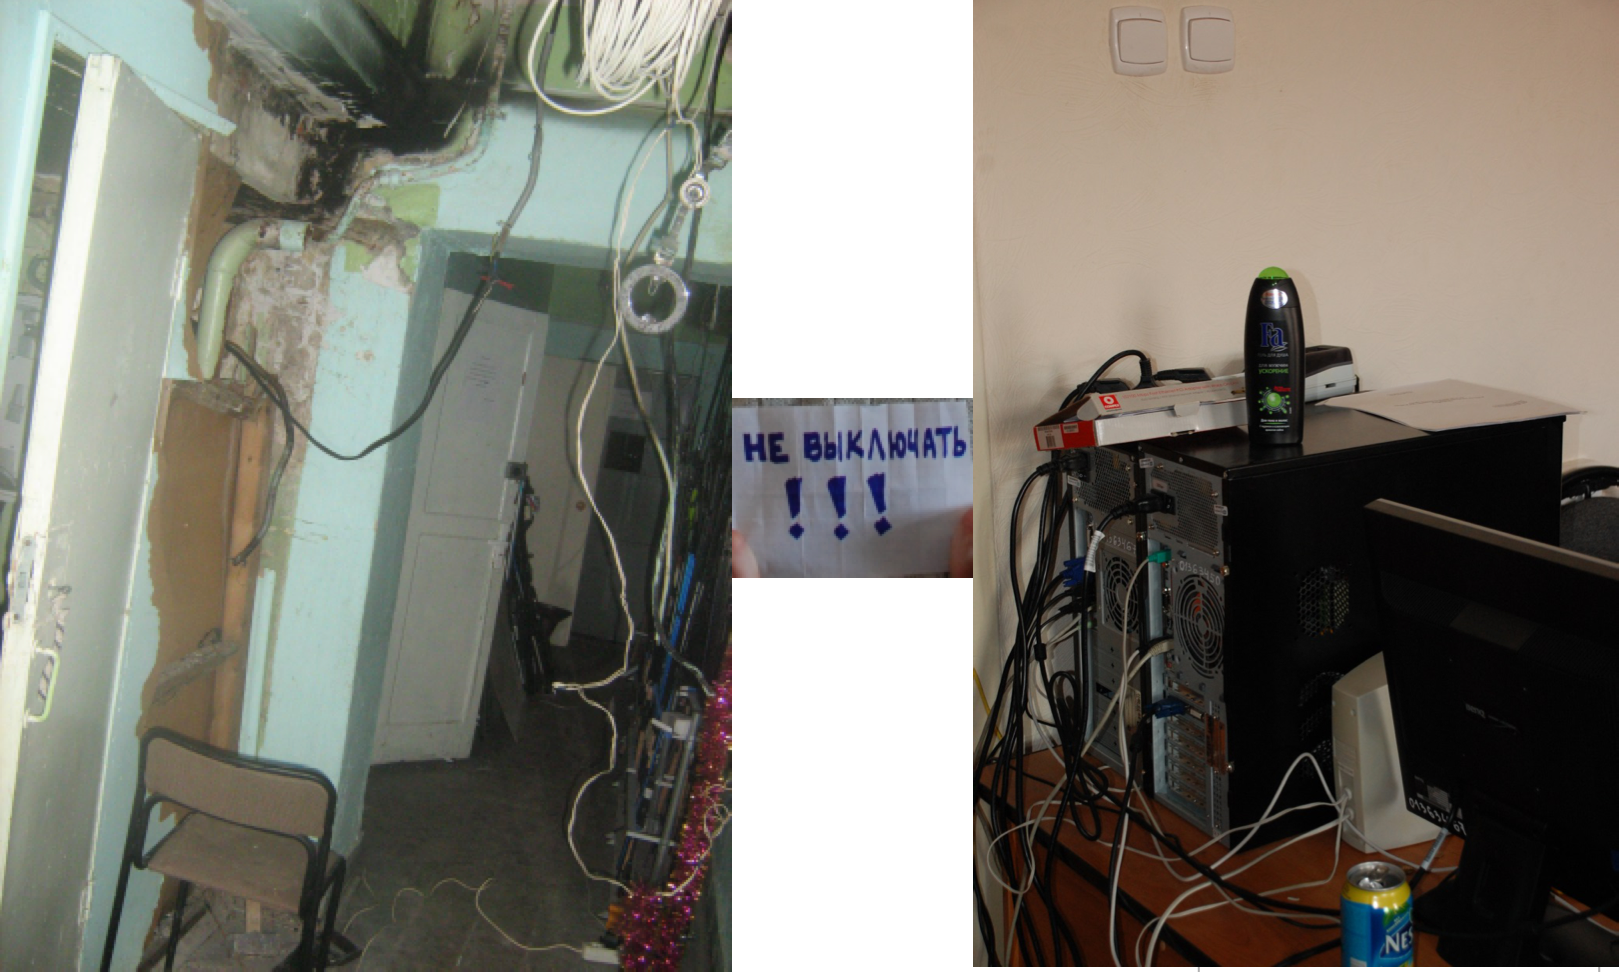
- Trade production company: three servers, ten users. In these photos you can see the server.
- Department of State University: four servers, forty jobs.
At that time I did not even suspect the existence of such a thing as monitoring. I sincerely believed that if something breaks, then you can simply throw your breasts on the embrasure and heroically solve the problems.
My attitude to monitoring at that time can be characterized as follows:
- Users themselves will report when something breaks. We ourselves constantly work with the site, so we will see when it broke. Is the processor overloaded on the server? I do not care, the programmers wrote something there.
Fortunately, this period did not last long - I began to suspect that something was wrong here, and it could be better.
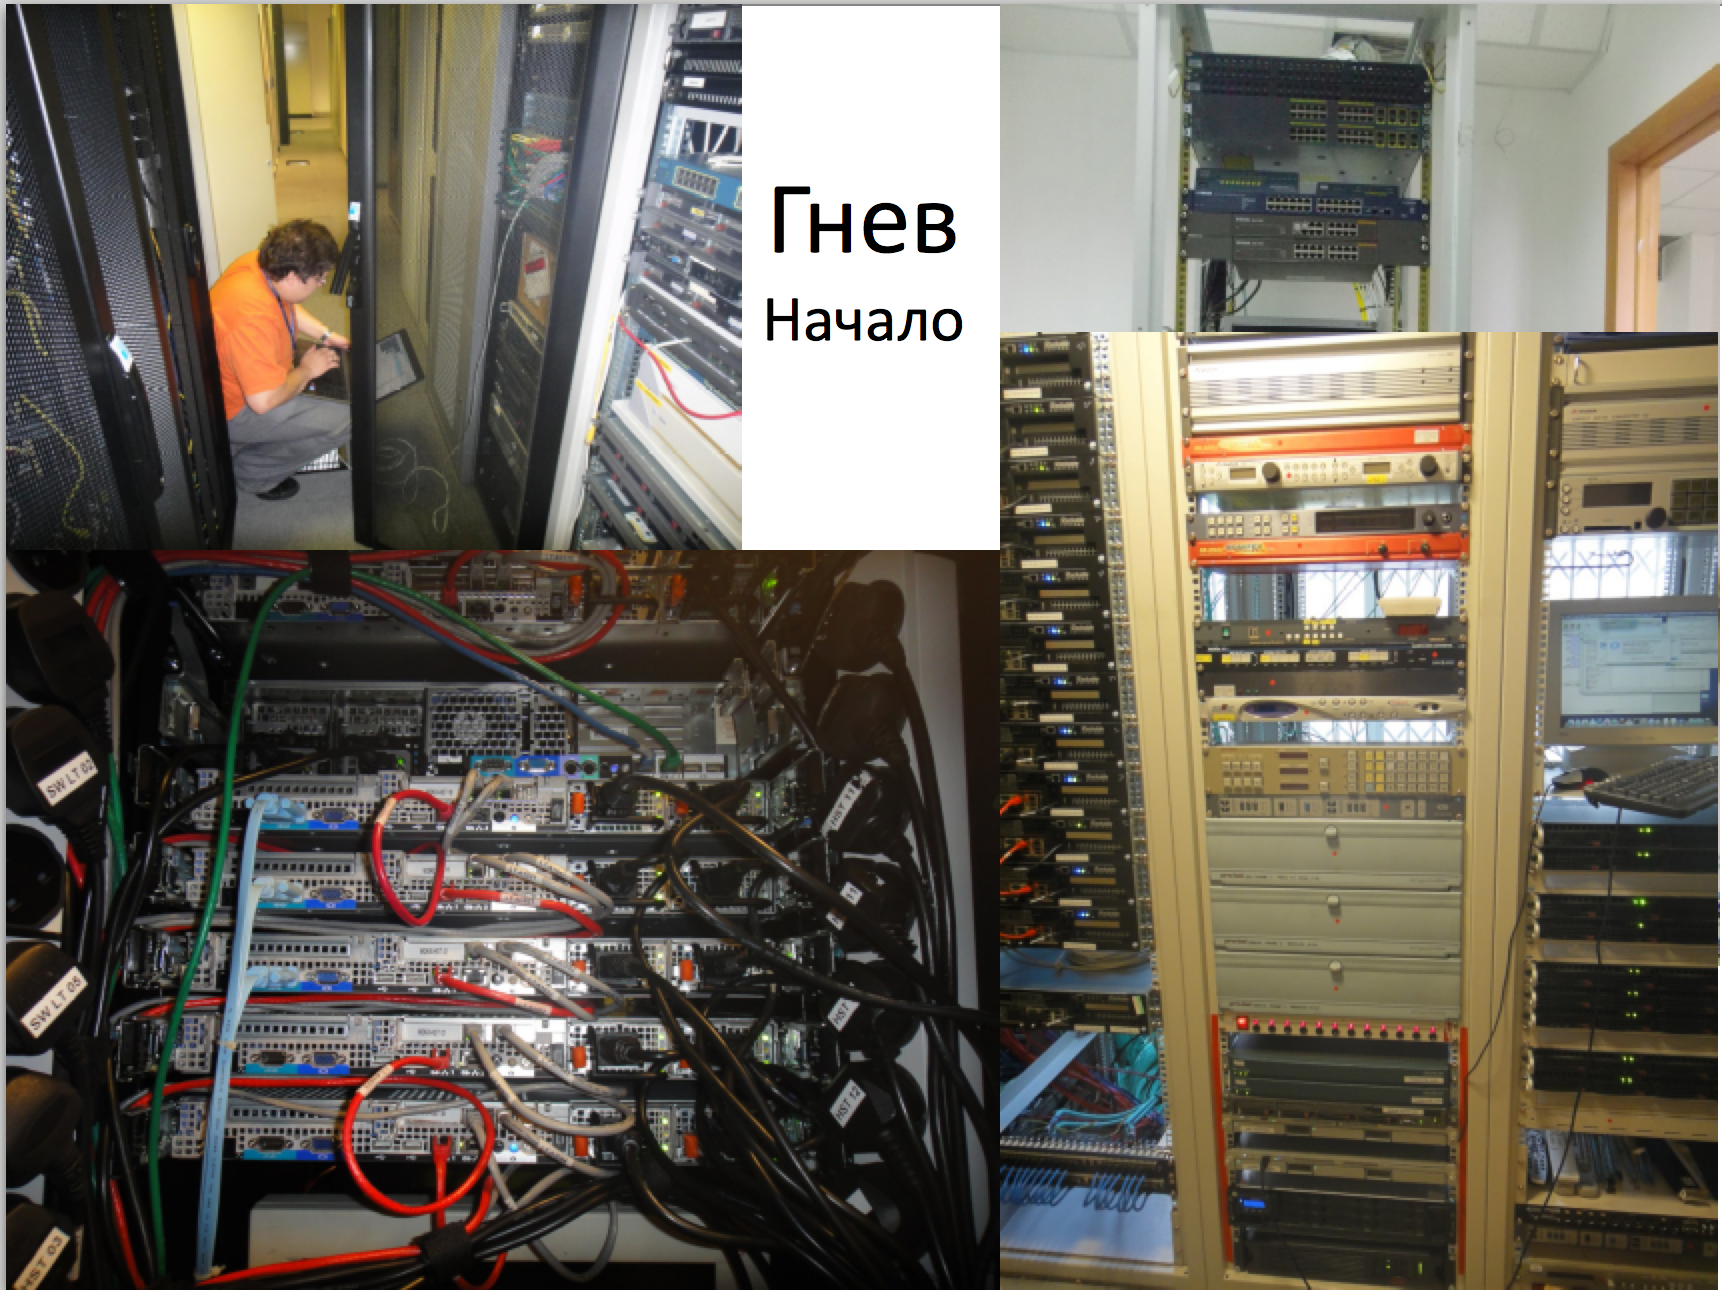
Anger
Under the influence of the experience gained, my vision of monitoring began to change. This process coincided with the change of work. After leaving the university and the manufacturing company, I began working in small outstaffing firms:
- The first company had three offices, 100 users, one desk in the data center and two system administrators. The server park consisted of 100 machines located 5,000 km from me, and there were 1,200 clients on the hosting.
- In the second company there were 400 servers, to which only 12,000 km, two corporate sites and one system administrator.
By that time, I already thought that:
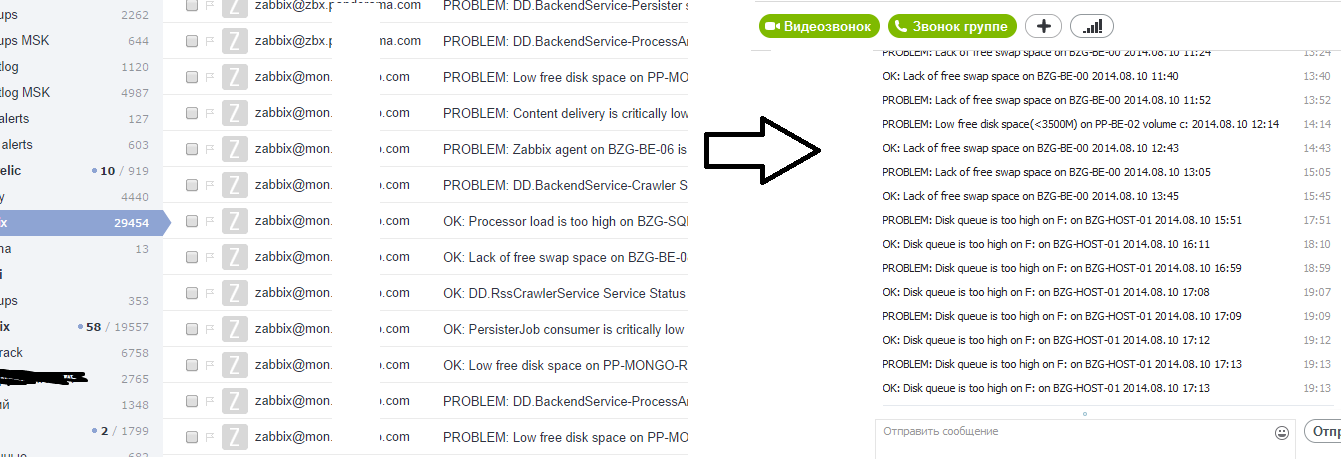
- You need to monitor everything. Including the fact that no one needs. All events are important, and information about them should be sent to the maximum number of people. Including the bosses. By SMS. At night. Has the processor on the server been loaded at 95% within 35 seconds? No time to explain, you must urgently send SMS!
At the same time, the toolkit was actively developed and transformed. Initially, there was a pack of scripts that control various metrics (free space, the number of available updates, the result of backups, and so on), as well as third-party services Red Alert, Lazy Farmer (in-house development - an attempt to replace the site verification service).
In this configuration, the monitoring system existed for about a year, but during this time many shortcomings have emerged:
- Numerous delays in the work of servers due to the work of scripts.
- Unknown resource utilization.
- Difficult to find sources of problems.
The question arose how to simplify your life. Considered options with Dude / Nagios / Zabbix. The main criterion for choosing was the speed of deployment, and the choice fell on Zabbix.
In it, everything was put on monitoring, up to which the hands reached out:
- Number of users connected to WiFi.
- The number of pages printed on the printer.
- Free memory on the router.
- The number of VPN tunnels on the router.
- The temperature on the servers.
- The openness of the server cover.
- The load on the network interfaces of the switches.
- … and much more.
Separately, I want to mention the features of implementation and work with Zabbix:
- Servers are far, and there are a lot of metrics. When gaps began to appear, they introduced Zabbix proxy.
- When the tunnel crashes, a lot of alerts are generated about server unavailability, I had to configure dependencies.
- We automated actions of the same type with alerts: first, the system tries to repair it on its own (for example, clean the disk), and only in case of failure sends an alert. To reduce the response time to an alert, we set up an SMS messaging.
- To prevent alerts from falling all day and night as an SMS, you do not need to set up alerts that the CPU has been loaded 100% on the server for 5 seconds.
- When monitoring complex metrics, part of the values was lost due to the resource-intensiveness of the process. Although the data was sent to the monitoring server, he did not have time to register everything.
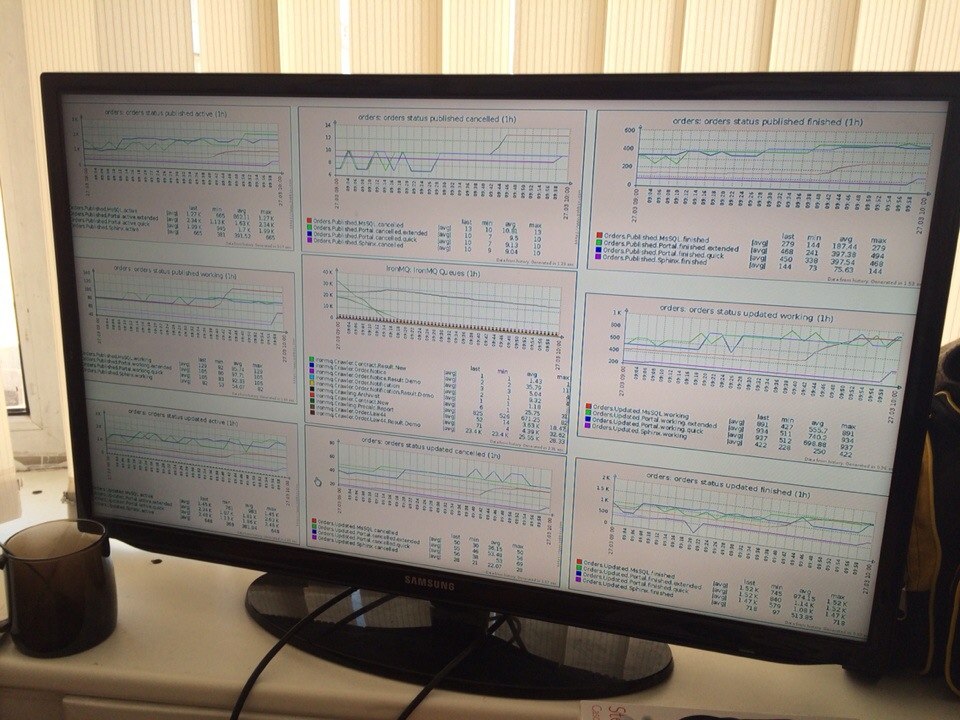
- Sphinx has a bunch of services that may change. New servers are automatically detected and put on monitoring. There are situations when the web server is running, but the user sees a fig instead of a page. In such cases, we ran user scripts on the web, and in case of problems, the system sent an alert.
- Usually, customers want all tasks / problems to be displayed in one place, so we created a task when an event critical to business processes occurred.
- Collecting unhandled exceptions is long and tedious, so when an event occurred, we processed it in the eventlog and created a task.
- Customers do not read letters, so we wrote them on Skype (zabbix2skype).
- Quis custodiet ipsos custodes? Who will monitor the monitoring? I never found an answer for myself.
Humility
A few years later I came to humility. Again, this period partly coincided with the change of place of work. Three data centers, thousands of servers, thousands of employees, offices throughout the Russian Federation, and not only.
I realized for myself that the business is not interested in the load on the CPU and other technical details. Owners and managers think in other categories: downtime / information system / loss of profits ...
I liked Zabbix, but I saw that there are other systems (third-party solutions, heavily modified by the file, or self-written) that are tightly integrated with the customer's business.
The main ideas I came to: It is necessary to combine servers into information systems so that everyone can see the same picture and understand the relationships.
- You can't keep everything in your head, there should be a repository of knowledge about the infrastructure (who is responsible for the server, where it is, and so on). It is necessary to simplify and unify the monitoring setup (SNMP instead of agents).
- It is important that the monitoring system has a friendly interface that allows even non-IT professionals to understand the situation.
- If the information system does not work, this is not a reason to raise everyone in alarm at 3 at night. It is necessary to negotiate with the customer the allowable duration of downtime and reaction.
- There is no silver bullet - you have to make compromises when choosing metrics to track, when creating notification rules, when automating standard actions, and so on.
So, in brief, the ideas about monitoring as such, its tasks and ways of implementation have evolved. Of course, the conditions prevailing in the companies where I worked, and the people who worked with me, had a great influence on this process.
UPD: Russian version
')
Source: https://habr.com/ru/post/339330/
All Articles