Profiling PL / SQL code with IDE PL / SQL Developer
Problems and purpose:
Periodically, Oracle developers are faced with the problem of the performance of PL / SQL code. There are problems in order to find the location of the pl / sql code in which problems arise.
Usually, profiling the pl / sql code is used when it is necessary to determine the performance problem in a very large method, or when the method has many internal dependencies with a lot of logic, and there is no understanding of where the code is inhibited.
Methods for solving the problem:
In solving the problems with performance in the Oracle database will help us:
')
- PL / SQL Developer - Popular IDE for Oracle developers.
- DBMS_PROFILE - Oracle profiling package (will not be considered in this article, because there is enough information on the Internet).
Method (procedure) for profiling:
In this article I will show only the approach to profiling, so the method that we will profile will not be large.
Create a method for profiling:
create or replace procedure check_cycle_performance(p_cycle_size in number) is c_method_error constant number := -20000; c_method_error_message constant varchar2(4000) := 'Cycle size should be > 0'; l_power_value number; l_dual_value number; begin if p_cycle_size > 0 then --Cycle with power calculation for i in 1 .. p_cycle_size loop l_power_value := power(i, 2); end loop; --Cycle with switching context(sql-pl/sql) for i in 1 .. p_cycle_size loop select i into l_dual_value from dual; end loop; else raise_application_error(c_method_error, c_method_error_message); end if; end check_cycle_performance; Profiling through PL / SQL Developer IDE:
In pl / sql Developer, run the Test Window:
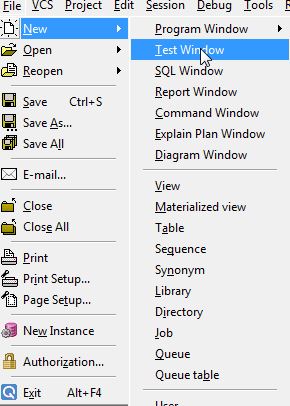
Figure 1 - Launch the Test Window
In the test window, type the code to run the check_cycle_performance method, fill in the input variable l_cycle_size, and click the button to start profiling:
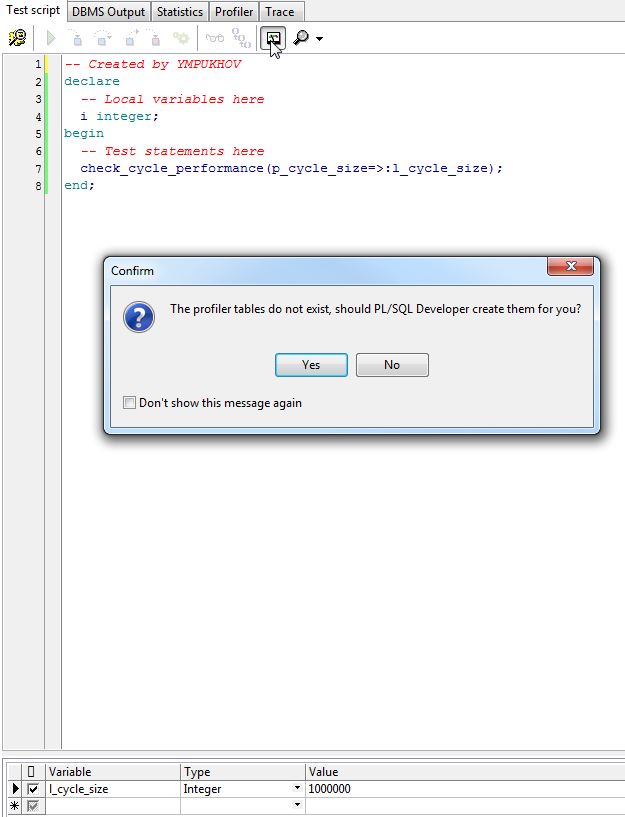
Figure 2 - Starting profiling in PL / SQL Developer
After the launch, a dialog box will appear, which will offer to create a table for the profiler, agree.
Next on F8 we run the method, after its execution we go to the Profiler tab:
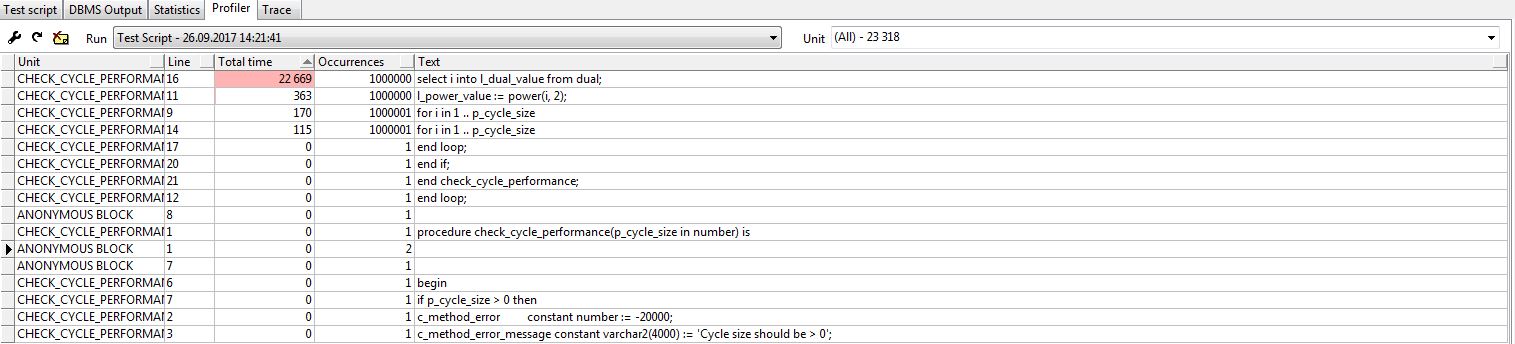
Figure 3 - Profiler window in PL / SQL.
From Figure 3 it can be seen that the main performance problem is in line 16.
It's not hard to see that the main performance problem lies in the SQL context switching - PL / SQL .
In this case, the exponentiation: line 11, takes much less time.
On measures to prevent context switching, we consider in the framework of another article.
Source: https://habr.com/ru/post/339108/
All Articles