Periods of sidereal days in radioactive decay
Here we will talk about the algorithm for comparing the probability density functions of radioactive decay, showing periodicity in sidereal days and sidereal year.
* sidereal year - the period of the orbital motion of the Earth around the Sun in the inertial reference frame (relative to "fixed stars");
This article is a massive continuation of the introductory article of 2014 for periods in radioactivity
')
Findings:
- The form of probabilities is nonrandom and depends on cosmophysical causes.
- The form of probabilities with a high probability is repeated with a frequency of solar and sidereal days, solar and sidereal years
- The form of probabilities is similar in the near future.
- Probability forms are often chirally symmetric.
Academy
More information about this study is written in the book.
And articles on the successes of the physical sciences: one and two .
And now the algorithm itself and more about the problem!

The task was as follows: there is a two-week series of radioactive decay frequencies per second (just 1639763 seconds {example 5 seconds: 310 311 299 312 305}). It has already been established by an expert method that the patterns of probability density functions (an example of 2 similar functions at the top of a paragraph} (60 seconds in each histogram) resemble each other with good accuracy every 1436 minutes {those very high points - 23h 56m}. It is required to confirm the finding mathematically.
The continuation of the pikmatch function (from the far corner of the article) the most important thing is the combinatorial comparison of critical points.
ret = (ab1 / ab2) / (nb1 / nb2); - The ratio of the height (y axis) of critical points within one function to the same ratio within another function
re = (ac1 / ac2) / (nc1 / nc2) - Same as in the previous case, but now along the x axis the length between points
red = (φ ° / ξ °) / (θ ° / τ °) - Finally we measure the angles
rme = (ab1 + 1) * (ab2 + 1) * (nb1 + 1) * (nb2 + 1); - coefficient of importance of the relationship
Now the final formula is res = re * red * ret * rme
res is an indicator of the similarity of function 1 to function 2
The second part of the pikmatch () function
Before comparing, we align one function relative to another with the DTW algorithm and find the corresponding vertices:

Example Euclidean Distance
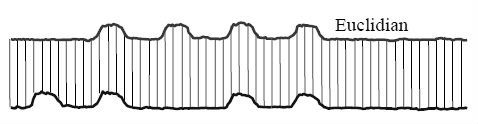
And dynamic time warping

Load a log of examples of similar images and create a running average function to smooth the histograms to probability density functions.
Euclidean distance, for aligning the image with a horizontal offset:
Finding peaks:
The Dynamic Time Warping method for the exact ratio of the vertices of the probability function to the vertices of the 2 probability functions:
Now we apply the DTW method to search for the correspondence of the vertices of one curve to another, and if an extra vertex is found for one of the functions, we write a flat point on the curve with the same indentation at the vertex, as if we actually have a critical point.
The final part of the code, where alignment and comparison of 1440 consecutive pictures are performed to search for a high point. It is found in +368 minutes as indicated in the reference book Year Year = 365.2564 days
0.2564 * 1440 minutes per day = 369.216
1440-1072 = 368 minutes added to the year
Since in python the countdown starts from 0 element, the sidereal day counts from -3 minutes (+1436 minutes) from 1440 (+1440 the beginning of a new period), and the stellar year from 1440-1072 minutes.
Examples of similar pictures:

Despite the fact that the Shnol effect states that the solar day and the solar year are found, no such periods have been found.
Starry days were found in the vicinity of +1440 - i minutes +1436 minutes:
Star year - all day were calculated from 365 to 366 days of the new year:
1440-1072, that is, +369 additional minute of the new year. Precisely stellar year is 365 days and 369 minutes [365.2564]!
For those who decide to check everything themselves and it is possible to improve image recognition all the code and data are available on Github
Thanks for attention!
* sidereal year - the period of the orbital motion of the Earth around the Sun in the inertial reference frame (relative to "fixed stars");
This article is a massive continuation of the introductory article of 2014 for periods in radioactivity
')
Findings:
- The form of probabilities is nonrandom and depends on cosmophysical causes.
- The form of probabilities with a high probability is repeated with a frequency of solar and sidereal days, solar and sidereal years
- The form of probabilities is similar in the near future.
- Probability forms are often chirally symmetric.
Academy
More information about this study is written in the book.
And articles on the successes of the physical sciences: one and two .
And now the algorithm itself and more about the problem!
The task was as follows: there is a two-week series of radioactive decay frequencies per second (just 1639763 seconds {example 5 seconds: 310 311 299 312 305}). It has already been established by an expert method that the patterns of probability density functions (an example of 2 similar functions at the top of a paragraph} (60 seconds in each histogram) resemble each other with good accuracy every 1436 minutes {those very high points - 23h 56m}. It is required to confirm the finding mathematically.
The continuation of the pikmatch function (from the far corner of the article) the most important thing is the combinatorial comparison of critical points.
ret = (ab1 / ab2) / (nb1 / nb2); - The ratio of the height (y axis) of critical points within one function to the same ratio within another function
re = (ac1 / ac2) / (nc1 / nc2) - Same as in the previous case, but now along the x axis the length between points
red = (φ ° / ξ °) / (θ ° / τ °) - Finally we measure the angles
rme = (ab1 + 1) * (ab2 + 1) * (nb1 + 1) * (nb2 + 1); - coefficient of importance of the relationship
Now the final formula is res = re * red * ret * rme
res is an indicator of the similarity of function 1 to function 2
The second part of the pikmatch () function
for e in range(len(p)+len(p1)): for l in range(len(p)+len(p1)): if e>=len(p): me=minx[e-len(p)];pe=p1[e-len(p)];nme=nm1[e-len(p)]; else: me=maxx[e];pe=p[e];nme=nm[e]; if l>=len(p): ml=minx[l-len(p)];pl=p1[l-len(p)];nml=nm1[l-len(p)]; else: ml=maxx[l];pl=p[l];nml=nm[l]; red1=1;red=1;ab=y[pl]-y[pe];ac=pe-pl;au=x[ml]-x[me];ao=me-ml;hip=math.sqrt(ab**2+ac**2);hipe=math.sqrt(ao**2+au**2); if (hip!=0)and(hipe!=0): if math.asin(abs(au)/hipe)!=0: red=abs(abs(math.asin(abs(ab)/hip)/math.asin(abs(au)/hipe))); # ret=abs(1-abs((0.00+abs((y[pl]+0.01)/(y[pe]+0.01)))/(0.00+abs((x[ml]+0.01)/(x[me]+0.01)))));uj=uj+1; re=0+abs(1-abs(float(abs(pe-pl)+1))/float(abs(me-ml)+1));rme=(y[pe]+1)*(y[pl]+1)*(x[me]+1)*(x[ml]+1);rmu+=rme; res+=abs(re*rme*red*ret); return len(pi)*len(pi),res/uj,p,p1; # /uj? rmu Before comparing, we align one function relative to another with the DTW algorithm and find the corresponding vertices:
Example Euclidean Distance
And dynamic time warping
Load a log of examples of similar images and create a running average function to smooth the histograms to probability density functions.
ma0=[];ma0.append([line.strip() for line in open('/users/andrejeremcuk/downloads/0505.jnl')]); massa=[];m=[[0] for e in range(len(ma0[0]))];massamyfile=[]; import re t=3;summa=[]; for e in range(3,len(ma0[0])/2): #len(ma0[0]) disguise=re.findall(r":(.+?) ", ma0[0][t]);disguise1=re.findall(r"- #1:(.*)", ma0[0][t]); summa.append(int(disguise[0]));summa.append(int(disguise1[0]));t=t+2; k=0;summ=[];sum1=[]; for e in range(len(summa)/2): summ.append(summa[k]);sum1.append(summa[k+1]);k=k+2; import random import numpy as np from collections import defaultdict import math import matplotlib.pyplot as plt def movingaverage(interval, window_size): window = np.ones(int(window_size))/float(window_size) return np.convolve(interval, window, 'same') Euclidean distance, for aligning the image with a horizontal offset:
def euclid(x,y): re=0.0;res=0;a=1 for i in range(len(x)): re=re+abs(x[i]-y[i])**1 return abs((re)/len(x))#,math.sqrt(abs(res)); Finding peaks:
def pik(x,y): pikx=[];piky=[];c=0;v=0;cy=0;vy=0;minx=[];miny=[];maxx=[];maxy=[];minmaxx=[];minmaxy=[];#x=x.tolist();y=y.tolist(); for e in range(1,len(x)-2): if (x[e-1]<x[e]>x[e+1])or((x[e-1]<x[e]==x[e+1])and(x[e]>x[e+2])): maxx.append(e);minmaxx.append(e);c+=1; if (x[e-1]>x[e]<x[e+1])or((x[e-1]>x[e]==x[e+1])and(x[e]<=x[e+2])): minx.append(e);minmaxx.append(e);v+=1; if (len(maxx)>1)and(minmaxx[c+v-2]==maxx[c-2])and(minmaxx[c+v-1]==maxx[c-1]): del maxx[c-2];del minmaxx[c+v-2];c-=1; if (len(minx)>1)and(minmaxx[c+v-2]==minx[v-2])and(minmaxx[c+v-1]==minx[v-1]): del minx[v-2];del minmaxx[c+v-2];v-=1; for e in range(1,len(y)-2): if (y[e-1]<y[e]>y[e+1])or((y[e-1]<y[e]==y[e+1])and(y[e]>y[e+2])): maxy.append(e);minmaxy.append(e);cy+=1; if (y[e-1]>y[e]<y[e+1])or((y[e-1]>y[e]==y[e+1])and(y[e]<=y[e+2])): miny.append(e);minmaxy.append(e);vy+=1; if (len(maxy)>1)and(minmaxy[cy+vy-2]==maxy[cy-2])and(minmaxy[cy+vy-1]==maxy[cy-1]): del maxy[cy-2];del minmaxy[cy+vy-2];cy-=1; if (len(miny)>1)and(minmaxy[cy+vy-2]==miny[vy-2])and(minmaxy[cy+vy-1]==miny[vy-1]): del miny[vy-2];del minmaxy[cy+vy-2];vy-=1; return maxx,maxy,minx,miny,pikx,piky,minmaxx,minmaxy; The Dynamic Time Warping method for the exact ratio of the vertices of the probability function to the vertices of the 2 probability functions:
import numpy import numpy as np from numpy.fft import fft, fftfreq import matplotlib.pyplot as plt from numpy import linspace, loadtxt, ones, convolve from numpy import array, zeros, argmin, inf from numpy.linalg import norm def _trackeback(D): i, j = array(D.shape) - 1 p, q = [i], [j] while (i > 0 and j > 0): tb = argmin((D[i-1, j-1], D[i-1, j], D[i, j-1])) if (tb == 0): i = i - 1 j = j - 1 elif (tb == 1): i = i - 1 elif (tb == 2): j = j - 1 p.insert(0, i) q.insert(0, j) p.insert(0, 0) q.insert(0, 0) return (array(p), array(q)) def dtw(dr): r, c = len(dr), len(dr[0]); D = zeros((r + 1, c + 1)); D[0, 1:] = inf D[1:, 0] = inf for i in range(r): for j in range(c): D[i+1, j+1] = dr[i][j]; for i in range(r): for j in range(c): D[i+1, j+1] += min(D[i, j], D[i, j+1], D[i+1, j]) D = D[1:, 1:]; dist = D[-1, -1] / sum(D.shape); return dist, D, _trackeback(D) Now we apply the DTW method to search for the correspondence of the vertices of one curve to another, and if an extra vertex is found for one of the functions, we write a flat point on the curve with the same indentation at the vertex, as if we actually have a critical point.
def pikmatch(x,y,maxx,maxy,optimal,minmaxx,miny,minx): uj=0;pikk=[[float("inf") for m in range(len(maxy))] for t in range(len(maxx))];pi=[0 for m in range(len(maxx))];ret=1;p=[];nad=0;wax=[];way=[];re=1; for e in range(len(maxx)): for l in range(len(maxy)): pikk[e][l]=(((abs(x[maxx[e]]-y[maxy[l]])+0.001)**1)*(abs(maxx[e]-maxy[l]+optimal)+1)); pi[e]=min(pikk[e]);p.append(pikk[e].index(min(pikk[e])));p[e]=maxy[p[e]];nad=nad+pi[e]; if len(minx)==0: minx=[];minx.append(1) if len(miny)==0: miny=[];miny.append(1) dob=1;res=0;pikk1=[[float("inf") for m in range(len(miny))] for t in range(len(minx))];p1=[];pi1=[0 for m in range(len(minx))]; for e in range(len(minx)): for l in range(len(miny)): pikk1[e][l]=(((abs(x[minx[e]]-y[miny[l]])+0.001)**1)*(abs(minx[e]-miny[l]-optimal)+1)); pi1[e]=min(pikk1[e]);p1.append(pikk1[e].index(min(pikk1[e])));p1[e]=miny[p1[e]];nad=nad+pi1[e]; dt1=dtw(pikk);dt=dt1[2];dt2=dtw(pikk1);dt3=dt2[2]; for v in range(len(dt[1])): p[dt[0][v]]=maxy[dt[1][v]];pi[dt[0][v]]=pikk[dt[0][v]][dt[1][v]]; if (v>0)and(dt[0][v]==dt[0][v-1])and(pikk[dt[0][v-1]][dt[1][v-1]]<pi[dt[0][v]]): p[dt[0][v]]=maxy[dt[1][v-1]];pi[dt[0][v]]=pikk[dt[0][v-1]][dt[1][v-1]]; for v in range(len(dt3[1])): p1[dt3[0][v]]=miny[dt3[1][v]];pi1[dt3[0][v]]=pikk1[dt3[0][v]][dt3[1][v]]; if (v>0)and(dt3[0][v]==dt3[0][v-1])and(pikk1[dt3[0][v-1]][dt3[1][v-1]]<pi1[dt3[0][v]]): p1[dt3[0][v]]=miny[dt3[1][v-1]];pi1[dt3[0][v]]=pikk1[dt3[0][v-1]][dt3[1][v-1]]; nm=p[:];nm1=p1[:];rmu=1;pp=p;pp1=p1; D = defaultdict(list);D1 = defaultdict(list); for i,item in enumerate(p): D[item].append(i) for i,item in enumerate(p1): D1[item].append(i) D = {k:v for k,v in D.items() if len(v)>1};D1 = {k:v for k,v in D1.items() if len(v)>1} for v in range(len(D.keys())): mah=inf; for e in range(len(D[D.keys()[v]])): mah=pi[D[D.keys()[v]][e]] if pi[D[D.keys()[v]][e]]<mah else mah k=pi.index(mah); if (minmaxx.index(maxx[k])+1)<len(minmaxx): perem=minx.index(minmaxx[minmaxx.index(maxx[k])+1]) if (minmaxx.index(maxx[k])-1)>-1: perem1=minx.index(minmaxx[minmaxx.index(maxx[k])-1]) for e in range(len(D[D.keys()[v]])): if D[D.keys()[v]][e]!=k: ms=D[D.keys()[v]][e];p[ms]=p[k]-(maxx[k]-maxx[ms]); if ((maxx[k]-maxx[ms])<0)and(pp1.count(pp1[perem])==1): p1[perem]=p[ms]-(maxx[ms]-minx[perem]); if ((maxx[k]-maxx[ms])>0)and(pp1.count(pp1[perem1])==1): p1[perem1]=p[ms]-(maxx[ms]-minx[perem1]); for v in range(len(D1.keys())): mah=inf; for e in range(len(D1[D1.keys()[v]])): mah=pi1[D1[D1.keys()[v]][e]] if pi1[D1[D1.keys()[v]][e]]<mah else mah k=pi1.index(mah);#print minmaxx,minx,maxx,(minmaxx.index(minx[k])+1),maxx.index(minmaxx[minmaxx.index(minx[k])+1]) if (minmaxx.index(minx[k])+1)<len(minmaxx): perem=maxx.index(minmaxx[minmaxx.index(minx[k])+1]) if (minmaxx.index(minx[k])-1)>-1: perem1=maxx.index(minmaxx[minmaxx.index(minx[k])-1]) for e in range(len(D1[D1.keys()[v]])): if D1[D1.keys()[v]][e]!=k: ms=D1[D1.keys()[v]][e];p1[ms]=p1[k]-(minx[k]-minx[ms]); if ((minx[k]-minx[ms])<0)and(pp.count(pp[perem])==1): p[perem]=p[ms]-(minx[ms]-maxx[perem]); if ((minx[k]-minx[ms])>0)and(pp.count(pp[perem1])==1): p[perem1]=p[ms]-(minx[ms]-maxx[perem1]); for i in range(len(p1)): if p1[i]>59: p1[i]=59; if p1[i]<0: p1[i]=0; for i in range(len(p)): if p[i]>59: p[i]=59; if p[i]<0: p[i]=0; The final part of the code, where alignment and comparison of 1440 consecutive pictures are performed to search for a high point. It is found in +368 minutes as indicated in the reference book Year Year = 365.2564 days
0.2564 * 1440 minutes per day = 369.216
1440-1072 = 368 minutes added to the year
Since in python the countdown starts from 0 element, the sidereal day counts from -3 minutes (+1436 minutes) from 1440 (+1440 the beginning of a new period), and the stellar year from 1440-1072 minutes.
def stat_distanc(counter): koeff=60;ex=20;ko=60;b=[0 for e in range(ko+ex)];bb=[0 for e in range(ko+ex)];#C:\\28-08-2004.txt /usr/local/28-08-2004.txt matrix = [line.strip() for line in open('/users/andrejeremcuk/downloads/0505.txt')]; #days.dat matri = [line.strip() for line in open('/users/andrejeremcuk/downloads/0506.txt')]; #days.dat arra=[[ 0 for e in range(koeff)] for t in range(int(len(matrix)/koeff))];harra=[0 for t in range(int(len(matrix)/koeff))]; arrab=[[ 0 for e in range(koeff)] for t in range(int(len(matrix)/koeff))];harrab=[0 for t in range(int(len(matrix)/koeff))];z=0;resume=1;resum=0; arr=[[ 0 for e in range(koeff)] for t in range(int(len(matri)/koeff))]; for i in range(len(matrix)): matrix[i]=int(matrix[i]);matri[i]=int(matri[i]); for jk in range(2880): #int(len(matrix)/koeff) for mk in range(koeff): arra[jk][mk]=matrix[z];arr[jk][mk]=matri[z];z=z+1; for jk in range(2880): harra[jk]=np.histogram(arra[jk], bins=ko, density=False);harrab[jk]=np.histogram(arr[jk], bins=ko, density=False);harra[jk]=harra[jk][0];harrab[jk]=harrab[jk][0] for u in range(5): harra[jk] = movingaverage(harra[jk], 4);harrab[jk]=movingaverage(harrab[jk], 4); for mk in range(1440):# 24000 mi=[];mis=[];mis1=[];mii=[];ei=[];ti=[];dots=[];dots1=[]; if counter=='l': rn=random.randint(0,1439);x=harra[mk];y=harrab[random.randint(0,1439)];#print rn; #y=harra[random.randint(0,1439)]; elif counter=='o': x=harra[summ[mk]-1];y=harra[sum1[mk]-1]; else: x=harra[mk+1440-counter];y=harrab[mk]; x=x.tolist();y=y.tolist(); for kl in range(ko): b[kl+ex/2]=y[kl]; for m in range(ex): ct=[0 for e in range(ko+ex)]; for l in range(ko): ct[l+m]=x[l]; mis.append(euclid(ct,b));mis1.append(euclid(ct[::-1],b)); optimal=mis.index(min(mis))-ex/2;ret=pik(x,y);minmaxx=ret[6];minmaxy=ret[7];maxx=ret[0];maxy=ret[1];minx=ret[2];miny=ret[3] optimal1=mis1.index(min(mis1))-ex/2;#print mk; for k in range(len(minmaxx)): dots.append(x[minmaxx[k]]);#minmaxx[k]=59-minmaxx[k]; for k in range(len(minmaxy)): dots1.append(y[minmaxy[k]]);#minmaxy[k]=59-minmaxy[k] outputs=pikmatch(x,y,maxx,maxy,-optimal,minmaxx,miny,minx); outputs1=pikmatch(y,x,maxy,maxx,optimal,minmaxy,minx,miny); plt.plot(minmaxx,dots,'go', alpha=0.5, ms=10);plt.plot(minmaxy,dots1,'bo', alpha=0.5, ms=10); plt.plot(y,linewidth=4, alpha=0.5);plt.plot(x,linewidth=4, alpha=0.5);#plt.show(); mx1=minmaxx[:];my1=minmaxy[:];mxx1=maxx[:];mxx2=minx[:] for k in range(len(minmaxx)): dots.append(x[minmaxx[k]]);minmaxx[k]=59-minmaxx[k]; for k in range(len(maxx)): maxx[k]=59-maxx[k]; for k in range(len(minx)): minx[k]=59-minx[k]; minmaxx=minmaxx[::-1];maxx=maxx[::-1];minx=minx[::-1]; output=pikmatch(x[::-1],y,maxx,maxy,-optimal1,minmaxx,miny,minx);minmaxx=minmaxx[::-1];mx2=minmaxx[:]; # for k in range(len(minmaxy)): dots1.append(y[minmaxy[k]]);#minmaxy[k]=59-minmaxy[k] minmaxx=mx1[:]; output1=pikmatch(y,x[::-1],maxy,maxx,optimal1,minmaxy,minx,miny); resume+=min(outputs1[1]+outputs[1],output[1]+output1[1]); #minmaxx=mx2[:];plt.plot(minmaxx,dots,'go');plt.plot(my1,dots1,'bo');plt.plot(y);plt.plot(x[::-1]);plt.show(); #plt.plot(x); return resume/10000; stat_distanc('o') stat_distanc(1072) Examples of similar pictures:
Despite the fact that the Shnol effect states that the solar day and the solar year are found, no such periods have been found.
Starry days were found in the vicinity of +1440 - i minutes +1436 minutes:
199.892665349 -10 i 203.488567732 -9 i 209.135017031 -8 196.712944345 -7 201.306389699 -6 209.494707844 -5 213.761404735 -4 220.989501281 -3 214.488889148 -2 207.859987762 -1 221.399812849 0 208.188622006 1 202.261474872 2 195.414598182 3 ! 203.675784045 4 210.319165323 5 210.090229703 6 223.712227452 7 231.477304378 8 204.582579082 9 Star year - all day were calculated from 365 to 366 days of the new year:
bas=[]; for i in range(1440): bas.append(stat_distanc(i));print i; min(bas) - 1072 1440-1072, that is, +369 additional minute of the new year. Precisely stellar year is 365 days and 369 minutes [365.2564]!
For those who decide to check everything themselves and it is possible to improve image recognition all the code and data are available on Github
Thanks for attention!
Source: https://habr.com/ru/post/339078/
All Articles