About interval indices

Under the cut, we will understand whether a special index is needed for indexing intervals, how to deal with multidimensional intervals, is it true that a 2-dimensional rectangle can be treated as a 4-dimensional point, etc. All this with the PostgreSQL example.
In the development of the topic ( 1 , 2 , 3 , 4 , 5 , 6 , 7 ).
Sometimes data are not values, but, say, a confidence interval. Or is it really the intervals of values. Again, the rectangle is also an interval, only not one-dimensional. Is it possible to check for logarithmic time the presence of intervals in the data intersecting with the desired one?
')
Yes of course. Sometimes they come up with ingenious schemes for this with calculating and indexing block (with further accurate filtering) values based on, for example, Gray codes . In this case, the interval with loss of accuracy is encoded into a certain (indexable) number; when searching for an interval, it generates a set of values (subintervals) that should be checked. This set is limited to logarithm.
But GiST can use R-trees for indexing time intervals (tsrange).
create table reservations(during tsrange); insert into reservations(during) values ('[2016-12-30, 2017-01-09)'), ('[2017-02-23, 2017-02-27)'), ('[2017-04-29, 2017-05-02)'); create index on reservations using gist(during); select * from reservations where during && '[2017-01-01, 2017-04-01)'; Of course, the author, with his
So how does an R-tree handle intervals? Just like with other spatial objects. An interval is a one-dimensional rectangle; when splitting a page, an R-tree tries to minimize the dispersion inside the descendant pages and maximize it between them.
Is it possible to turn the interval to a point? Considering, for example, its beginning is X, and the end is Y. Formally, after all, who can forbid us to use two numbers as a two-dimensional point? But in such data there will be an internal dependence. And semantics in data will lead to semantics in search queries and interpretation of results.
The easiest way to understand the situation, looking at her eyes.
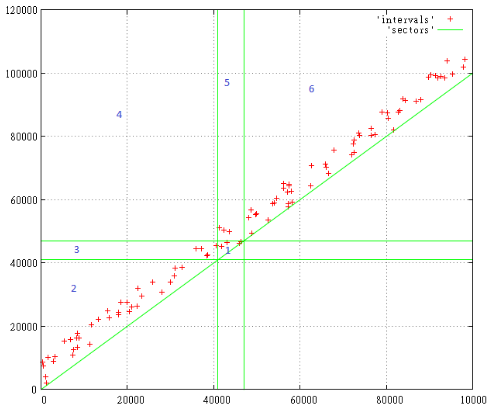
Here are 100 random intervals ranging in size from 0 to 10,000 with the beginning of the interval from 0 to 100,000.
1
The search query is [41 000 ... 47 000], we are interested in all the intervals intersecting with the specified range.
The numbers indicate the search zones that arise. All that is below the diagonal for obvious reasons does not exist.
So, by zones:
- here are the intervals that are strictly inside the search query
- here everything that began and ended before the interval we need
- these intervals began before, and ended during the search query
- here those intervals that completely cover the search
- these intervals began at the time, and ended after the request
- here everything that began and ended after him
Thus, to search for all intersections, the query must be expanded to [0 ... 47 000, 41 000 ... 100 000], i.e. it should include zones 1,3,4,5.
The fact that the request has become the size of a quarter of the entire layer should not be frightening, because only a narrow strip along the diagonal is inhabited. Yes, there may be large intervals the size of the entire layer, but they are relatively small.
Of course, large objects will have an impact on performance, but nothing can be done about it, because they really exist and really should get into issuing almost any request. If you try to index the “macaroni monster”, the index will actually stop working, it will be cheaper to look at the table and filter out the excess.
However, apparently, any method of indexation is sick of such data.
Are there any other disadvantages of this approach? Since the data has “degenerated” in some way, it is possible that the heuristics of splitting the pages of the R-tree will be less effective. But the biggest inconvenience is that we must constantly keep in mind that we are dealing with an interval and correctly set search queries.
However, this already refers not to the R-tree, but to any spatial index. Including the Z-curve (built on a Z-order B-tree), which we used earlier. For Z-curve, data degeneration does not matter, because these are just numbers with their natural order.
Among other things, the Z-curve is also more compact than the R-tree. Therefore, we will try to clarify its perspectives in the designated area.
For example, we have assumed that the X-coordinate is the beginning of the segment, and the Y-its end. What if the opposite ? The R-tree should not care, for Z-curve, too, little will change. The crawling of pages will be organized differently, but on average the number of pages read will be the same.
How about mirroring the data on one of the axes . In the end, we have the same Z-curve (mirrored by Y), so let the data lie on the slanting crossbar of the letter Z. Well, let's do a numerical experiment.
Take 1000 random intervals and divide them into 10 pages depending on the Z-value. Those. sort and divide by 100 pieces, then see what we did. Prepare 2 sets - X, Y and max (X) -X, Y
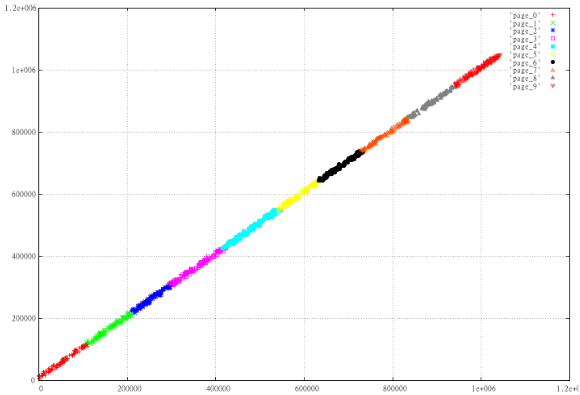
Figure 2: Normal Z-curve
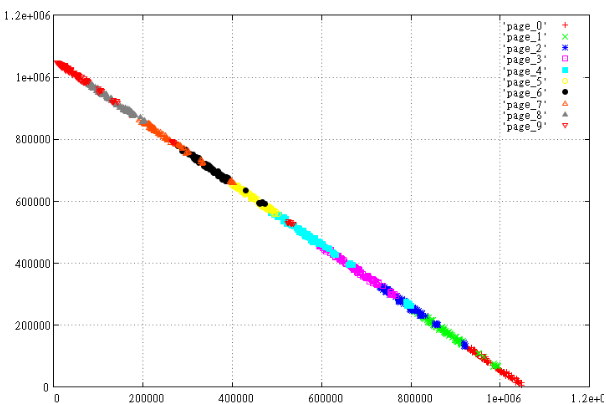
Figure 3 Mirrored data.
It is clearly seen how “worse” the displayed data is arranged, the pages crawl over each other, the perimeter of the pages is much larger, and this is a guarantee that on average, other things being equal, this option will read more pages.
Why did this happen? In this case, the reason lies on the surface. For the 2-dimensional rectangle Z-value of the lower left corner <= than for the upper right. Therefore, the ideal way to more carefully cut into pages almost linear data is to arrange them along the line X = Y.
And if you index not the beginning-end of the range, but its center-length ? In this case, the data will stretch along the X axis, as if we had rotated Figure 2 clockwise by 45 degrees. The problem is that at the same time the search area will also rotate 45 degrees and it will no longer be possible to search for it with a single query.
Is it possible to index intervals with more than one dimension ? Of course. A 2-dimensional rectangle turns into a 4-dimensional point. The main thing is not to forget which of the coordinates that we put.
Is it possible to mix intervals with noninterval values ? Yes, because the search algorithm for Z-curve does not know the semantics of values, it works with faceless numbers. If the search extent is specified in accordance with this semantics and the interpretation of the results goes with its consideration, no problems arise.
Numerical experiment
Let's try to test the performance of the Z-curve in conditions close to the “macaroni monster”. The data model is:
- 8-dimensional index, the performance and performance of which we have already tested
- as usual, 100 million points
- objects - 3-dimensional parallelepipeds - occupy 6 dimensions
- we will give the remaining 2 dimensions under the time interval
- parallelepipeds of 100 pieces - they form a 10X10 grid on X & Y
- each parallelepiped lives one unit of time
- for each unit of time the parallelepiped grows by 10 units in Z, starting from height 0
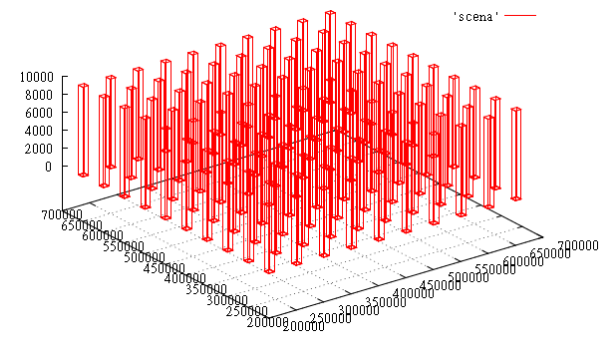
Figure 4 data slice at time T = 1000
On this test we will check the indexation of extended objects, as it affects the search performance.
Create an 8-dimensional table, fill the data and index
create table test_points_8d (p integer[8]); COPY test_points_8d from '/home/.../data.csv'; create index zcurve_test_points_8d on test_points_8d (zcurve_num_from_8coords (p[1], p[2], p[3], p[4], p[5], p[6], p[7], p[8])); Key order: xmax, xmin, ymax, ymin, zmax, zmin, tmax, tmin
data file (data.csv):
{210000,200000,210000,200000,0,0,0,0} {210000,200000,210000,200000,10,0,1,1} {210000,200000,210000,200000,20,0,2,2} {210000,200000,210000,200000,30,0,3,3} {210000,200000,210000,200000,40,0,4,4} {210000,200000,210000,200000,50,0,5,5} {210000,200000,210000,200000,60,0,6,6} {210000,200000,210000,200000,70,0,7,7} {210000,200000,210000,200000,80,0,8,8} {210000,200000,210000,200000,90,0,9,9} ... Test request [200 000 ... 300 000; 200,000 ... 300,000; 100 ... 1000; 10 ... 11]:
select c, t_row from (select c, (select p from test_points_8d t where c = t.ctid) t_row from zcurve_8d_lookup_tidonly('zcurve_test_points_8d', 200000,0,200000,0,100,0,10,0, 1000000,300000,1000000,300000,1000000,1000,1000000,11 ) as c) x; Answer:
c | t_row -------------+------------------------------------------- (0,11) | {210000,200000,210000,200000,100,0,10,10} (0,12) | {210000,200000,210000,200000,110,0,11,11} (103092,87) | {260000,250000,210000,200000,100,0,10,10} (103092,88) | {260000,250000,210000,200000,110,0,11,11} (10309,38) | {210000,200000,260000,250000,100,0,10,10} (10309,39) | {210000,200000,260000,250000,110,0,11,11} (113402,17) | {260000,250000,260000,250000,100,0,10,10} (113402,18) | {260000,250000,260000,250000,110,0,11,11} (206185,66) | {310000,300000,210000,200000,100,0,10,10} (206185,67) | {310000,300000,210000,200000,110,0,11,11} (216494,93) | {310000,300000,260000,250000,100,0,10,10} (216494,94) | {310000,300000,260000,250000,110,0,11,11} (20618,65) | {210000,200000,310000,300000,100,0,10,10} (20618,66) | {210000,200000,310000,300000,110,0,11,11} (123711,44) | {260000,250000,310000,300000,100,0,10,10} (123711,45) | {260000,250000,310000,300000,110,0,11,11} (226804,23) | {310000,300000,310000,300000,100,0,10,10} (226804,24) | {310000,300000,310000,300000,110,0,11,11} (18 rows) Why such a data model is good, you can easily evaluate the correctness of the result.
On a freshly raised server, the same query via EXPLAIN (ANALYZE, BUFFERS)
shows: that 501 pages have been read.
Ok, let's move the index. And what if you look at the same query on the index with the order of the key - xmin, ymin, zmin, xmax, ymax, zmax, tmin, tmax. The launch shows 531 readings. Too much.
Well, let's eliminate the geometric imbalance, let the columns now grow not by 10, but by 1 unit per tact. Request (key: xmax, xmin, ymax, ymin, zmax, zmin, tmax, tmin)
EXPLAIN (ANALYZE,BUFFERS) select c, t_row from (select c, (select p from test_points_8d t where c = t.ctid) t_row from zcurve_8d_lookup_tidonly('zcurve_test_points_8d', 200000,0,200000,0,0,0,10,0, 1000000,300000,1000000,300000,1000000,1000,1000000,11) as c) x; says 156 pages have been read!
Now for some statistics, let's look at the average number of cache reads / hits for different types of keys in a series of 10,000 random queries.
size 100 000100 000100 00010
When key order is
(xmin, 1,000,000-xmax, ymin, 1,000,000-ymax, zmin, 1,000,000-zmax, tmin, 1,000,000-tmax)
The average number of reads is 21.8217, and cache hits are 2437.51.
The average number of objects in the issue - 17.81
When the key order is (xmax, xmin, ymax, ymin, zmax, zmin, tmax, tmin)
The average number of readings is 14.2434, and cache hits are 1057.19.
The average number of objects in the issue - 17.81
When the key order is (xmin, xmax, ymin, ymax, zmin, zmax, tmin, tmax)
The average number of reads is 14.0774, cache hit is 1053.22.
The average number of objects in the issue - 17.81
As you can see, the page cache works very effectively in this case. This number of readings is already acceptable.
And finally, let's see with our eyes, just out of curiosity, how the Z-curve algorithm copes with 8-dimensional space.
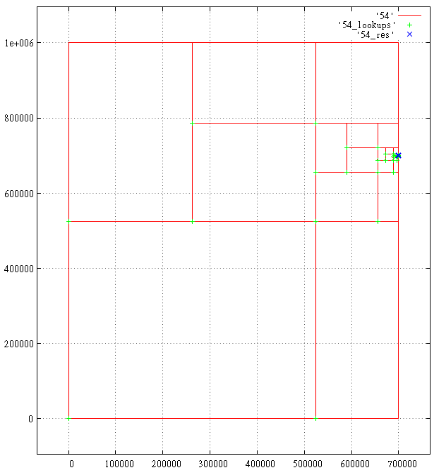
Below are the projections of parsing the query in the extent -
[200,000 ... 300,000; 200,000 ... 300,000; 0 ... 700 001; 700,000 ... 700,001].
A total of 18 results, 1687 subqueries. The generated subqueries are shown, the green crosses are readings in the B-tree, the blue crosses are the results found.
Under each cross can hide several marks. Nearly located marks merge, for example, time 700 000 and 700 001.

Figure 5 X-axis

6 Y-axis
7 Z-axis

Fig.8 Time
Source: https://habr.com/ru/post/339060/
All Articles