PostgreSQL load testing using JMeter, Yandex.Tank and Overload
Few words to start
So, this manual is suitable for those who are looking for a universal toolkit for testing a large pool of systems and solving most of the problems of load testing. The article is designed for beginners in this business, so I will try to maximize the detail and simplify the process. Let's briefly discuss each of the elements in our bundle and proceed to their initial installation and configuration:
- Apache JMeter is a load testing tool that can test for JDBC connections, FTP, LDAP, SOAP, JMS, POP3, IMAP, HTTP and TCP out of the box and many more protocols and solutions using various plugins.
- Yandex.Tank is a cloud-based tool for load testing, it uses various load generators, including JMeter.
- Yandex.OverLoad is a service for convenient monitoring and analysis of servers under load.
Installation and Setup
The key to success for the correct installation of JMeter is the correct installation of java. At this stage, it should be said that all manipulations will continue to occur under Linux. The official website has good manuals with all the nuances:
- Installing 32-bit Java.
- Install the 64-bit version of Java.
With Java sorted out for a control check, make java -version in the console, the answer should be something like this:

Now go to Apache JMeter. You can install any version of JMeter, but if you encounter problems like “Error in NonGUIDriver”, then most likely you need a fresh version of the tank, or you can easily switch to exactly working 2.13. Let's return to the installation - it is similar for all versions:
Download the client :
wget https://archive.apache.org/dist/jmeter/binaries/apache-jmeter-2.13.tgzUnpack:
')
tar -zxvf apache-jmeter-2.13.tgzJMeter is installed and will already work. For the initial setup, it will be enough to make only one change. Go along the apache-jmeter-2.13 / bin path and open the jmeter file with no extension for editing:
cd apache-jmeter-2.13/bin nano jmeterWe find the string, as in the screenshot below. We set heap size values in accordance with the characteristics of the server used. The first HEAP Xms value is the amount of RAM allocated to the process when it starts, and the second Xmx is the maximum amount of RAM that will be available to the process.

If the server is without a GUI and access to it is remote, as in most cases, it is better to install JMeter locally for debugging and writing scripts. Ideally, the versions should be the same, but in most cases JMeter understands the scripts of neighboring or lower versions. Of course, on the local machine, Java should also be JMeter itself.
Moving on to installing and configuring Yandex.Tank, the following actions should be sufficient for this:
sudo apt-get install python-pip build-essential python-dev libffi-dev gfortran libssl-devsudo -H pip install --upgrade pipsudo -H pip install --upgrade setuptoolssudo -H pip install https://api.github.com/repos/yandex/yandex-tank/tarball/masterThen you should tell our gun where to shoot and what. To do this, create a working directory on the machine with the tank with the configuration file load.ini
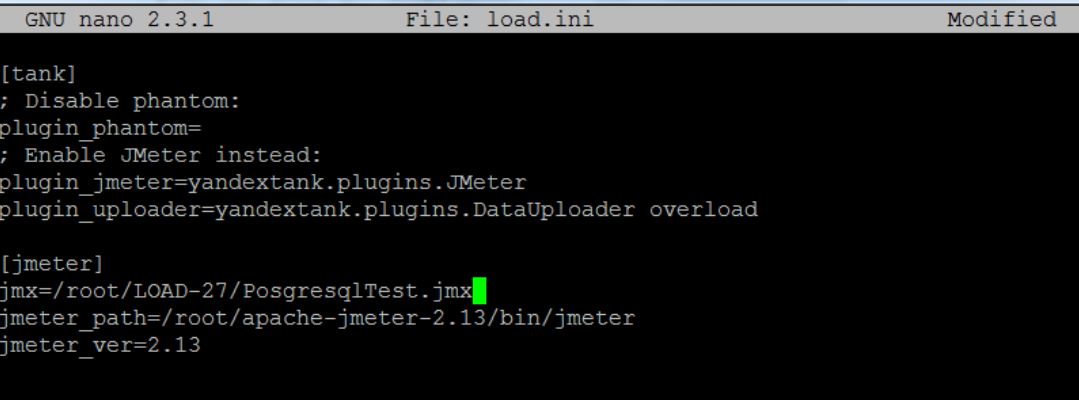
mkdir test cd test nano load.iniThe contents of the configuration file is a guide to the actions of the tank, it is necessary to reflect all the key points of the test. Here is an example load.ini for a test using JMeter:

I think everything is clear in the [tank] block, if questions arise there is a description of each field and block from the tank crews themselves. The most interesting in the [jmeter] block.
The jmx parameter contains the path directly to the script, jmeter_path is the path to the JMeter executive file, and in order for the tank not to make unnecessary movements, you must specify the JMeter version in the jmeter_ver parameter.
Script development
It's time to write the first test. To do this, open the JMeter client - most Windows systems require running as administrator. How to start learning JMeter, and at the same time to understand its GUI is well written in this article . We have the same example with the database, which is slightly different from the usual http requests. The first difference is that PostgreSQL is not supported in JMeter out of the box, so you need to download the driver of the correct version. After that, you need to attach the downloaded .jar to the / lib directory in the folder with JMeter. The same .jar needs to be put in a similar way by car with a tank. With the driver figured out go to the script.
The first thing you need to do is configure the connection to the database, for this, right-click on Test Plan -> Add -> Config Element -> JDBC Connection Configuration. The test tree will be replenished with a configuration element, as in the screenshot:

Turning to it, we will see a lot of the required fields. Here you need to pay attention first to the upper part:
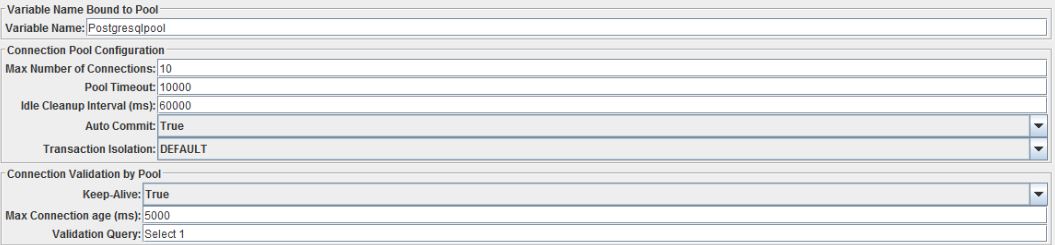
Here it is important to fill in the Variable Name field. This name will be used in the JDBC Request (Sampler) to access the session pool. You should also pay attention to Max Number Of Connections, this parameter limits the number of simultaneous connections to the database. The rest in this block can be left as it is, if there are no special requirements for timeouts and the life cycle of the connection.

Go to the block in the screenshot above, then we will be required to enter data to connect to the database. The template is as follows:
- Database URL: jdbc: postgresql: // IPAddress: PortNo / DatabaseName? AutoReconnect = true;
- JDBC Driver class: org.postgresql.Driver;
- Username: username of database;
- Password: password of database.
We proceed to further filling the dough tree. Again, click Test Plan -> Add -> Threads (Users) -> Thread Group.

Before us is the shooting control panel, it is here that we enter how many users - Number of Threads, how long will be reached - Ramp-Up Period and with what intensity each new user will repeat the actions together with the previous one. If we need to send requests endlessly, we tick the “forever” box opposite the Loop Count. For the first test, you can set the value in a couple of users, with a small number of repetitions. Now we go directly to the queries in the database.
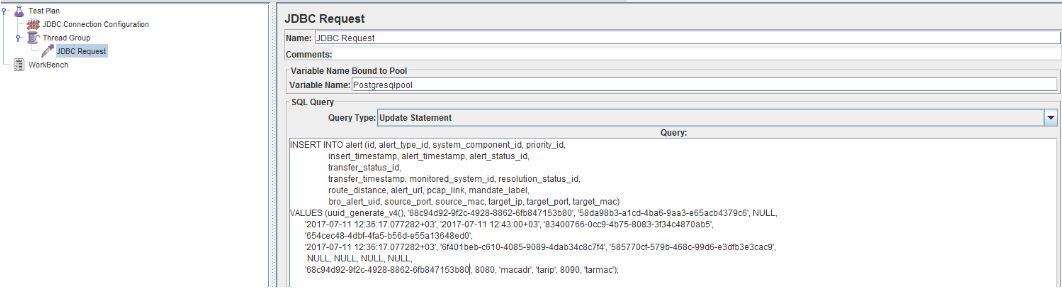
To add a JDBC request sampler to the test, right-click on the Thread Group we need -> Add -> Sampler -> JDBC Request. We are initially interested in the Variable Name field, it must match the same parameter from the JBDC Connection Configuration. After that, we look at the drop-down list of the Query Type, depending on your query there should be an appropriate value, for example, for a SELECT query in the database, select Select Statement, and for INSERT, COPY and UPDATE - Update Statement, as in our example. In the conclusion of working with this sampler, we need to specify the request body, which must correspond to a valid SQL query.
In general, the script is ready, but we need to debug it, it is done this way:
- After the JDBC Request, add the Debug Sampler to the desired Thread Group. It will display the answer received after the query to the database. It is added similarly to the previous elements of the Thread Group -> Add -> Sampler -> Debug Sampler;
- in order to see the results of the work of one or another sampler, at the end of the test plan we need to monitor the results - it is added like this: Test Plan -> Add -> Listener -> View Results Tree. When you run the script, there will be a specification for all completed requests.
The time has come for a test run from JMeter itself - just click on it.  and click on View Results Tree. After working out the script, I got the following results:

Script debugging
We see that the first one worked successfully and we look at the Response message field, it says that the field must be unique. So go to the parameterization. There are many ways to do this, the most unique of which is parameterization using BeanShell PreProcessor. To do this, we need to insert the above-mentioned preprocessor - Thread Group -> Add -> Pre Processors -> BeanShell PreProcessor before our JDBC Request. You can read about preprocessors here or on the JMeter website . BeanShell PreProcessor is not recommended for use under heavy loads, as a stable and fast option, use JSR223 PreProcessor + Groovy.

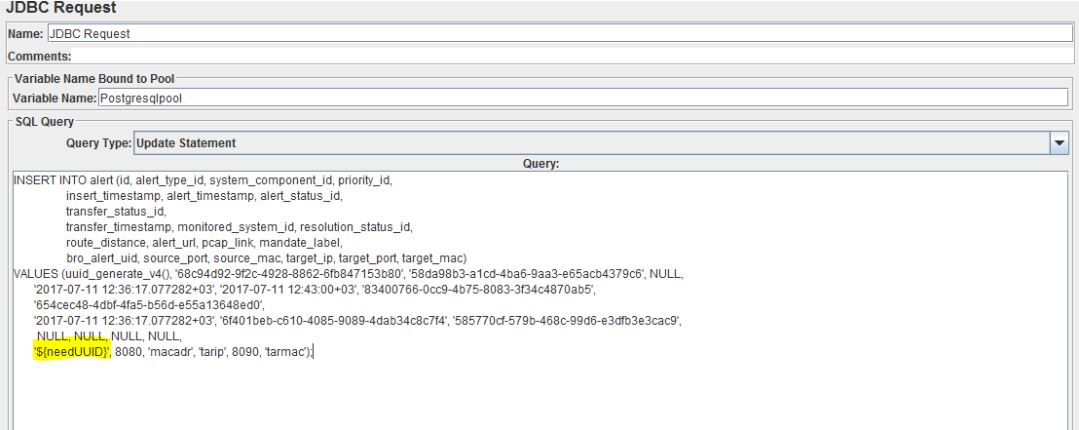
There are no frills - we write to java, import the required class, declare a variable, assign a random variable of the required format to it. To put the resulting variable into a JMeter variable, use vars.put (). Now we go to our JDBC Request and add instead of the value in a unique field a variable in the format of $ {needUUID}, the example in the screenshot below:
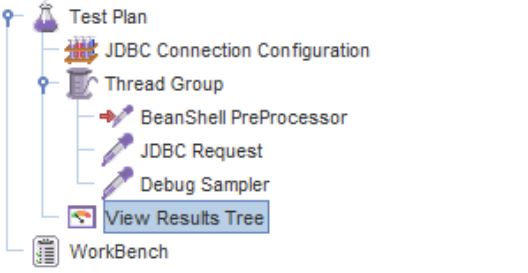
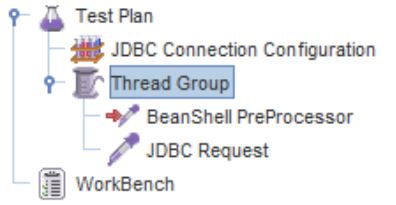
The final structure of our test plan is as follows:
Make another launch from JMeter, immediately look at the View Results Tree, select Debug Sampler and get up on the Response Data tab:
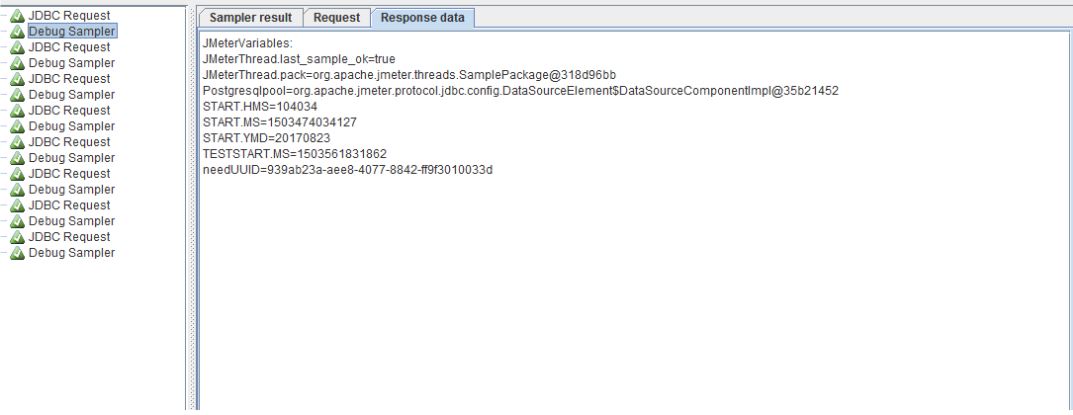
Here we can make sure that our variable was successfully generated and it is different for all requests. When the test is debugged and ready to run, we need to remove debugging elements from it, namely Debug Sampler and View Results Tree. This is done by simply pressing the right button on the element and selecting the Remove item. Just in case, I attach the kind of test after this:
Now we save the test and transfer it to the car with the tank. We enter it into the “jmx” parameter in the load.ini file and save it. Absolute addressing is used. It looks like this:
The time has come for the first launch to understand that everything works at this stage. Before this, we need to check the addition of rows to the database. To do this, you can use the pgAdmin tool or just go to the server with the database and count the rows before and after the script has been worked out. The connection to the database is performed by a similar command:
psql -h IpAddress -d dbName -U UserNameThe count itself is doing this:
select count(*) from alert;We return to the car with the tank, go to the directory where load.ini is located and enter the command to start the tank:
yandex-tankA few seconds after the launch, a window will appear with the current test parameters. Consider that during short tests the tank may not be able to obtain data on the current parameters.

Monitoring
After checking the test execution and testing, we will proceed to setting up the monitoring. The benefit of setting up monitoring with Overload means minimal effort is required. The following actions are enough:
- registration for Overload ;
- we get a token by clicking on the profile icon in Overload and choosing “my api token”;
- create token.txt in the same folder as load.ini on a car with a tank;
- we bring the received token in token.txt and we save;
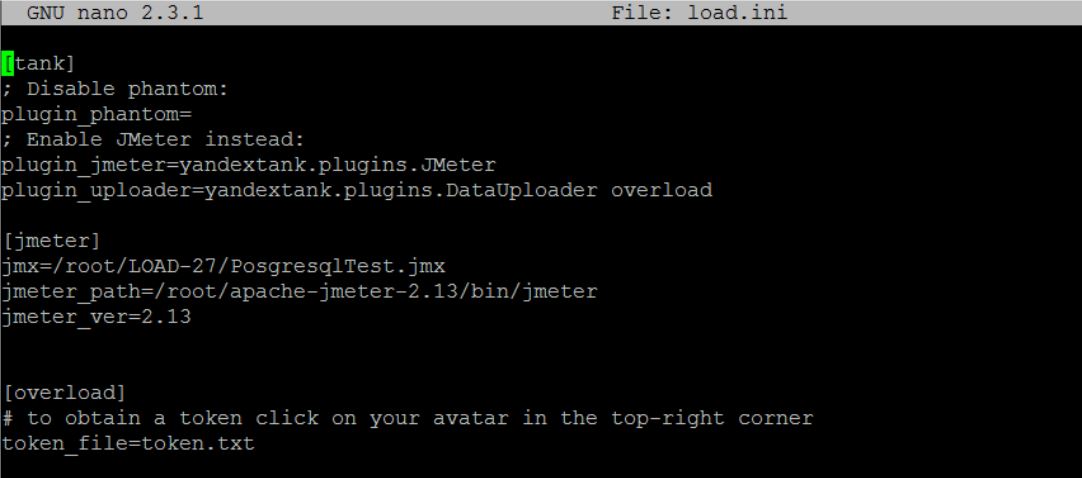
- add block [overload] in load.ini - description from tankers;
We get something like the following load.ini:
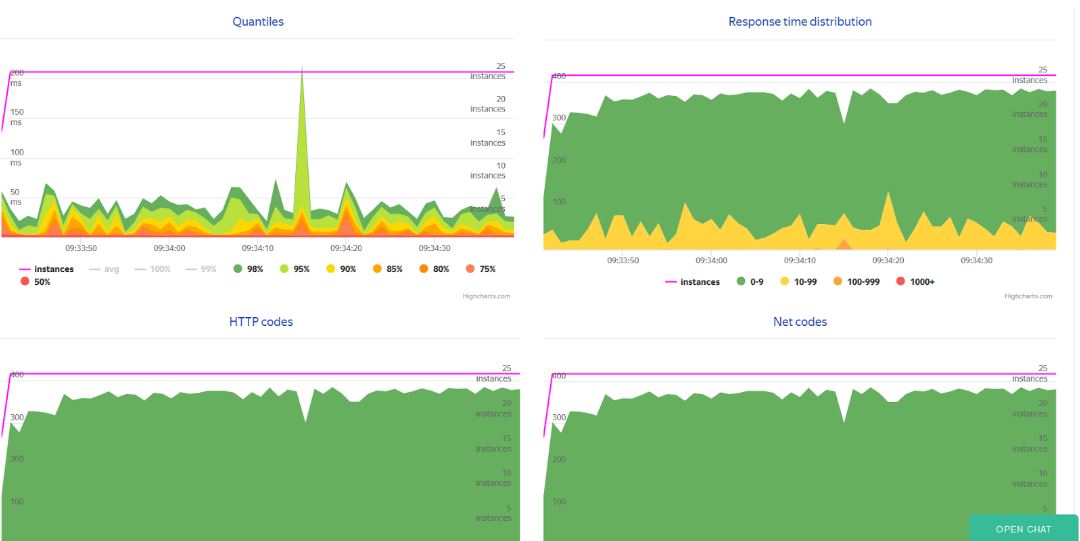
Now, after starting the test, we have the Overload profile showing the current test and all those that passed with numerous useful graphs:
C Overload finished, now a few words about other metrics and their monitoring. There are many guides for setting up monitoring directly to the database, so I will not describe this process in detail. I advise you to use telegraf to remove server metrics and influxdb for the database. The output of all metrics can be organized in Grafana. For this you can use the installation process in this guide .
Finally, it would be good to say that recently, starting from version 3.2, JMeter has a built-in influence on the basis of the influx for monitoring, but there, unlike Overload, you will have to configure everything yourself.
That's all. All good shooting!
Source: https://habr.com/ru/post/339014/
All Articles