Performance: what's in my name? - Alexey Shipilev about optimization in large projects
Performance optimization has long haunted developers, seeming as a kind of “golden key” to interesting solutions and a good track record. A big tour of the key milestones of optimizing large projects - from general principles to traps and contradictions - at the last JPoint 2017 was held by Alexey Shipilyov, a performance expert.
Under the cut - decoding his report.
And here you can find the presentation itself: jpoint-April2017-perf-keynote.pdf
')
About speaker
Alexey Shipilev - has been in the Java performance issue for more than 10 years. Now he works at Red Hat, where he develops OpenJDK and is engaged in its performance. Develops and maintains several subprojects in OpenJDK, including JMH, JOL, and JCStress. Prior to Red Hat, he worked on Apache Harmony at Intel, and then moved to Sun Microsystems, which was absorbed by Oracle. He actively participates in expert groups and communities working on issues of productivity and multithreading.
I work for Red Hat. Earlier, when I was working at Oracle, we inserted Safe Harbor slides that said that everything that we will tell you might not be true, so you need to think with your head. If you are trying to incorporate any solutions into your products, it would be nice to hire professionals who will tell you what’s true and what’s not.
Suppose you are developing a product. What is a successful product for you? We are all commercial programmers. We can fool ourselves that we are paid a salary for what we code. But in fact, we are paid a salary in order to sell either services that serve the products, or products entirely.

But what are the purely development criteria for the success of a product (without taking into account the business goal)?
Therefore, I am surprised when I read posts on Java performance on Habré and see similar comments there:

Experts say: “Well, what about Java performance? It works fine. We are satisfied, everything is fine. " But commentators come and answer: “It’s very significant that none of the four experts rated Java as fast. Rather, as sufficient and satisfying. "
You speak as if it is bad. If from a business point of view, technology meets business criteria, then thank God! I have no idealistic idea that everything should be licked, smooth, perfect. It does not happen - usually products contain errors.
People have long learned some double thinking about the correctness of programs. (asks to the audience) Who can honestly say that there are bugs in his programs? (in the hall a lot of hands) The vast majority. But they still believe that their programs are more or less correct. The concept of a correct program has symmetry with the concept of a fast program.

"Correct program" is a program in which no user errors are visible. That is, there are errors there, but they do not force the user to abandon the purchase of a product. There is a symmetrical situation with the “quick program” - it’s not that there are no performance problems, these problems just don’t beat the user every time he tries to do something.
"We invested in success criteria." The success criteria are both functional and performance: it’s good if the program is responsible for 100 milliseconds. Answer? Great, we go on.
"The number of bugs in the correct program is usually known." This is just one of the indicative metrics of the maturity of the project, since zero bugs in the program means that no one really cares about registering them in the bug tracker (because you don’t have users, ha ha!). Performance problems have the same story. Performance problems are known, and then we say that this is a “fast” program. (makes air quotes)

Both in the correct program and in the fast program, the ways to bypass these performance and functional bugs are known. You have a FAQ that says, “If you do this, it will be painful; so don't do that . ”
Practically all projects where I participated in performance work are undergoing some standard phases of development. I once formulated that these phases look like this:
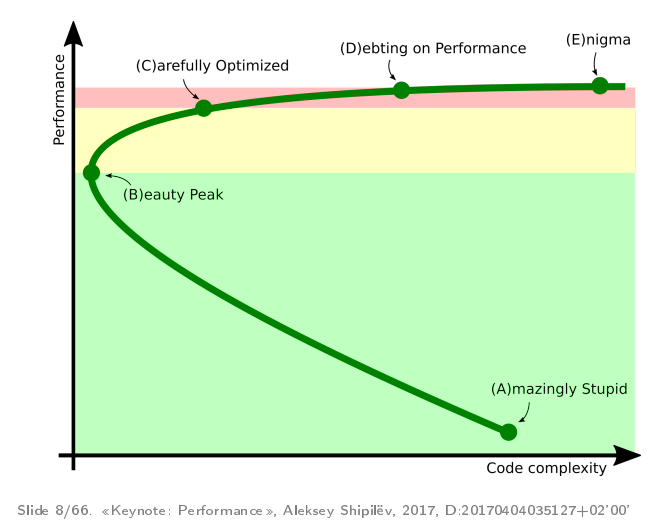
This is a parametric graph: time flows here from point “A” to point “B”, “C”, “D”, “E”. On the y-axis we have performance, on the x-axis is some abstract complexity of the code.
Usually, it all starts with people cycling a prototype that works slowly but slowly. It is rather complicated because we just bike or not so that it does not fall apart under its own weight.
After the optimization begins - little by little the rewriting of different parts begins. Being in this green zone, developers usually take profilers and rewrite pieces of code that are obviously badly written. This at the same time reduces the complexity of the code (because you cut out bad pieces) and improves performance.
At point “B”, the project reaches a certain subjective peak of “beauty”, when we have a kind of performance and a good one, and the product is not bad.
Further, if developers want more performance, they go into the yellow zone when they take a more accurate profiler, write good workloads and carefully tighten the nuts. In this process, they do things there that they would not do if it were not for productivity.
If you want even further, then the project comes to a certain red zone, when developers begin to make their product go wild in order to get the last percentages of performance. What to do in this zone is not very clear. There is a recipe, at least for this conference - go to JPoint / JokerConf / JBreak and try product developers, how to write code that repeats the curvature of the lower layers. Because, as a rule, in the red zone there are things that repeat the problems that arise in the lower layers.
The rest of the report tells in detail about what usually happens in these zones.
The motivational card of the green zone is a fight against burrs in the code by brute force:

Brute force means that you do not need precise tools - just take and do. There are some mental traps in the green zone.
My favorite is: “Profile normally or not”:

I constantly hear: "Listen to the reports of Shipilev, he will tell you that you need to profile normally or not at all." I never said that. When you are in the green zone, the accuracy of diagnosis affects very little. And, generally speaking, you need profiling in order to understand which part of the “microservice monolith” that you managed to write, you need to rewrite first of all.
If you look at the blogs of various cool performance dudes, for example, Brendan Gregg, it will show such scary diagrams, saying that you can look back and forth with such tools:
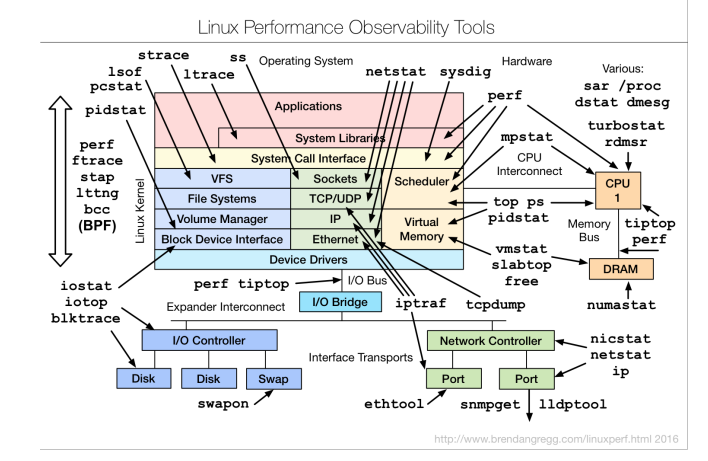
Many people say when they look at these diagrams: “Performance is very difficult, and we will not do it.” Although in fact the idea of Brendan is not about that. It is that there are fairly simple ways to quickly assess what is happening in the application. When we have at least a macrocellular understanding, we are much better.
Therefore, diagnostics in the green zone is based on a very simple idea: we should not be afraid to look at our application. Even a large-cell understanding of what resources we lack in our stack already gives us some idea of what to pay attention to and what is not. Even if you do some full-system profiling, it will already be approximately clear where your bottleneck is.

Our goal in the green zone is to understand approximately where we spend time.

Even a naive profiler, which you can collect from sticks and acorns, will give you enough information to perform conscious actions in the green zone.
If you have a production, on which evil admins do not allow to install a profiler, you can simply take ssh through josh and make “while true; do jstack; sleep 1; done. " Collect a thousand of these jstack, aggregate them. This will be a “knee-length” profiler, which will already give you enough understanding that your product is bad.
Even if you place your hands on stopwatch in the product and estimate that in this part of the product you spend 80% of the time, and in this part - 20%, it will be better than just reading the tea leaves about what will happen if we in a class accidentally written by Vasya in 2005 will fix something.
The next mental trap associated with profiling says that you need to measure performance either normally or not at all.

I constantly hear about it. But in the green zone of improvement "plus or minus kilometer" you can usually see with your eyes. Usually it is said in the context of “you have a bad benchmark, it doesn’t show anything, because it is written poorly, but you need to measure performance correctly,” and at the same time you have a rake there, which can be seen on almost any workload.
The moral is very simple: in the green zone, even trivial stress tests will show you major flaws.

I’ve seen cases when people spend weeks trying to write load tests on JMeter, instead of putting a public link on some Twitter and get a bunch of people coming to beta testing and crashing your application (and you’ll only have to sit with the profiler and watch where it fell). Even the usual Apache Bench shows big flaws quite well.
The sooner you are in the development of this performance data on major flaws, the sooner you can fix them. This will all the more help you plan work on performance.
I once took JDK 9 Early Access and thought: I should try to build my projects with him, suddenly something has changed!

I'm building, and my compilation time is growing from 2 minutes to 8. Suddenly. Do I need in such a situation to write some neat benchmark for this, to prove that this is really a regression?
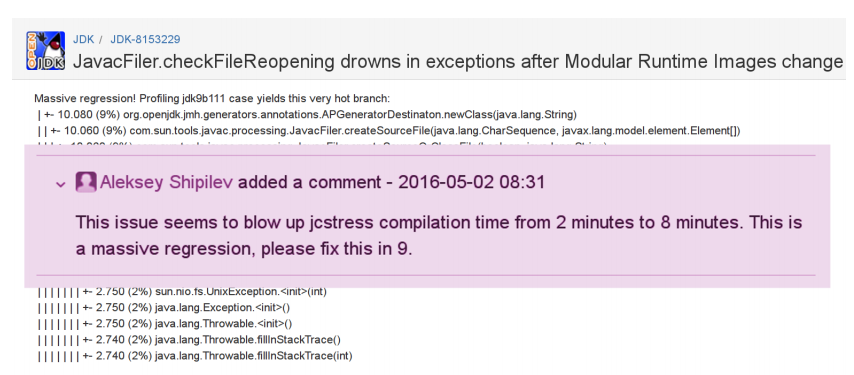
Of course not. I have a specific bug in the build, it is reproducible. In the profiler you can find that there is a call stack that leads to a known location in javac. In this javac you find the source code, and a quadratic loop is found there.
Do I need to prove that this is a problem when you have: a) a workload that is bad; b) when you have a profile that shows there, and c) theoretical reflections that a quadratic cycle is bad? No, that's enough.
Another mental trap: "Premature optimization is the root of all evil."

The whip, of course, is still alive and well. But I do not know how much he hiccups every time someone remembers this phrase, because it is usually remembered incorrectly. Knut said that premature optimization is the root of all evil in 99.7% of cases, because people do not understand where they need to be optimized. When you're in the green zone, you don't care. You still rewrite your beautiful code. You need profiling in order to determine what to rewrite first.
What are the visits there?
As a rule, the performance improvement there is mainly from rewriting the “bad” code to “good”. But “bad” and “good” are to some extent subjective tastes. Ask several programmers: one will say that it is necessary like this, so beautifully; and the other will say: “What have you written here!”. All this, of course, can be a taste, but it can also be suffered by techniques, including those suffered by you or Joshua Bloch, who wrote the book “Effective Java”.
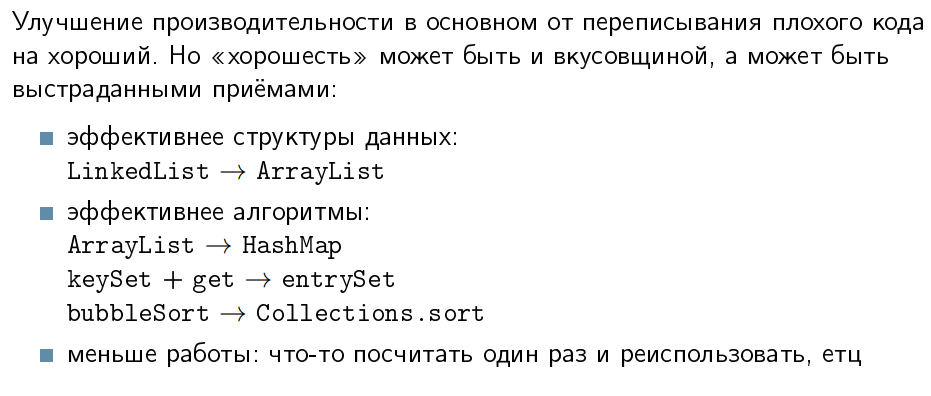
For example, effective data structures. I know projects in which the global s / LinkedList / ArrayList / g has improved performance without hesitation. There are cases where LinkedList is faster, but these cases are very special, and they are usually visible to the naked eye.
You may suddenly find that you have a linear search on an ArrayList in a place where you can use a HashMap. Or you have an iteration over a pair of keySet and get, which can be changed to an entrySet, or bicycled your bubbleSort and suddenly it turned out that collections of a million items were coming there, and you spend a lot of time there, and so on.

Profiling is a necessary part of daily development.
According to my observations, 95% of performance problems are solved at the very first profiling visits. Regardless of the complexity of the project, no matter how experienced people develop it, when you show people the first profiling of their project, they have a gamut of emotions, in particular, "what kind of idiots are we." Because more than 90% of these problems are trivially solvable and, in theory, should have been caught before the commit.
If you are a technical leader, architect, technical director, or you hold some other technical leadership position and want productivity, then please make sure that the project has clear instructions on how to launch the profilers. If you have a one-liner, or one-directory, or you have a web application that has an APM, then very well! A developer should always have a way to do it quickly.
In my experience, if you take a developer by the hand, no matter how “senior” he is, sit with them and once your product is reprofiled, this will surely stop his fear of performance work. Many people have such a block in their heads that performance is difficult, that there are all sorts of interrelations between components and so on. And they do not profile at all, because it is difficult - it means, for now it is not necessary. But when once you sit down and do it with them, this block is removed from them, they begin to profile on their own. And those 90% of the errors that they can resolve before someone comes to them, will show the profile and shame them, they will fix it in advance.
And “take the developer by the hand” - this does not mean that you drive them to the conference, put them in the hall for 1000 people, the speaker comes out and starts to carry something intelligently in the profiler. It does not work. It works differently: you sit down with a specific developer on your project and do it for a couple.
The yellow zone is a code complication in exchange for performance when you do things that you would not do if you did not want more performance.

Mental traps are there too.
The first mental trap: "Now we take a profiler, see what is where, and how we will begin to optimize."

It turns out that in the yellow zone the price of an error has increased: now you get performance, and you lose something in return - support, developers' sleep, and so on. Therefore, you need to make the right changes that require advanced diagnostics, and profiling is only one part of the diagnosis. There is also benchmarking and stuff.
Usually, when people get into the yellow zone and start thinking about what to optimize, they open the profiler and see it:
And what are we going to optimize here? Rewrite to java.nio or say that the hottest method is java.lang.Object.wait, which means you need to overclock it. Or there Unsafe.park, it means that you need to overclock it ... or SocketInputStream.socketRead0, or socketAccept - it means that you need to urgently rewrite everything on Netty, because the network is visible. True, all this garbage from JMX, but we will learn about it later, after 3 months of development. Or there Object.hashCode - let's say that bad HotSpot did not optimize it, and “you promised us that everything would be quick and good, and our product is not to blame”.
The modus operandi in the yellow zone is simple: when optimizing, you will now have to explain why you are doing it. Maybe for yourself, and maybe for your project manager.
It is desirable to have on hand:
When people assign tasks to assess performance, the inexperienced start to freak out terribly, because it is very difficult for people to put non-linear dependencies in their heads. One of these non-linear dependencies is the Amdal law, and it is usually arrived at as follows.
Suppose we have an application. It has two independent parts: A and B. And we, for example, know that part A takes 70% of the time and accelerates 2 times, and part B takes 30% of the time and accelerates 6 times. You can overclock only one of them - there is only enough resources for this. Which of these systems will we overclock? If we even reduce them graphically, we see:

Part A works at 70% of the total time. It is better to optimize part A, despite the fact that we only overclock it by 2 times. The impact on overall performance is greater.
And if I were a freelance programmer, I would probably have overclocked Part B 6 times. In my weekly report, this figure will look much better: “Vasya dispersed twice, and I dispersed six times, so I need to increase my salary three times.”
Amdal's law is derived as follows:
If we have speedup S, then by definition it is total time A plus B divided by new time. Part B there remains the same, so there is “plus B”, and part A has decreased by S A times. If we introduce two notation: Part A and Part B , which show the relative time of parts A and B in this appendix, we come to the following expression:
This ratio has funny properties. For example, if you go to infinity, then S is the limit:

This is not an obvious thing, you need to feel it several times on your own skin in order to understand. You will be shown through such graphics:
... and say: if you have an application in which 80% is occupied by the part that accelerates, then overclock it at least until you get stuck, but speedup is more than 5 times, you will not get.
This means that if a database vendor comes to you and says: we know that the database occupies 50% in your workload. We guarantee you, if you change your current solution to ours, without changing a single line of code, your performance will grow 10 times. What do you have to tell him? (from the audience) Bull shit!
We go further: there is a generalization of the law of Amdal. If we slightly reverse these terms and introduce two new notation: p is speedup A, this is how much we dispersed a specific part of A, and alpha is how much everything else is, then this law can be written in this form:
The thing is that these terms have some physical meaning. The first member is usually called concurrency . If we ignore the second term so far - the contention - expression will mean: how many times we accelerated part A, we got a common speedup at the same amount. Contention describes the performance impact of everything else that provides this very asymptote in Amdal’s law. By the way, if the graphs of this function are drawn, you get the same curves as in the Amdal law:

However, as a rule, in most applications, the Amdala law in this form does not apply. A more complex law applies when another term is added there, called coherence , which describes the interaction between components.
It turns out that if alpha and beta are non-negative, then you do not have saturation asymptotes. You have some kind of peak efficiency, and after that, performance starts to fall. Many people who are engaged in performance, on their own skin felt this law, until it was formulated as the Universal Scalability Law (USL):
The concepts of "universal" and "law" are used here in a natural-scientific sense, that is, it has a theoretical justification, but it is not derived analytically. It is derived as a law that stretches well on empirical data.
Systems with alpha and beta, equal to zero, does not exist, because there are many cases when you add resources to the system or optimize something, and it gets worse. For example, you removed one bottleneck, but rested against another, heavier one.
A mental trap with performance measurement says: “Since everything is complicated there, and we don’t know how everything will affect performance, we just find something and see what benchmarks tell us.”

In fact, performance testing is wildly expensive, and you’ll not test it all. Performance tests from functional tests differ in that functional (for example, unit tests) pass in 100 milliseconds or less, even if they are executed in a pack. With performance tests not everything is so smooth. There, tests pass from a minute and up, can take hours. This means that one change can be tested for hundreds of engine hours. If you make a bunch of commits a day, then you need a very large fleet of equipment in order to ensure at least some way to pass through the test system.
Performance tests require isolation, otherwise they begin to speak every kind of heresy, because they begin to interact with each other.
Performance tests, as a rule, give non-binary metrics. Functional tests usually say "PASS" or "FAIL" - binary metrics, and performance tests say ... "67". Worse: they say not “67”, but “67 plus or minus 5”. This, among other things, means that testing errors are only after parsing the data , when you understand that everything is very beautiful everywhere, and here, in a dark corner, there are data that show that the experiment was fake. This means that all other data also need to be thrown away and again spend hundreds of machine hours on a new cycle.
And the worst thing is that the benchmarks give you data — numbers , but you want results — some knowledge you can get from these numbers. And if data acquisition is well automated, then the part about extracting meaning from this data, as a rule, is poorly automated, since it requires a human understanding of what is there and how it can occur.
Conclusion - in the active project it is almost impossible to test everything. This means that you still need to have in your head some assessments and the ability to figure out where to dig, without chasing away all the benchmarks for every sneeze.
Many people divide benchmarks into two large classes: macrobench marks and microbench marks.

In macrobench marks, as follows from the “macro” prefix, we take our large website, application or library as a whole, write end-to-end tests and see how long it took one virtual user to buy our infinitely valuable products in the online store . Normal test.
Microbench marks are small workloads when we take a small part of our website or library, do a small isolated test and measure a specific part.
The developer’s voices in his head usually whisper to him that the macrobenchmark reflects the real world, and the microbench marks reflect evil.
Look: the real world is big, and the macrobenchmark is big. (conspiratorially) Therefore, the macrobenchmark reflects the real world. Therefore, it seems to some that any macrobenchmark is a good one. Say, launched a macro benchmark - this is the real world.This means that for any cool feature, the macrobenchmark will give a dramatic improvement, because it is also a “real world”. And if the macrobenchmark does not show improvements, then this feature is bad. And that for any cool bug, the macrobenmark will give a steep regression, and if there is no regression, then there is no bug. This is a “real-world”, which means that what happens in the real world should also be in the macro benchmark.
With microbench marks - the opposite situation. Voices in the developer's head suggest that they are evil, so they can be ignored. They tell you that the readings of the microbenchmark are not important, because you can write it in any way, which means that regression or improvement on it means nothing. And when they encounter the real world, the thought comes that the microbenchmarks are written by enemies to defame their product. Because it is easy to write them, you can write whatever you like, which means you can write a microbenchmark, thanks to which we later write in white paper that our product is better, because at such a workload, it works better.
If we discard this marketing bull shit about microbench marks, it turns out that the life cycle of all benchmarks are about the same.

If you have a big benchmark - gigabytes of code, in which dofig libraries, code, etc., it usually begins with the "innocent" stage, when it really tests many parts of your product, walks through many layers, and so on. Suppose they take about the same time there. But then evil developers come and start optimizing.
We started with a macrobenchmark that covers many parts of the application, but at the end of its life cycle, its performance is stuck in one big bottleneck, which is very difficult for us to resolve. And this is practically the case of a micro benchmark, when we have an isolated test that tests one thing. Such a degenerated macrobenchmark also tests only one thing.
But still this has some advantages. Unobvious plus follows from the law of Amdal.

Take an application with two parts - red and green, which is optimized. Even if we optimize the green part to 0, we still get the speedup only twice. But if the red part regresses (if we, say, 2 times regress it), it turns out that Amdal’s law, which has an asymptote, will become a linear relationship.
In other words, if we regressed a small part a thousand times, the total metric will also decrease significantly.
You can show it on the graph as follows:

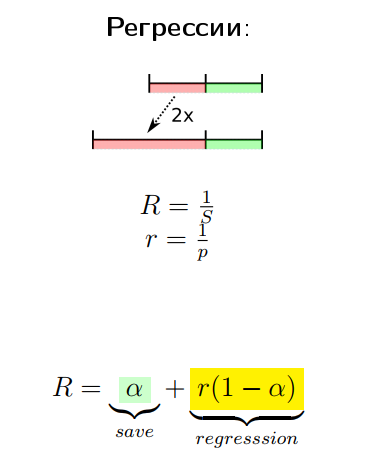
On the abscissa axis we have the speedup of a specific part, and on the ordinate axis the speedup of the product as a whole. In the part where something is improving, we have asymptotes from Amdal’s law, and where everything is getting worse, we have a practically linear relationship.
The problem with testing is also that empirical performance testing is noisy. There are systematic and random errors in the experiments.

Often, the sensitivity of the test may simply not show you an improvement on a particular change. If something has improved 50 times, then the improvement in the overall system will be below the sensitivity threshold of the test, and if it regressed 50 times, it will be much better seen. This is, by the way, the answer to the question of why, when you are engaged in productivity, most of the things that you see in your automatic reports are regression. Because, as a rule, testing is more sensitive to regression, and not to improvement.
According to my observations:
Macrobenchmarks:
Those.Making a performance improvement on macro brands is a heartbreaking story.
Microbench marks:
Therefore, if we, for example, do performance optimization, we always have a body of micro-benchmarks (very sensitive workloads), on which we make changes and squeeze the maximum. Only then we validate that they have not regressed and improved the macrobenchmark.
No matter how you spin, and you have to learn microbenchmark. The most interesting idea is that the “just take some successful framework and rewrite all workloads on it” method does not work, because it is not enough just to write the benchmark code and get the numbers. To understand what is happening, you need to peer into these numbers, maybe build side experiments, correctly conduct them and analyze the data, and then draw conclusions and build a so-called performance model — understand how your application or your stack reacts to changes in code, configuration, and so on. This will give you the opportunity to predict what will happen in the future.
Usually, however, is not the case. Usually, people fall into the next mental trap:

“We tried, and it improved the metrics - it was not 100 operations per second, but 110. Probably because ...” and further the link to some report with JPoint follows. I, he said, was at a conference, and there a smart dude said that I could step on such and such a plunder. As a result, we rewrote the multiplication for non-multiplication, and we had a branch prediction or something in this spirit (here, more importantly, in a scientific manner, to be more accurate).
In fact, it often happens that you are just lucky with the load, with the component, with the phase of the moon. A little luck will be gone, everything will be back to square one. As a rule, in relation to each improvement, you need to look at the following options (if I have an improvement, you need to understand what it refers to):
If we do not classify our changes into these categories, then it may be that we make a bad temporary patch against a bug in the lower layer, that bug will sometime be fixed, and fixes in the regular library will be better than our patch. But we will already pay for the maintenance of the patch, the failed performance in comparison with the competitors that did not twitch, etc.
Another example: what will happen if we know what is special in our application, we will tell the JVM what mode to work in? The joys are very simple there: mechanical sympathy, synergy and all that (we know how to tune the JVM).
In practice, of course, this happens differently. You go to Google and search for: “JVM tuning options”. You fall out this ski:
You put it in your config, it really improves something, and you draw yourself an asterisk “I know how to tying JVM”.
Of course, there are problems. It may be that, in general, this unit has improved your performance, but there are options, which, among other things, regressed. If you understood what you are doing, you could take the whole improvement, not just a part of it.
No matter what we have written where we are, we will take parallelStream (), Eexecutor.submit, new Thread, we will load a bunch of parallel tasks. Normal idea? The joy here is that special changes in the code are usually not necessary if it was originally written with the thought that someday it will be multi-threaded.
But there are the same problems: there is synchronization, and it is unclear how she will shoot on wider wheelbarrows. There are overheads - on small tasks you do not need to parallelize, because you all will eat on dispatching tasks. Or if you have a staging in which you have a lonely Vasya pokes in the mold, and there internal parallelism helps you. Well, for example, there is some kind of request, and you are there inside it submitting to some mega-Hadoop that MapReduce is doing to you in parallel; and it all works faster when everything is parallel. And then you deploy it to production, and suddenly it turns out that you have 10,000 users, i.e. internal parallelism is not needed at all - you have a lot of external parallelism that already exploits all your resources.
Another example.Some people think: "At conferences, they told me that, in general, Integer and generally wrappers over primitives in Java are an expensive thing, so we take and rewrite everything into int arrays and so on."
Of course, “int-ovka is a holiday” in the sense that you take, rewrite and think that you are performing useful actions. The problems, however, are very big: you do not know in advance how much you will eat on conversions to wrappers, how much time you will devour development time (working out all angular cases, round-trip conversion of all collections, writing inserts, deletions, brakes), and you will probably miss the optimization of the JDK itself in the collections and in some Valhalla.
Modus operandi: in the yellow zone, our main task is to maintain a plausible performance model of the project, because it tells us where to change, so that it is good and we do not regret about it later. This is a necessary condition for the development of the project.
According to my observations, more than 50% of potential changes are not done where they are. And they usually miss for a very simple reason: commands are broken down into components, and they can quickly make changes to their component, even if you need to make a bugfix in the component of another command.
As a rule, more than 80% of changes are made in the right place after the study (and 83% of all statistical data are usually correct).
The ability to explore and update your knowledge of the project entirely helps to make the right decisions. If your teams are divided by components, please have people who can look at this project from the outside, who will understand how the components are related to each other and what changes to make. Usually this role is performed by the architect. But architects are usually overwhelmed, so they hire performers who help feed them with data about what is happening in the project. Thus, it is possible to help the architect in his head to update this very performance model.
Motivation in the red zone: when we chose all reasonable ways to improve performance, there were unreasonable ways. Unreasonable ways - this is the exploitation of the curvature of the lower layers, dirty khaki, climbing into the intestine. As a rule, in the absolute majority of projects there is no need to go there.

Competent technical management, sane tehlide, project manager or, in the end, caring mother should tell you: “You don’t have to go there”!
The basic idea in the red zone is simple - we want to improve performance by exploiting the implementation features in the lower layers.

For example:
Usually everything happens in this zone by accident. When all possible options are chosen, they say to themselves: “Well, let's think what to do next.” And it seems to them that if you look at a profile for a long time, then you can see a solution there. They understand that the decision will be difficult, so you need to look for a long time.

In fact, the ability to hack in the red zone grows out of understanding the interaction of moving parts. And here in this place performances appear - these are people who are not particularly engaged in everything else, but they know how to dig in all layers at once. They are a walking encyclopedia, they have in their head a set of hacks that work in such and such conditions. They know the limits of their applicability. The most important thing is that these are people who do not fall into a stupor when they see unfamiliar crap, but begin to study it.
If they see a profile from which nothing is clear, they say: “Well, all right, we will reject this profile, let's do experiments that will be brought to us by some new data”. The systematic inductive way of data collection works here. Studying for them does not mean nafigachit a piece of code, posting it on StackOverflow and asking: “Do we have such a performance problem, what could it be?” And wait until some people come to them, such as John Skit, and will tell how and what to do there. To study means to read documentation, look for references in articles, do experiments, extract knowledge from colleagues, systematize them in some way, and so on. Many people come to the conference for this.
There is one more mental trap: “If you travel a long time to conferences, someday some conference will be told a trick, which in our project will give an improvement five times, and then we will beat off the entire budget spent on tickets.”

In fact, in a particular case, one out of a thousand low-level trick saves. It is easier to find on your own than to wait for the weather by the sea. The funny thing I see in the programmer get-together is that most of the performance discussions are about low-level hacks:
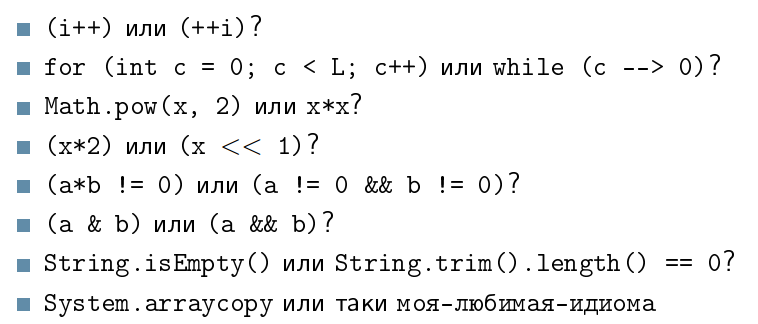
As a rule, all these things happen in conditions when programmers in projects have simple algorithmic transformations that can repeatedly improve performance. But since they were told at conferences that smart HotSpot somehow compiles, so you need to modify your project so that it compiles well with HotSpot, they miss the main thing - that in fact they have changes that they can find for themselves (and make it is fast) and it will improve performance.
If we are in the red zone and find this kind of low-level difference, which in fact in most cases is the difference in the implementation of optimizers (many of the above-mentioned cases actually have to work the same way), we can zakhachit. But hacks should be temporary patches, not the basis of our project.

As a rule, they indicate problems in the layer below, since the layer below should actually provide a more sane performance model in which any option will work better. If you listen to the report, in which you will be told about different low-level game, please do not take it as a guide for immediate action. This report helps you to build a corpus of possible hacks, which, maybe, someday will be needed if strongly pripret.
There is a very simple example that was recently found in JDK 9.
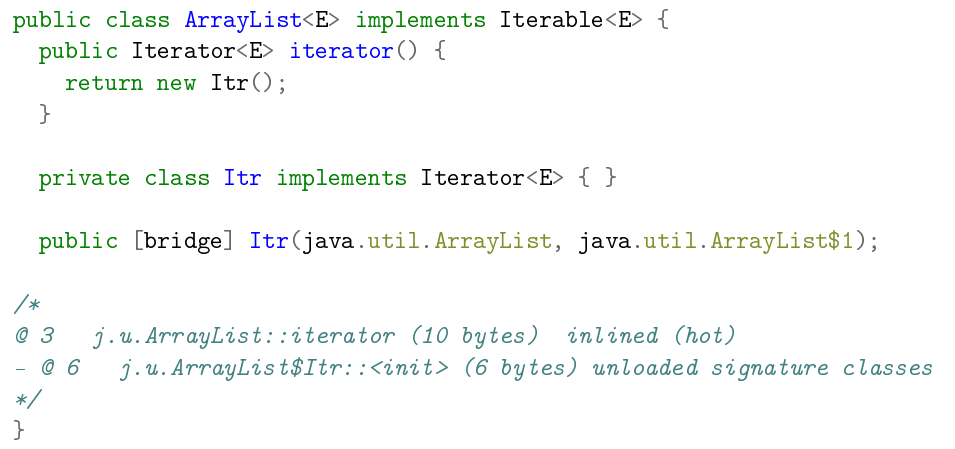
There is an ArrayList type in Java, it has an iterator that is implemented through the inner class Itr. This class Itr, since it is private, has a synthetic so-called bridge method (public), so that the Itr constructor can be called. The problem is that if we call Itr, the Hotspot inliner breaks down because it sees classes that are not yet loaded in the signature of this method.
Where is this error (under-optimization)? Is this a bug in the ArrayList code? Probably not. Is this a javac error? Yes, rather. Is this under-optimization in the hotspot code? Yes, rather. But it's easier to zachachit it directly in ArrayList, until compilers come to their senses and do not understand how to fix this in the compiler.
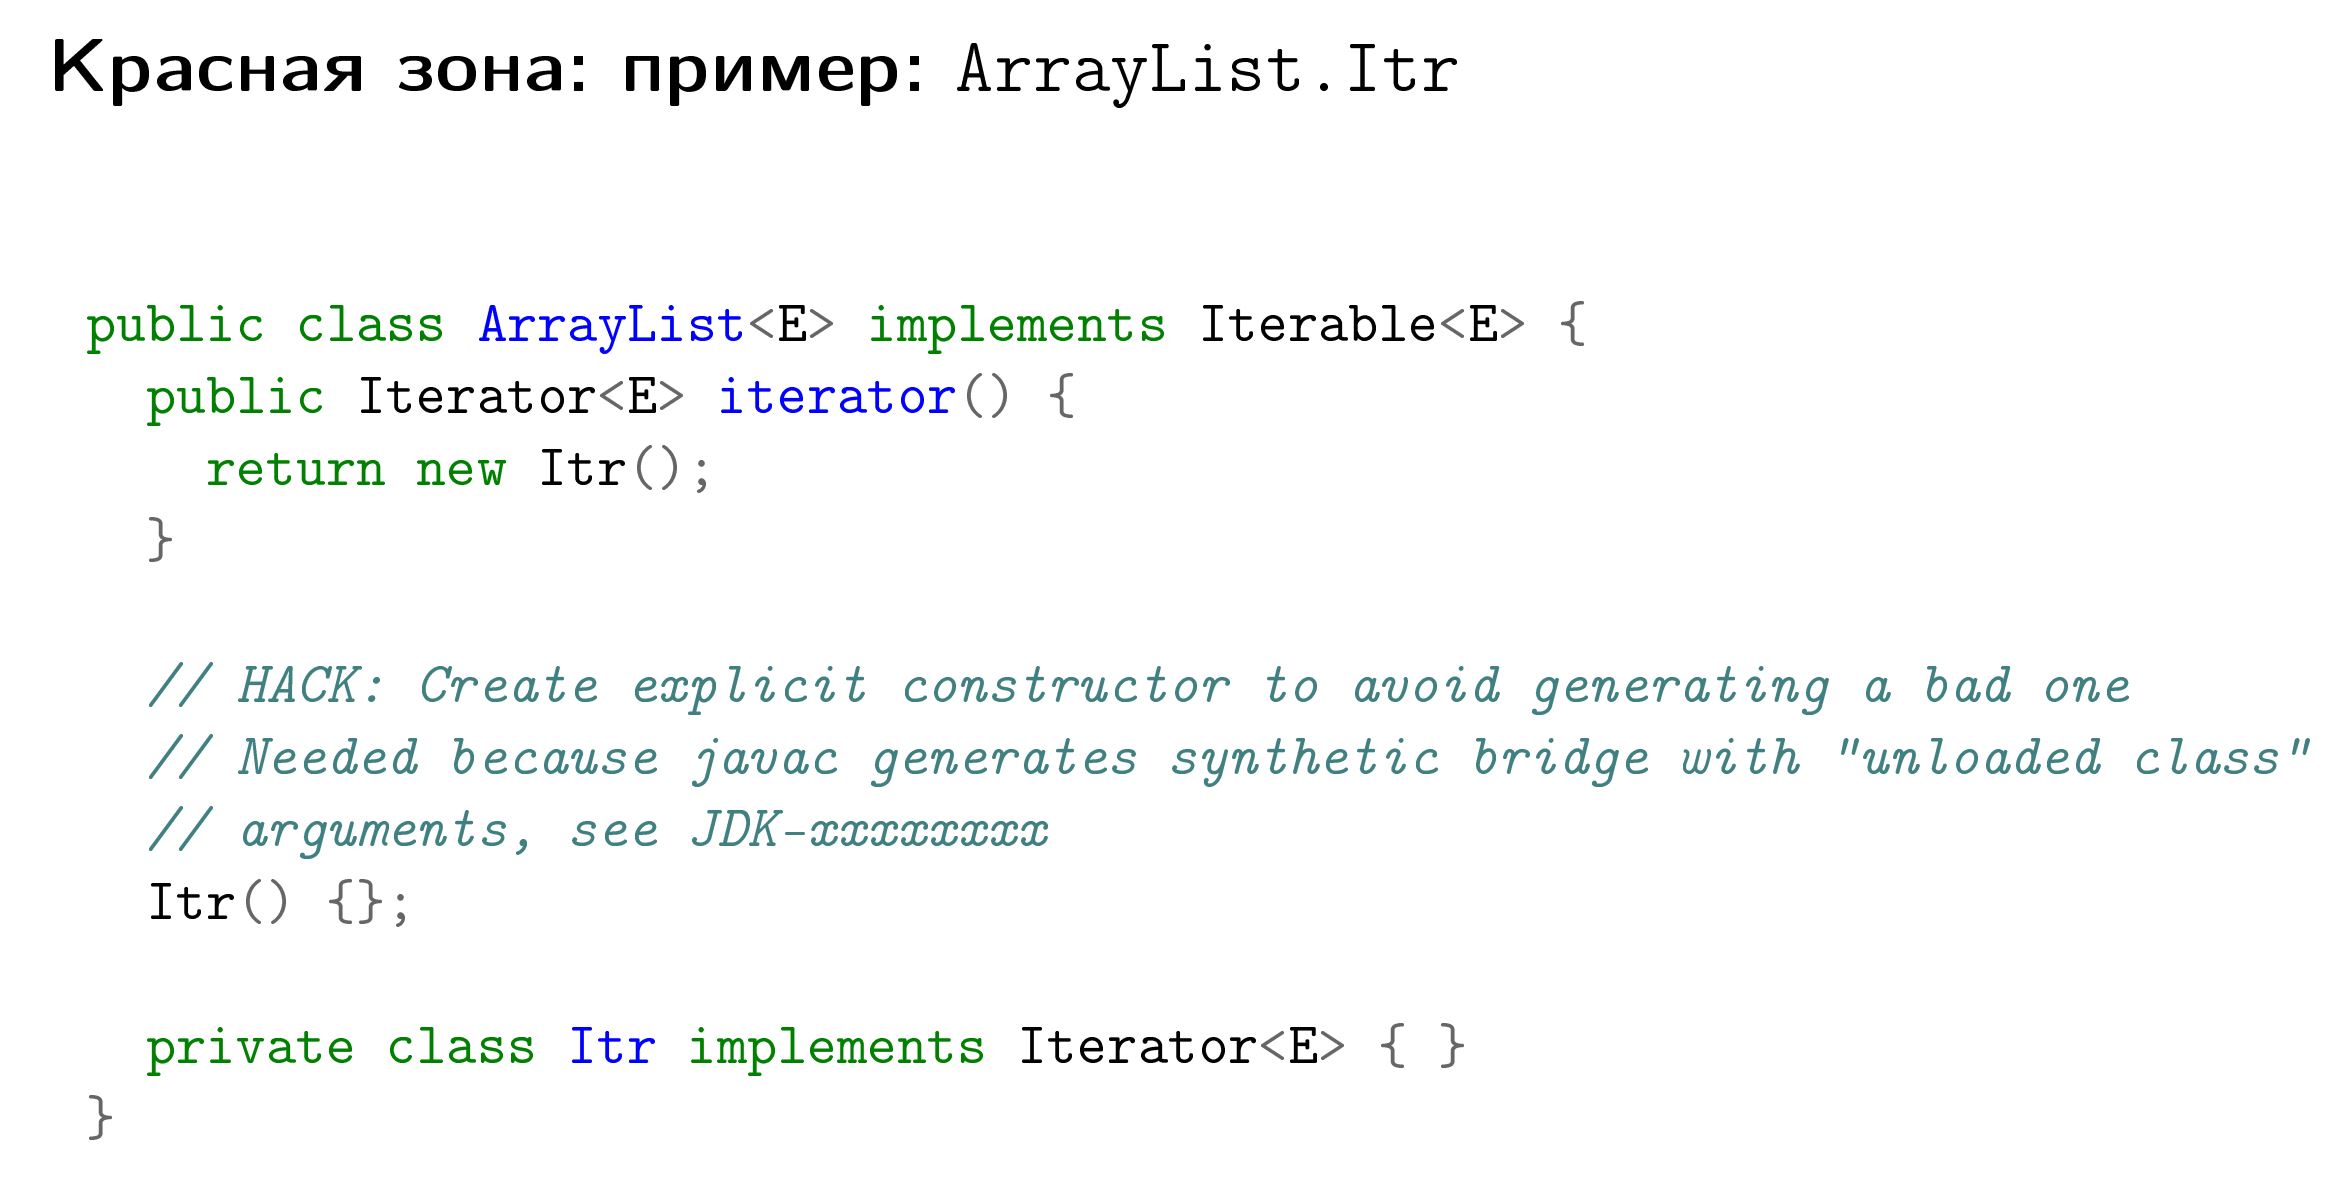
Therefore, such a constructor without arguments is made there, a reference to the bug is written there, why this constructor is made, etc.
When you dig for a long time in the red zone, people usually come to you and say: "Let's quickly wag, and everything will be hurt." The mental trap is very simple: they really think that if we quickly turn around with some kind of hack, it will be great.

Practice shows that in the red zone "zashib" will never happen .
As an example (I see it all the time):
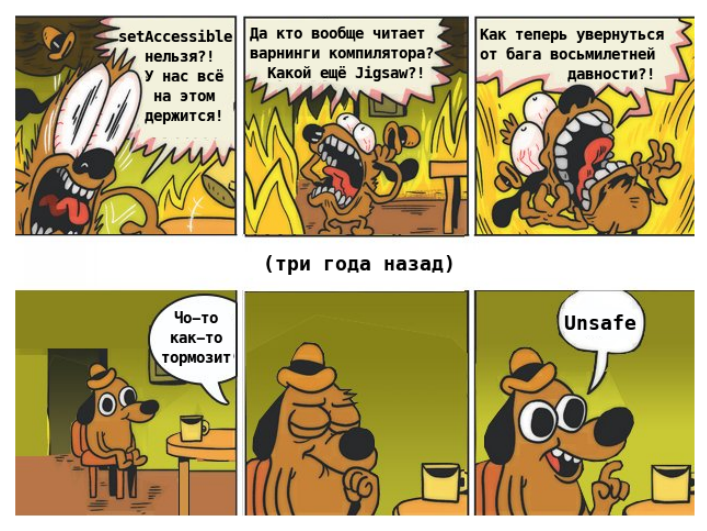
We found a performance problem in the JDK. Instead of fixing it in the JDK, we said, “Well, no. We are through Unsafe hacking. And then it turns out that Unsafe is gone, and even setAccessible () does not work. So do not be fooled. Working in the red zone, you make a technical debt.
Always document what the hack is done for, under what conditions we apply, how to check that it is no longer needed, what upstream bugs you are waiting for and so on.
I was on the lessons OBZH at school was taught to impose a tourniquet. I still remember this instruction, that you impose this tourniquet above or below the wound, depending on what color the blood gushes. But I remember because of a separate paragraph of the instruction: after you put a tourniquet on the body of your comrade, you should put a note there, with a timestamp.
Every time when I do such a hack in our code, this story is in my head: I put a harness on a sore spot in my code and have to write there that it was done then for such a reason, because there is - a bug, and this harness can be removed only if such conditions are met. This makes it possible for me or my other colleagues, when they discovered this code, to understand whether it is worth cutting it off right away, or if you take off the burn, it will kill the rest of the project (or your comrade).
I do not forbid you to do hacks. It would be foolish to admonish about this, you will still do them, because sometimes it is different in any way. But keeping the number and density of hacks in your project is a necessary condition for its survival.
The ability to work with upstream (if you, for example, are engaged in open source, commit your changes to the repository above) greatly facilitates your long-term fate. Because the more your inner patchwork covered product disperses from upstream, the more expensive you will support it.
The ability to understand all these layers successfully trains “on cats” in the sense that you must have a staging environment on which you can hack and make all sorts of non-trivial changes.
But here we are at a hardcore conference. What do we do with all this wealth?
If you are at a hardcore conference and you are a user of products, then from my point of view, as a person who is engaged in performance, you should be here:
If you are a product developer, then:
Please remember that the main performance work takes place in the green zone. Every time you are involved in project performance, first look at simple things. It is they who will give you more performance exhaust. Nobody will talk about them at the conference, because it’s boring. You will usually be told about the yellow or red zone, because it is cool and raises the speaker in his eyes. About how someone heroically changed LinkedList to ArrayList, usually no one will talk, because it's somehow embarrassing ... (end)
At Joker 2017, Aleksey Shipilev will give a new talk on “Shenandoah: a garbage collector that could (part 2)” and talk about the problems that a low-level GC has to face like Shenandoah, and what can be done with them at the JVM level. The conference will be held on November 3 and 4 in St. Petersburg. The program and announcements of other reports are on the official website of the event .
Under the cut - decoding his report.
And here you can find the presentation itself: jpoint-April2017-perf-keynote.pdf
')
About speaker
Alexey Shipilev - has been in the Java performance issue for more than 10 years. Now he works at Red Hat, where he develops OpenJDK and is engaged in its performance. Develops and maintains several subprojects in OpenJDK, including JMH, JOL, and JCStress. Prior to Red Hat, he worked on Apache Harmony at Intel, and then moved to Sun Microsystems, which was absorbed by Oracle. He actively participates in expert groups and communities working on issues of productivity and multithreading.
I work for Red Hat. Earlier, when I was working at Oracle, we inserted Safe Harbor slides that said that everything that we will tell you might not be true, so you need to think with your head. If you are trying to incorporate any solutions into your products, it would be nice to hire professionals who will tell you what’s true and what’s not.
Large: what are the criteria for success in developing
Suppose you are developing a product. What is a successful product for you? We are all commercial programmers. We can fool ourselves that we are paid a salary for what we code. But in fact, we are paid a salary in order to sell either services that serve the products, or products entirely.
But what are the purely development criteria for the success of a product (without taking into account the business goal)?
- When you communicate with programmers, they usually say that a good (successful) product is one that has a correct implementation .
- Then the security guards come and say: “You, of course, got it there, but it would be nice to make sure that there were no holes . Because otherwise we will sell, but then we will be dragged to court. ” However, this is also not the main thing.
- The main criterion for the success of a project is the compliance of what happened with the user's wishes . Of course, if we have a good marketing department, he can explain to the client that the result is exactly what he wants. But in most cases, I want the client to understand this. A lot of programmers, as it were, on a subcortex, have this in mind, but very few people directly verbalize it.
- Somewhere in fourth place - the speed and ease of development . This convenience and not the madness of programmers. When you talk to HR when you are hiring, they will promise all sorts of buns, massages and the like, but in fact the business doesn’t care how you live there, provided that you are still working and are not going to leave. And that the code is written conditionally well, and not so that you want to throw yourself out of the window or go to work for another company.
- Productivity is usually even lower in the list of priorities. Often it is not even in the criteria for success. The product somehow moves, and thank God.
Therefore, I am surprised when I read posts on Java performance on Habré and see similar comments there:
Experts say: “Well, what about Java performance? It works fine. We are satisfied, everything is fine. " But commentators come and answer: “It’s very significant that none of the four experts rated Java as fast. Rather, as sufficient and satisfying. "
You speak as if it is bad. If from a business point of view, technology meets business criteria, then thank God! I have no idealistic idea that everything should be licked, smooth, perfect. It does not happen - usually products contain errors.
Correct vs fast program
People have long learned some double thinking about the correctness of programs. (asks to the audience) Who can honestly say that there are bugs in his programs? (in the hall a lot of hands) The vast majority. But they still believe that their programs are more or less correct. The concept of a correct program has symmetry with the concept of a fast program.
"Correct program" is a program in which no user errors are visible. That is, there are errors there, but they do not force the user to abandon the purchase of a product. There is a symmetrical situation with the “quick program” - it’s not that there are no performance problems, these problems just don’t beat the user every time he tries to do something.
"We invested in success criteria." The success criteria are both functional and performance: it’s good if the program is responsible for 100 milliseconds. Answer? Great, we go on.
"The number of bugs in the correct program is usually known." This is just one of the indicative metrics of the maturity of the project, since zero bugs in the program means that no one really cares about registering them in the bug tracker (because you don’t have users, ha ha!). Performance problems have the same story. Performance problems are known, and then we say that this is a “fast” program. (makes air quotes)
Both in the correct program and in the fast program, the ways to bypass these performance and functional bugs are known. You have a FAQ that says, “If you do this, it will be painful; so don't do that . ”
Stages of development projects - curve them. Sh
Practically all projects where I participated in performance work are undergoing some standard phases of development. I once formulated that these phases look like this:
This is a parametric graph: time flows here from point “A” to point “B”, “C”, “D”, “E”. On the y-axis we have performance, on the x-axis is some abstract complexity of the code.
Usually, it all starts with people cycling a prototype that works slowly but slowly. It is rather complicated because we just bike or not so that it does not fall apart under its own weight.
After the optimization begins - little by little the rewriting of different parts begins. Being in this green zone, developers usually take profilers and rewrite pieces of code that are obviously badly written. This at the same time reduces the complexity of the code (because you cut out bad pieces) and improves performance.
At point “B”, the project reaches a certain subjective peak of “beauty”, when we have a kind of performance and a good one, and the product is not bad.
Further, if developers want more performance, they go into the yellow zone when they take a more accurate profiler, write good workloads and carefully tighten the nuts. In this process, they do things there that they would not do if it were not for productivity.
If you want even further, then the project comes to a certain red zone, when developers begin to make their product go wild in order to get the last percentages of performance. What to do in this zone is not very clear. There is a recipe, at least for this conference - go to JPoint / JokerConf / JBreak and try product developers, how to write code that repeats the curvature of the lower layers. Because, as a rule, in the red zone there are things that repeat the problems that arise in the lower layers.
The rest of the report tells in detail about what usually happens in these zones.
Green Zone
The motivational card of the green zone is a fight against burrs in the code by brute force:
Brute force means that you do not need precise tools - just take and do. There are some mental traps in the green zone.
My favorite is: “Profile normally or not”:
I constantly hear: "Listen to the reports of Shipilev, he will tell you that you need to profile normally or not at all." I never said that. When you are in the green zone, the accuracy of diagnosis affects very little. And, generally speaking, you need profiling in order to understand which part of the “microservice monolith” that you managed to write, you need to rewrite first of all.
Profiling and diagnostics
If you look at the blogs of various cool performance dudes, for example, Brendan Gregg, it will show such scary diagrams, saying that you can look back and forth with such tools:
Many people say when they look at these diagrams: “Performance is very difficult, and we will not do it.” Although in fact the idea of Brendan is not about that. It is that there are fairly simple ways to quickly assess what is happening in the application. When we have at least a macrocellular understanding, we are much better.
Therefore, diagnostics in the green zone is based on a very simple idea: we should not be afraid to look at our application. Even a large-cell understanding of what resources we lack in our stack already gives us some idea of what to pay attention to and what is not. Even if you do some full-system profiling, it will already be approximately clear where your bottleneck is.
Profiling
Our goal in the green zone is to understand approximately where we spend time.
Even a naive profiler, which you can collect from sticks and acorns, will give you enough information to perform conscious actions in the green zone.
If you have a production, on which evil admins do not allow to install a profiler, you can simply take ssh through josh and make “while true; do jstack; sleep 1; done. " Collect a thousand of these jstack, aggregate them. This will be a “knee-length” profiler, which will already give you enough understanding that your product is bad.
Even if you place your hands on stopwatch in the product and estimate that in this part of the product you spend 80% of the time, and in this part - 20%, it will be better than just reading the tea leaves about what will happen if we in a class accidentally written by Vasya in 2005 will fix something.
performance measurement
The next mental trap associated with profiling says that you need to measure performance either normally or not at all.
I constantly hear about it. But in the green zone of improvement "plus or minus kilometer" you can usually see with your eyes. Usually it is said in the context of “you have a bad benchmark, it doesn’t show anything, because it is written poorly, but you need to measure performance correctly,” and at the same time you have a rake there, which can be seen on almost any workload.
Morality
The moral is very simple: in the green zone, even trivial stress tests will show you major flaws.
I’ve seen cases when people spend weeks trying to write load tests on JMeter, instead of putting a public link on some Twitter and get a bunch of people coming to beta testing and crashing your application (and you’ll only have to sit with the profiler and watch where it fell). Even the usual Apache Bench shows big flaws quite well.
The sooner you are in the development of this performance data on major flaws, the sooner you can fix them. This will all the more help you plan work on performance.
Example surprise
I once took JDK 9 Early Access and thought: I should try to build my projects with him, suddenly something has changed!
I'm building, and my compilation time is growing from 2 minutes to 8. Suddenly. Do I need in such a situation to write some neat benchmark for this, to prove that this is really a regression?
Of course not. I have a specific bug in the build, it is reproducible. In the profiler you can find that there is a call stack that leads to a known location in javac. In this javac you find the source code, and a quadratic loop is found there.
Do I need to prove that this is a problem when you have: a) a workload that is bad; b) when you have a profile that shows there, and c) theoretical reflections that a quadratic cycle is bad? No, that's enough.
Optimization
Another mental trap: "Premature optimization is the root of all evil."
The whip, of course, is still alive and well. But I do not know how much he hiccups every time someone remembers this phrase, because it is usually remembered incorrectly. Knut said that premature optimization is the root of all evil in 99.7% of cases, because people do not understand where they need to be optimized. When you're in the green zone, you don't care. You still rewrite your beautiful code. You need profiling in order to determine what to rewrite first.
What are the visits there?
As a rule, the performance improvement there is mainly from rewriting the “bad” code to “good”. But “bad” and “good” are to some extent subjective tastes. Ask several programmers: one will say that it is necessary like this, so beautifully; and the other will say: “What have you written here!”. All this, of course, can be a taste, but it can also be suffered by techniques, including those suffered by you or Joshua Bloch, who wrote the book “Effective Java”.
For example, effective data structures. I know projects in which the global s / LinkedList / ArrayList / g has improved performance without hesitation. There are cases where LinkedList is faster, but these cases are very special, and they are usually visible to the naked eye.
You may suddenly find that you have a linear search on an ArrayList in a place where you can use a HashMap. Or you have an iteration over a pair of keySet and get, which can be changed to an entrySet, or bicycled your bubbleSort and suddenly it turned out that collections of a million items were coming there, and you spend a lot of time there, and so on.
Footer green zone
Profiling is a necessary part of daily development.
According to my observations, 95% of performance problems are solved at the very first profiling visits. Regardless of the complexity of the project, no matter how experienced people develop it, when you show people the first profiling of their project, they have a gamut of emotions, in particular, "what kind of idiots are we." Because more than 90% of these problems are trivially solvable and, in theory, should have been caught before the commit.
If you are a technical leader, architect, technical director, or you hold some other technical leadership position and want productivity, then please make sure that the project has clear instructions on how to launch the profilers. If you have a one-liner, or one-directory, or you have a web application that has an APM, then very well! A developer should always have a way to do it quickly.
In my experience, if you take a developer by the hand, no matter how “senior” he is, sit with them and once your product is reprofiled, this will surely stop his fear of performance work. Many people have such a block in their heads that performance is difficult, that there are all sorts of interrelations between components and so on. And they do not profile at all, because it is difficult - it means, for now it is not necessary. But when once you sit down and do it with them, this block is removed from them, they begin to profile on their own. And those 90% of the errors that they can resolve before someone comes to them, will show the profile and shame them, they will fix it in advance.
And “take the developer by the hand” - this does not mean that you drive them to the conference, put them in the hall for 1000 people, the speaker comes out and starts to carry something intelligently in the profiler. It does not work. It works differently: you sit down with a specific developer on your project and do it for a couple.
Yellow zone
The yellow zone is a code complication in exchange for performance when you do things that you would not do if you did not want more performance.
Mental traps are there too.
Profiling and diagnostics
The first mental trap: "Now we take a profiler, see what is where, and how we will begin to optimize."
It turns out that in the yellow zone the price of an error has increased: now you get performance, and you lose something in return - support, developers' sleep, and so on. Therefore, you need to make the right changes that require advanced diagnostics, and profiling is only one part of the diagnosis. There is also benchmarking and stuff.
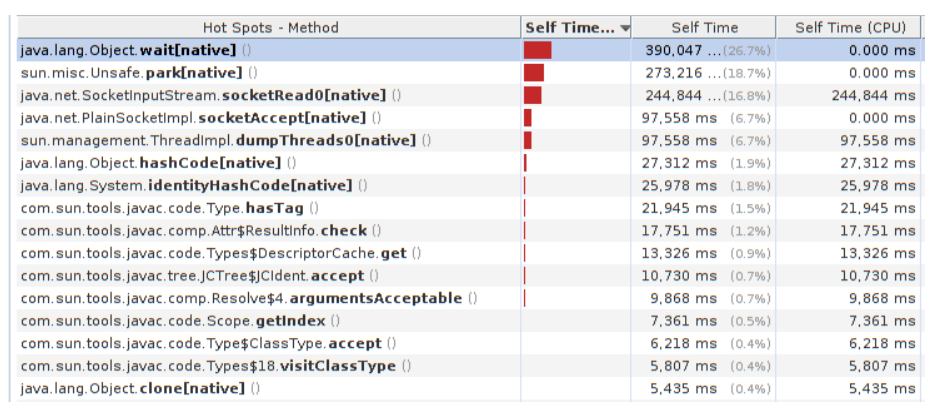
Usually, when people get into the yellow zone and start thinking about what to optimize, they open the profiler and see it:
And what are we going to optimize here? Rewrite to java.nio or say that the hottest method is java.lang.Object.wait, which means you need to overclock it. Or there Unsafe.park, it means that you need to overclock it ... or SocketInputStream.socketRead0, or socketAccept - it means that you need to urgently rewrite everything on Netty, because the network is visible. True, all this garbage from JMX, but we will learn about it later, after 3 months of development. Or there Object.hashCode - let's say that bad HotSpot did not optimize it, and “you promised us that everything would be quick and good, and our product is not to blame”.
The modus operandi in the yellow zone is simple: when optimizing, you will now have to explain why you are doing it. Maybe for yourself, and maybe for your project manager.
It is desirable to have on hand:
- numerical estimates of growth
- and it is advisable to have them before you spend all the resources . And not when the three months of development have passed, and you said: “Oh, you know, the task took three months, it's cool.”
- You must have an understanding that this is the cheapest way , and that this method is the one that will give you an improvement in overall performance.
Amdal's Law
When people assign tasks to assess performance, the inexperienced start to freak out terribly, because it is very difficult for people to put non-linear dependencies in their heads. One of these non-linear dependencies is the Amdal law, and it is usually arrived at as follows.
Suppose we have an application. It has two independent parts: A and B. And we, for example, know that part A takes 70% of the time and accelerates 2 times, and part B takes 30% of the time and accelerates 6 times. You can overclock only one of them - there is only enough resources for this. Which of these systems will we overclock? If we even reduce them graphically, we see:
Part A works at 70% of the total time. It is better to optimize part A, despite the fact that we only overclock it by 2 times. The impact on overall performance is greater.
And if I were a freelance programmer, I would probably have overclocked Part B 6 times. In my weekly report, this figure will look much better: “Vasya dispersed twice, and I dispersed six times, so I need to increase my salary three times.”
Amdal's law is derived as follows:
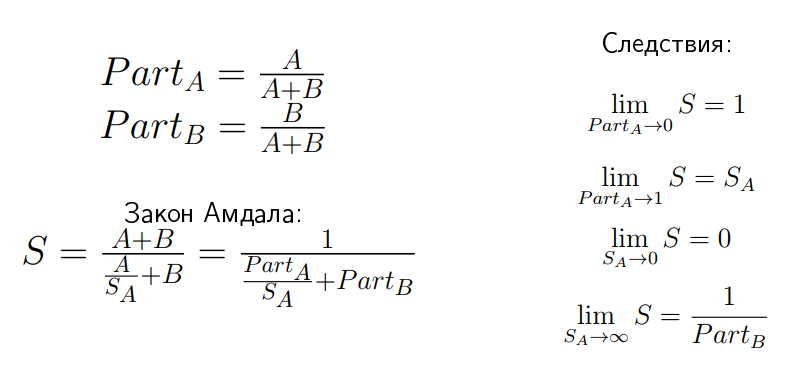
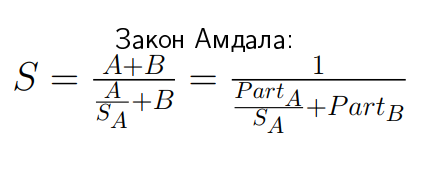
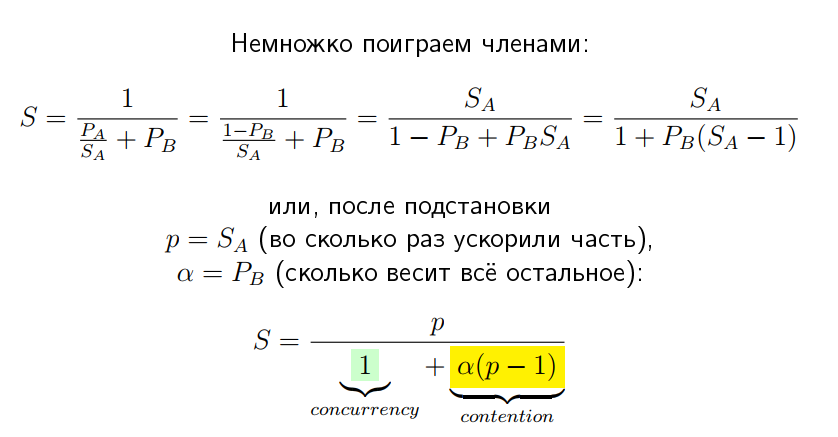
If we have speedup S, then by definition it is total time A plus B divided by new time. Part B there remains the same, so there is “plus B”, and part A has decreased by S A times. If we introduce two notation: Part A and Part B , which show the relative time of parts A and B in this appendix, we come to the following expression:
This ratio has funny properties. For example, if you go to infinity, then S is the limit:
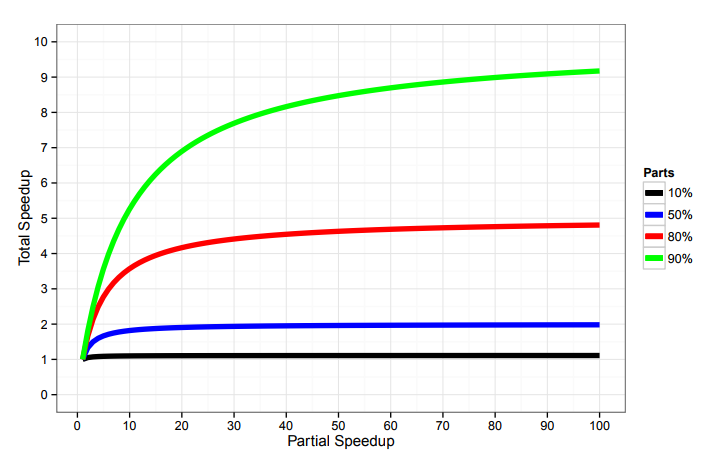
This is not an obvious thing, you need to feel it several times on your own skin in order to understand. You will be shown through such graphics:
... and say: if you have an application in which 80% is occupied by the part that accelerates, then overclock it at least until you get stuck, but speedup is more than 5 times, you will not get.
This means that if a database vendor comes to you and says: we know that the database occupies 50% in your workload. We guarantee you, if you change your current solution to ours, without changing a single line of code, your performance will grow 10 times. What do you have to tell him? (from the audience) Bull shit!
We go further: there is a generalization of the law of Amdal. If we slightly reverse these terms and introduce two new notation: p is speedup A, this is how much we dispersed a specific part of A, and alpha is how much everything else is, then this law can be written in this form:
The thing is that these terms have some physical meaning. The first member is usually called concurrency . If we ignore the second term so far - the contention - expression will mean: how many times we accelerated part A, we got a common speedup at the same amount. Contention describes the performance impact of everything else that provides this very asymptote in Amdal’s law. By the way, if the graphs of this function are drawn, you get the same curves as in the Amdal law:
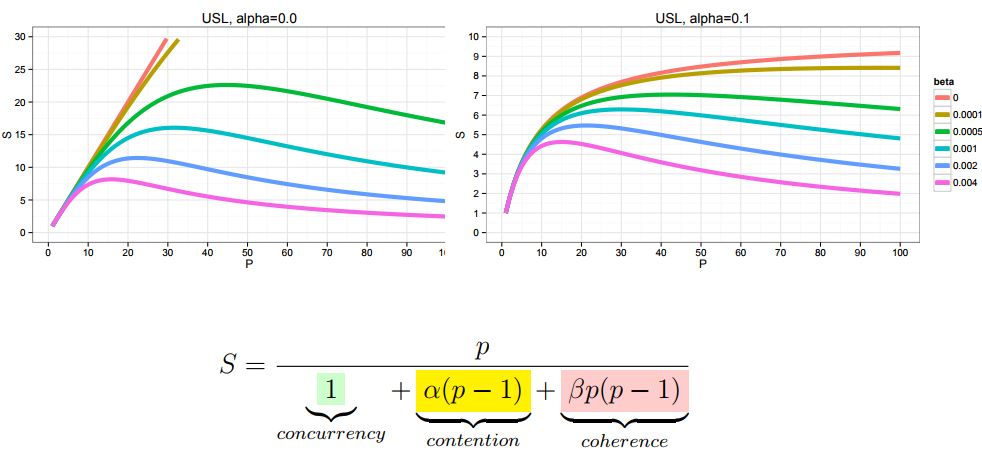
However, as a rule, in most applications, the Amdala law in this form does not apply. A more complex law applies when another term is added there, called coherence , which describes the interaction between components.
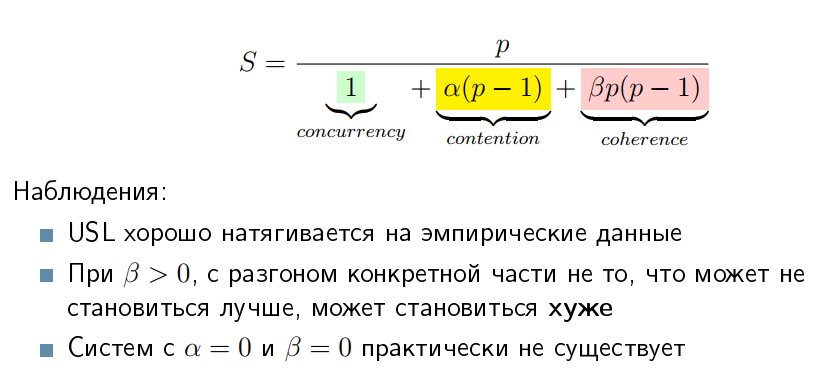
It turns out that if alpha and beta are non-negative, then you do not have saturation asymptotes. You have some kind of peak efficiency, and after that, performance starts to fall. Many people who are engaged in performance, on their own skin felt this law, until it was formulated as the Universal Scalability Law (USL):
The concepts of "universal" and "law" are used here in a natural-scientific sense, that is, it has a theoretical justification, but it is not derived analytically. It is derived as a law that stretches well on empirical data.
Systems with alpha and beta, equal to zero, does not exist, because there are many cases when you add resources to the system or optimize something, and it gets worse. For example, you removed one bottleneck, but rested against another, heavier one.
performance measurement
A mental trap with performance measurement says: “Since everything is complicated there, and we don’t know how everything will affect performance, we just find something and see what benchmarks tell us.”
In fact, performance testing is wildly expensive, and you’ll not test it all. Performance tests from functional tests differ in that functional (for example, unit tests) pass in 100 milliseconds or less, even if they are executed in a pack. With performance tests not everything is so smooth. There, tests pass from a minute and up, can take hours. This means that one change can be tested for hundreds of engine hours. If you make a bunch of commits a day, then you need a very large fleet of equipment in order to ensure at least some way to pass through the test system.
Performance tests require isolation, otherwise they begin to speak every kind of heresy, because they begin to interact with each other.
Performance tests, as a rule, give non-binary metrics. Functional tests usually say "PASS" or "FAIL" - binary metrics, and performance tests say ... "67". Worse: they say not “67”, but “67 plus or minus 5”. This, among other things, means that testing errors are only after parsing the data , when you understand that everything is very beautiful everywhere, and here, in a dark corner, there are data that show that the experiment was fake. This means that all other data also need to be thrown away and again spend hundreds of machine hours on a new cycle.
And the worst thing is that the benchmarks give you data — numbers , but you want results — some knowledge you can get from these numbers. And if data acquisition is well automated, then the part about extracting meaning from this data, as a rule, is poorly automated, since it requires a human understanding of what is there and how it can occur.
Conclusion - in the active project it is almost impossible to test everything. This means that you still need to have in your head some assessments and the ability to figure out where to dig, without chasing away all the benchmarks for every sneeze.
Benchmark classification
Many people divide benchmarks into two large classes: macrobench marks and microbench marks.
In macrobench marks, as follows from the “macro” prefix, we take our large website, application or library as a whole, write end-to-end tests and see how long it took one virtual user to buy our infinitely valuable products in the online store . Normal test.
Microbench marks are small workloads when we take a small part of our website or library, do a small isolated test and measure a specific part.
The developer’s voices in his head usually whisper to him that the macrobenchmark reflects the real world, and the microbench marks reflect evil.
Look: the real world is big, and the macrobenchmark is big. (conspiratorially) Therefore, the macrobenchmark reflects the real world. Therefore, it seems to some that any macrobenchmark is a good one. Say, launched a macro benchmark - this is the real world.This means that for any cool feature, the macrobenchmark will give a dramatic improvement, because it is also a “real world”. And if the macrobenchmark does not show improvements, then this feature is bad. And that for any cool bug, the macrobenmark will give a steep regression, and if there is no regression, then there is no bug. This is a “real-world”, which means that what happens in the real world should also be in the macro benchmark.
With microbench marks - the opposite situation. Voices in the developer's head suggest that they are evil, so they can be ignored. They tell you that the readings of the microbenchmark are not important, because you can write it in any way, which means that regression or improvement on it means nothing. And when they encounter the real world, the thought comes that the microbenchmarks are written by enemies to defame their product. Because it is easy to write them, you can write whatever you like, which means you can write a microbenchmark, thanks to which we later write in white paper that our product is better, because at such a workload, it works better.
Benchmark life cycle
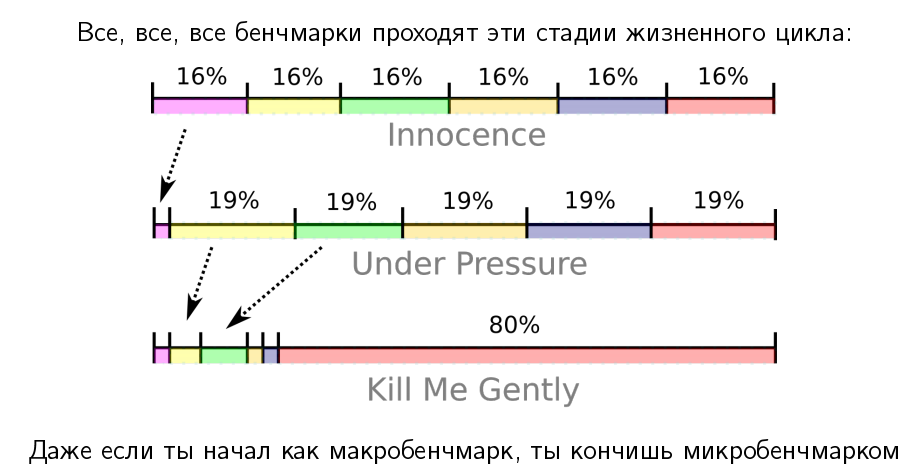
If we discard this marketing bull shit about microbench marks, it turns out that the life cycle of all benchmarks are about the same.
If you have a big benchmark - gigabytes of code, in which dofig libraries, code, etc., it usually begins with the "innocent" stage, when it really tests many parts of your product, walks through many layers, and so on. Suppose they take about the same time there. But then evil developers come and start optimizing.
We started with a macrobenchmark that covers many parts of the application, but at the end of its life cycle, its performance is stuck in one big bottleneck, which is very difficult for us to resolve. And this is practically the case of a micro benchmark, when we have an isolated test that tests one thing. Such a degenerated macrobenchmark also tests only one thing.
But still this has some advantages. Unobvious plus follows from the law of Amdal.
Take an application with two parts - red and green, which is optimized. Even if we optimize the green part to 0, we still get the speedup only twice. But if the red part regresses (if we, say, 2 times regress it), it turns out that Amdal’s law, which has an asymptote, will become a linear relationship.
In other words, if we regressed a small part a thousand times, the total metric will also decrease significantly.
You can show it on the graph as follows:
On the abscissa axis we have the speedup of a specific part, and on the ordinate axis the speedup of the product as a whole. In the part where something is improving, we have asymptotes from Amdal’s law, and where everything is getting worse, we have a practically linear relationship.
The problem with testing is also that empirical performance testing is noisy. There are systematic and random errors in the experiments.
Often, the sensitivity of the test may simply not show you an improvement on a particular change. If something has improved 50 times, then the improvement in the overall system will be below the sensitivity threshold of the test, and if it regressed 50 times, it will be much better seen. This is, by the way, the answer to the question of why, when you are engaged in productivity, most of the things that you see in your automatic reports are regression. Because, as a rule, testing is more sensitive to regression, and not to improvement.
According to my observations:
Macrobenchmarks:
- They are few, they are written incomprehensibly by whom and it is not clear how;
- first show interesting results, and then degenerate into microbench marks;
- at the end of life is still applicable for regression testing.
Those.Making a performance improvement on macro brands is a heartbreaking story.
Microbench marks:
- There are too many of them, they are also written incomprehensibly as well as incomprehensible by whom, but they are so small that they can be embraced and corrected with one mind: understand what is wrong there and somehow modify them;
- at all stages of the life cycle, they show interesting results;
- respond well to regression and improvement.
Therefore, if we, for example, do performance optimization, we always have a body of micro-benchmarks (very sensitive workloads), on which we make changes and squeeze the maximum. Only then we validate that they have not regressed and improved the macrobenchmark.
No matter how you spin, and you have to learn microbenchmark. The most interesting idea is that the “just take some successful framework and rewrite all workloads on it” method does not work, because it is not enough just to write the benchmark code and get the numbers. To understand what is happening, you need to peer into these numbers, maybe build side experiments, correctly conduct them and analyze the data, and then draw conclusions and build a so-called performance model — understand how your application or your stack reacts to changes in code, configuration, and so on. This will give you the opportunity to predict what will happen in the future.
Optimization
Usually, however, is not the case. Usually, people fall into the next mental trap:
“We tried, and it improved the metrics - it was not 100 operations per second, but 110. Probably because ...” and further the link to some report with JPoint follows. I, he said, was at a conference, and there a smart dude said that I could step on such and such a plunder. As a result, we rewrote the multiplication for non-multiplication, and we had a branch prediction or something in this spirit (here, more importantly, in a scientific manner, to be more accurate).
In fact, it often happens that you are just lucky with the load, with the component, with the phase of the moon. A little luck will be gone, everything will be back to square one. As a rule, in relation to each improvement, you need to look at the following options (if I have an improvement, you need to understand what it refers to):
- , , — N^3, N log N. , , , , , ;
- , , , , , , . , PR , ;
- . , , , -;
- Or it is an incorrigible library jamb or runtime, but to migrate from this library or runtime is very dear to us. Then we make a permanent patch, we enter into our annals of technical logs, which is the only way to do this.
If we do not classify our changes into these categories, then it may be that we make a bad temporary patch against a bug in the lower layer, that bug will sometime be fixed, and fixes in the regular library will be better than our patch. But we will already pay for the maintenance of the patch, the failed performance in comparison with the competitors that did not twitch, etc.
JVM options
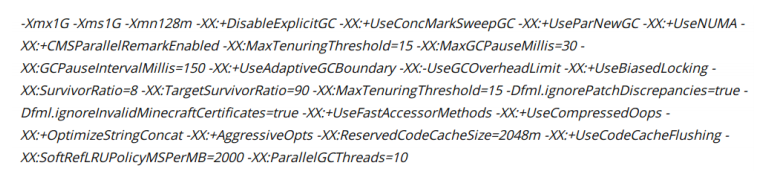
Another example: what will happen if we know what is special in our application, we will tell the JVM what mode to work in? The joys are very simple there: mechanical sympathy, synergy and all that (we know how to tune the JVM).
In practice, of course, this happens differently. You go to Google and search for: “JVM tuning options”. You fall out this ski:
You put it in your config, it really improves something, and you draw yourself an asterisk “I know how to tying JVM”.
Of course, there are problems. It may be that, in general, this unit has improved your performance, but there are options, which, among other things, regressed. If you understood what you are doing, you could take the whole improvement, not just a part of it.
Parallelism
No matter what we have written where we are, we will take parallelStream (), Eexecutor.submit, new Thread, we will load a bunch of parallel tasks. Normal idea? The joy here is that special changes in the code are usually not necessary if it was originally written with the thought that someday it will be multi-threaded.
But there are the same problems: there is synchronization, and it is unclear how she will shoot on wider wheelbarrows. There are overheads - on small tasks you do not need to parallelize, because you all will eat on dispatching tasks. Or if you have a staging in which you have a lonely Vasya pokes in the mold, and there internal parallelism helps you. Well, for example, there is some kind of request, and you are there inside it submitting to some mega-Hadoop that MapReduce is doing to you in parallel; and it all works faster when everything is parallel. And then you deploy it to production, and suddenly it turns out that you have 10,000 users, i.e. internal parallelism is not needed at all - you have a lot of external parallelism that already exploits all your resources.
Data structures
Another example.Some people think: "At conferences, they told me that, in general, Integer and generally wrappers over primitives in Java are an expensive thing, so we take and rewrite everything into int arrays and so on."
Of course, “int-ovka is a holiday” in the sense that you take, rewrite and think that you are performing useful actions. The problems, however, are very big: you do not know in advance how much you will eat on conversions to wrappers, how much time you will devour development time (working out all angular cases, round-trip conversion of all collections, writing inserts, deletions, brakes), and you will probably miss the optimization of the JDK itself in the collections and in some Valhalla.
Subtotal for the yellow zone
Modus operandi: in the yellow zone, our main task is to maintain a plausible performance model of the project, because it tells us where to change, so that it is good and we do not regret about it later. This is a necessary condition for the development of the project.
According to my observations, more than 50% of potential changes are not done where they are. And they usually miss for a very simple reason: commands are broken down into components, and they can quickly make changes to their component, even if you need to make a bugfix in the component of another command.
As a rule, more than 80% of changes are made in the right place after the study (and 83% of all statistical data are usually correct).
The ability to explore and update your knowledge of the project entirely helps to make the right decisions. If your teams are divided by components, please have people who can look at this project from the outside, who will understand how the components are related to each other and what changes to make. Usually this role is performed by the architect. But architects are usually overwhelmed, so they hire performers who help feed them with data about what is happening in the project. Thus, it is possible to help the architect in his head to update this very performance model.
Red zone
Motivation in the red zone: when we chose all reasonable ways to improve performance, there were unreasonable ways. Unreasonable ways - this is the exploitation of the curvature of the lower layers, dirty khaki, climbing into the intestine. As a rule, in the absolute majority of projects there is no need to go there.
Competent technical management, sane tehlide, project manager or, in the end, caring mother should tell you: “You don’t have to go there”!
The basic idea in the red zone is simple - we want to improve performance by exploiting the implementation features in the lower layers.
For example:
- we find that in a library that we really like, there is a hidden private method that does something faster. Typical hack: we will take this method through reflection and pull;
- or we honor the library's course and find out that if we pull public methods in some special order (I call API API acupuncture), then we will translate this object into a state that is more acceptable to us - it will probably work faster;
- or we take and just zakhachim whole pieces of the private API;
- or we will begin to exploit the features of the specific glands on which we execute, the specific JDK that we target - i.e. do low-level optimizations.
Profiling and diagnostics
Usually everything happens in this zone by accident. When all possible options are chosen, they say to themselves: “Well, let's think what to do next.” And it seems to them that if you look at a profile for a long time, then you can see a solution there. They understand that the decision will be difficult, so you need to look for a long time.
In fact, the ability to hack in the red zone grows out of understanding the interaction of moving parts. And here in this place performances appear - these are people who are not particularly engaged in everything else, but they know how to dig in all layers at once. They are a walking encyclopedia, they have in their head a set of hacks that work in such and such conditions. They know the limits of their applicability. The most important thing is that these are people who do not fall into a stupor when they see unfamiliar crap, but begin to study it.
If they see a profile from which nothing is clear, they say: “Well, all right, we will reject this profile, let's do experiments that will be brought to us by some new data”. The systematic inductive way of data collection works here. Studying for them does not mean nafigachit a piece of code, posting it on StackOverflow and asking: “Do we have such a performance problem, what could it be?” And wait until some people come to them, such as John Skit, and will tell how and what to do there. To study means to read documentation, look for references in articles, do experiments, extract knowledge from colleagues, systematize them in some way, and so on. Many people come to the conference for this.
Conference Tricks
There is one more mental trap: “If you travel a long time to conferences, someday some conference will be told a trick, which in our project will give an improvement five times, and then we will beat off the entire budget spent on tickets.”
In fact, in a particular case, one out of a thousand low-level trick saves. It is easier to find on your own than to wait for the weather by the sea. The funny thing I see in the programmer get-together is that most of the performance discussions are about low-level hacks:
As a rule, all these things happen in conditions when programmers in projects have simple algorithmic transformations that can repeatedly improve performance. But since they were told at conferences that smart HotSpot somehow compiles, so you need to modify your project so that it compiles well with HotSpot, they miss the main thing - that in fact they have changes that they can find for themselves (and make it is fast) and it will improve performance.
Crutches
If we are in the red zone and find this kind of low-level difference, which in fact in most cases is the difference in the implementation of optimizers (many of the above-mentioned cases actually have to work the same way), we can zakhachit. But hacks should be temporary patches, not the basis of our project.
As a rule, they indicate problems in the layer below, since the layer below should actually provide a more sane performance model in which any option will work better. If you listen to the report, in which you will be told about different low-level game, please do not take it as a guide for immediate action. This report helps you to build a corpus of possible hacks, which, maybe, someday will be needed if strongly pripret.
Example
There is a very simple example that was recently found in JDK 9.
There is an ArrayList type in Java, it has an iterator that is implemented through the inner class Itr. This class Itr, since it is private, has a synthetic so-called bridge method (public), so that the Itr constructor can be called. The problem is that if we call Itr, the Hotspot inliner breaks down because it sees classes that are not yet loaded in the signature of this method.
Where is this error (under-optimization)? Is this a bug in the ArrayList code? Probably not. Is this a javac error? Yes, rather. Is this under-optimization in the hotspot code? Yes, rather. But it's easier to zachachit it directly in ArrayList, until compilers come to their senses and do not understand how to fix this in the compiler.
Therefore, such a constructor without arguments is made there, a reference to the bug is written there, why this constructor is made, etc.
Correction Approaches
When you dig for a long time in the red zone, people usually come to you and say: "Let's quickly wag, and everything will be hurt." The mental trap is very simple: they really think that if we quickly turn around with some kind of hack, it will be great.
Practice shows that in the red zone "zashib" will never happen .
As an example (I see it all the time):
We found a performance problem in the JDK. Instead of fixing it in the JDK, we said, “Well, no. We are through Unsafe hacking. And then it turns out that Unsafe is gone, and even setAccessible () does not work. So do not be fooled. Working in the red zone, you make a technical debt.
Always document what the hack is done for, under what conditions we apply, how to check that it is no longer needed, what upstream bugs you are waiting for and so on.
I was on the lessons OBZH at school was taught to impose a tourniquet. I still remember this instruction, that you impose this tourniquet above or below the wound, depending on what color the blood gushes. But I remember because of a separate paragraph of the instruction: after you put a tourniquet on the body of your comrade, you should put a note there, with a timestamp.
Every time when I do such a hack in our code, this story is in my head: I put a harness on a sore spot in my code and have to write there that it was done then for such a reason, because there is - a bug, and this harness can be removed only if such conditions are met. This makes it possible for me or my other colleagues, when they discovered this code, to understand whether it is worth cutting it off right away, or if you take off the burn, it will kill the rest of the project (or your comrade).
Subtotal in the red zone
I do not forbid you to do hacks. It would be foolish to admonish about this, you will still do them, because sometimes it is different in any way. But keeping the number and density of hacks in your project is a necessary condition for its survival.
The ability to work with upstream (if you, for example, are engaged in open source, commit your changes to the repository above) greatly facilitates your long-term fate. Because the more your inner patchwork covered product disperses from upstream, the more expensive you will support it.
The ability to understand all these layers successfully trains “on cats” in the sense that you must have a staging environment on which you can hack and make all sorts of non-trivial changes.
Parting words
But here we are at a hardcore conference. What do we do with all this wealth?
If you are at a hardcore conference and you are a user of products, then from my point of view, as a person who is engaged in performance, you should be here:
- update the stock of information on the applicability of hacks from the red zone. It’s not that you start recording right now what hacks from the red zone you should introduce into your production, but simply update this dictionary;
- find accomplices and discuss work approaches in yellow. How to more accurately profile and monitor, and so on;
- or discuss what receptions from the yellow zone to bequeath to the green zone, i.e. which things that you considered to be a performance-to-performance exchange are now simply standard code-writing practices.
If you are a product developer, then:
- to help their users to discuss approaches in the yellow zone - how to profile, how to monitor, and so on;
- and understand which hacks from the red zone, which people constantly face, should be dragged either into the yellow or into the green zone.
Please remember that the main performance work takes place in the green zone. Every time you are involved in project performance, first look at simple things. It is they who will give you more performance exhaust. Nobody will talk about them at the conference, because it’s boring. You will usually be told about the yellow or red zone, because it is cool and raises the speaker in his eyes. About how someone heroically changed LinkedList to ArrayList, usually no one will talk, because it's somehow embarrassing ... (end)
At Joker 2017, Aleksey Shipilev will give a new talk on “Shenandoah: a garbage collector that could (part 2)” and talk about the problems that a low-level GC has to face like Shenandoah, and what can be done with them at the JVM level. The conference will be held on November 3 and 4 in St. Petersburg. The program and announcements of other reports are on the official website of the event .
Source: https://habr.com/ru/post/338732/
All Articles