Profiling project build
A couple of months ago, I screwed profiling to our build system (the JamPlus fork). It was implemented on the Chrome Tracing View that I described earlier, so it was easy to add its support to Jam. Jam is written in C, so I just found a suitable library for profiling in C (it was a minitrace ) and literally in several lines wrapped up the places of interest to me (the assembly itself).
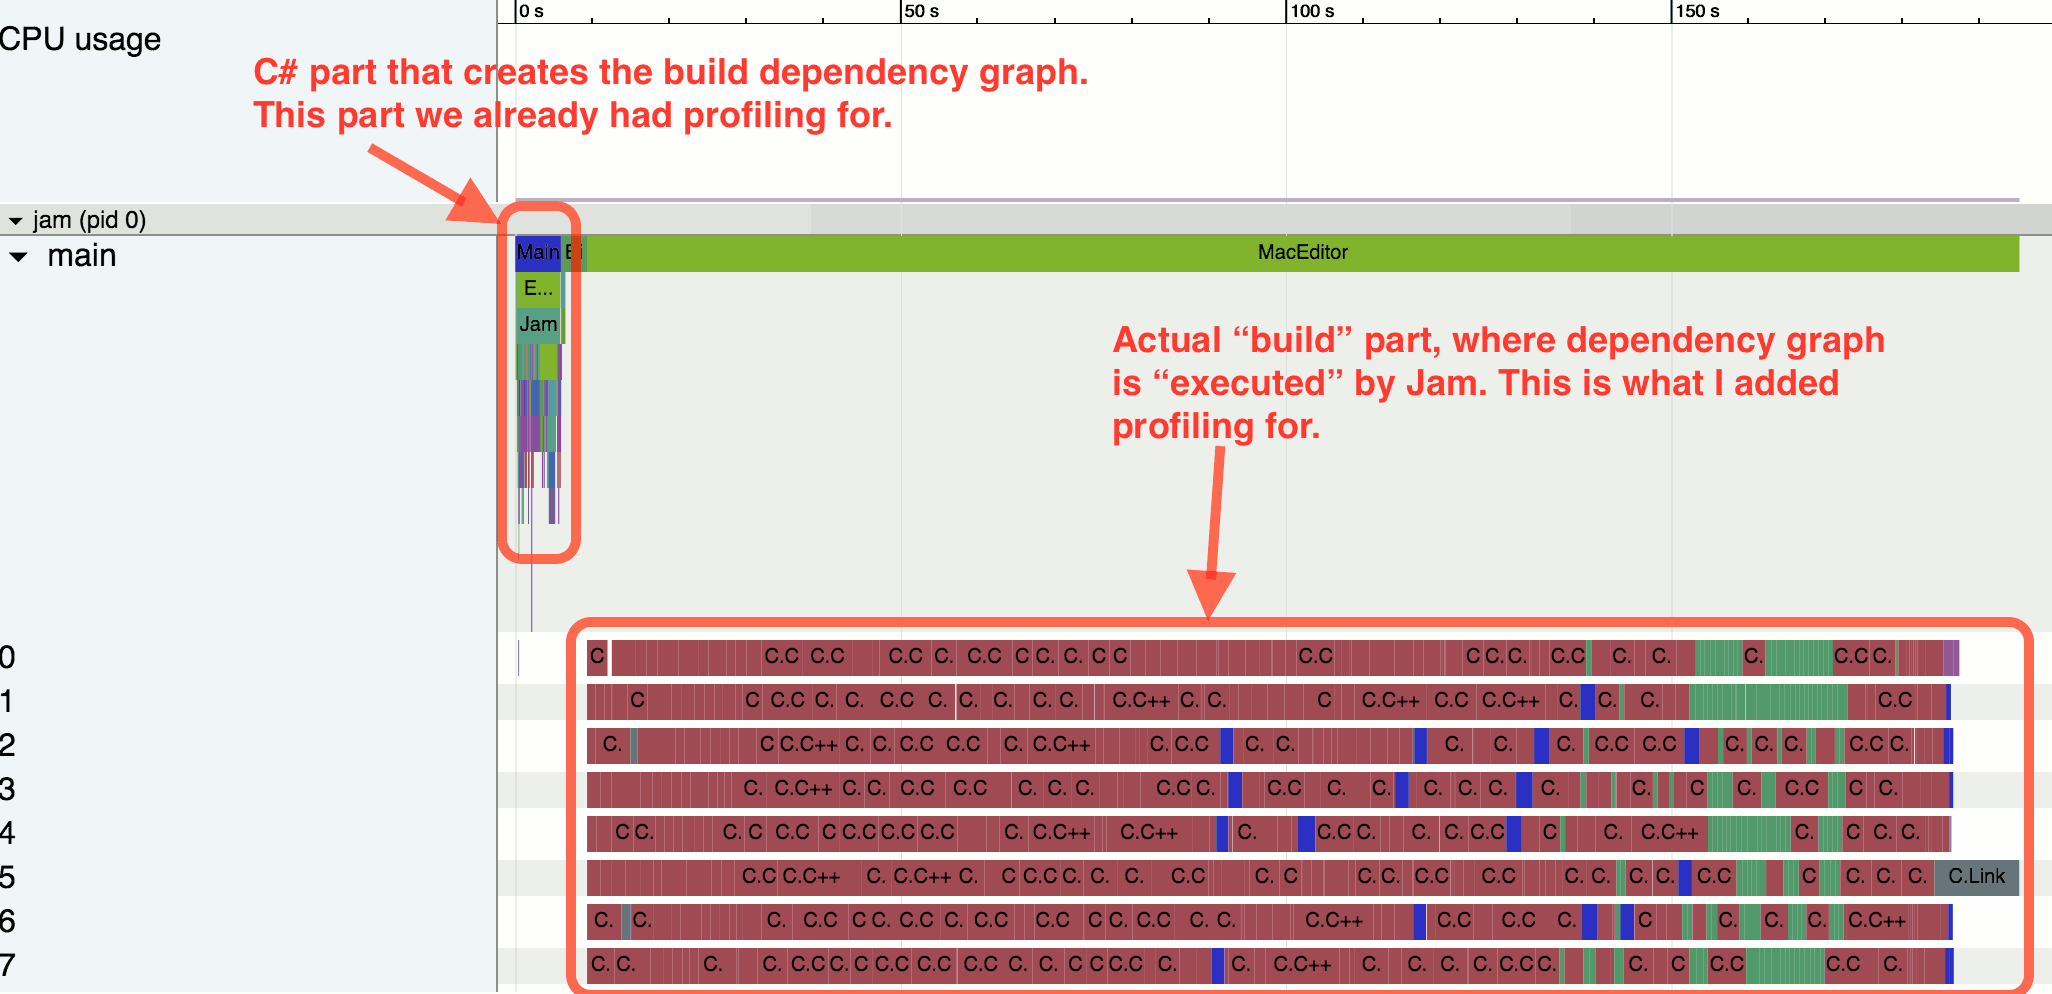
There is nothing outstanding here. However ... as soon as you get the first results of profiling, they often make you think and start to notice something.
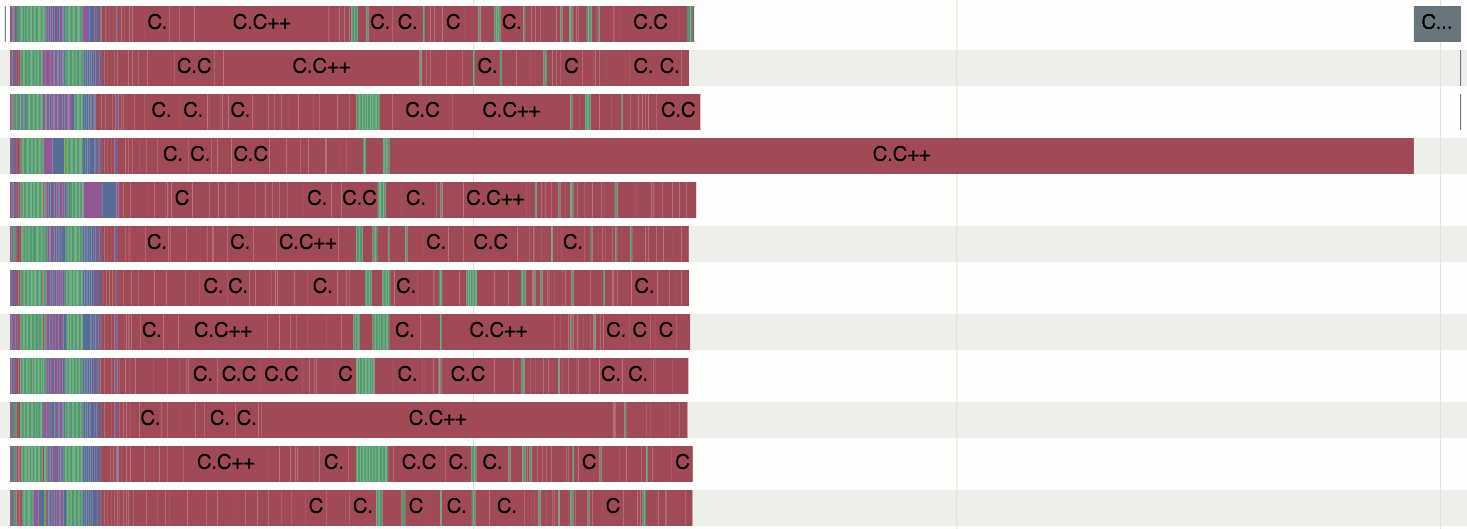
Once I was doing something unrelated to the topic of this article and for some reason I looked at the output of the profiler for the new build of my product. Experience suggests that linking is the lion's share of C ++ code assembly. This time, however, this was not the case:
')

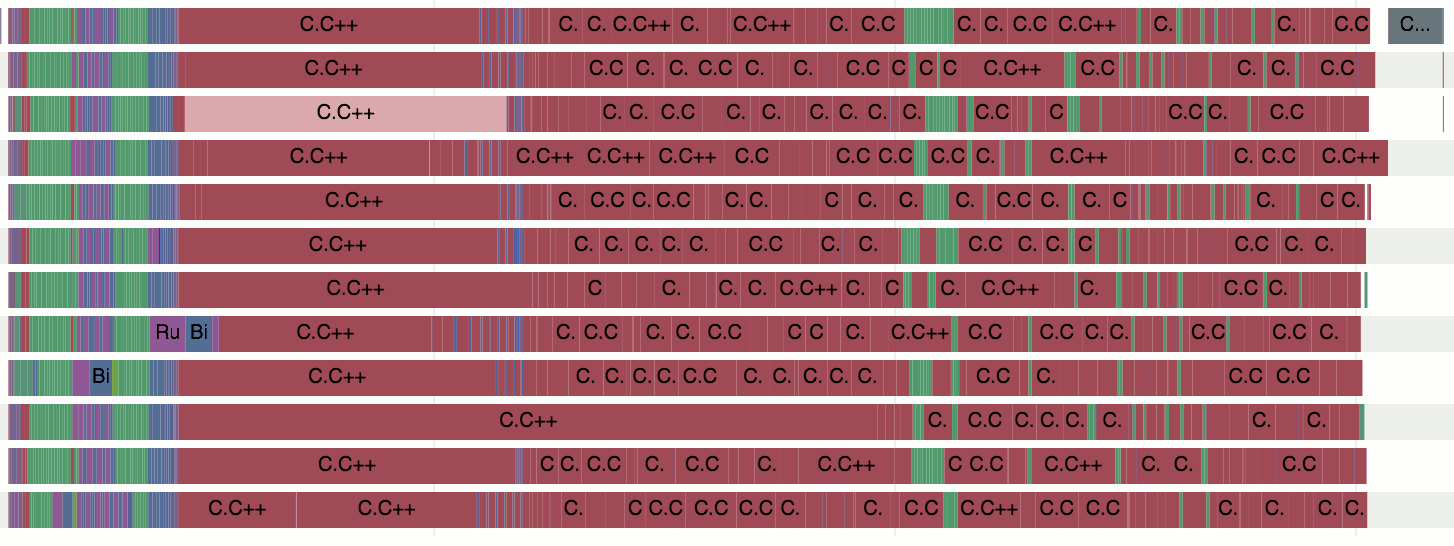
A big delay is easily seen in the diagram before the linking stage. Most of the code is already compiled and only one file with C ++ code continues to be collected. Then I was busy with another task, so I just added a task to figure it out on our board with tasks. Another time I was building a build of another component of our product and again looked at the output of the build profiler:
And here things looked already frankly bad. The total build time was about 10 minutes and almost 7 of them were compiled with just one file (5 of which nothing else was compiled). At that moment, it became clear that the problem was in an assembly system of such a scale that does not allow it to be ignored or postponed anymore.
The average compile time for C ++ files in this project and in this configuration was about 2 seconds. There were a couple of files that were collected for 30 seconds, but 400+ seconds for the assembly went beyond all reasonable limits. What is going on?
I did some experiments and found out that:
Whether our approach was ideal was a separate question, but then it gave us enough advantages not to abandon it out of the blue. But all the same, something had to be done with the speed of compilation.
One simple change that was entirely at the mercy of the build system could be the exclusion of slowly compiled files from Unity builds. Their whole point is to slightly save on compiler launches and preprocessing common header files. However, for several files, the compilation of which takes 30+ seconds, this gain will be minimal, but the need to wait several minutes at each assembly because of the "stuck" at the end of the file assembly is a significant problem.
It would be nice to somehow force the build system to start compiling the “slow” files as early as possible. Let's start earlier - finish earlier. The ideal option would be to fasten an analysis of historical data on previous assemblies to the assembly system and automatic compilation queue generation based on them. But this was not necessary in this particular case - just the exclusion of files from the unity builds in our build system moved them to the top of the queue. Ok, that's enough for us.
This trick didn’t really speed up our 7-minute build of that “bad” file for a second, but it was easy to do and he immediately gave about one minute of total gain on the entire assembly (which had taken 10 minutes before).
And after that, I did something that I generally had no hopes for - I broke the largest template function into several smaller ones in that “slow” file (some of which were no longer template). Trivial refactoring. Some IDEs are able to do such things in the mode “selected with a mouse a part of the code, right click, Extract Function”. Well, that's just C ++ and the code, as I said, contained many macros and templates, so I had to do everything manually.
After selecting about 5 functions, the compile time of the problem file dropped from 420 seconds to 70. It became 6 times faster!
Of course, highlighting functions means that they are no longer an inline code and we have the costs of calling them (passing arguments, jump, return). At the same time, this approach still allows the calling function to use registers (better or worse), to reduce the total amount of code, etc. We measured the speed of the modified code on different platforms and concluded that the performance changes are insignificant. So, this time it worked!
Of course, a minute to compile a single file is still a lot. But further attempts to speed up the compilation would entail significant changes in the design of our mathematical library. This required more thoughtful planning.
Build after the changes are made already looks better. There are no more heaps of processor cores waiting to complete the compilation process on one of them. Linking is still consistent, but this is not news. The total assembly time fell from 10 minutes to 5 minutes 10 seconds, i.e. It became almost 2 times faster.
There is nothing outstanding here. However ... as soon as you get the first results of profiling, they often make you think and start to notice something.
Things seen
Once I was doing something unrelated to the topic of this article and for some reason I looked at the output of the profiler for the new build of my product. Experience suggests that linking is the lion's share of C ++ code assembly. This time, however, this was not the case:
')
A big delay is easily seen in the diagram before the linking stage. Most of the code is already compiled and only one file with C ++ code continues to be collected. Then I was busy with another task, so I just added a task to figure it out on our board with tasks. Another time I was building a build of another component of our product and again looked at the output of the build profiler:
And here things looked already frankly bad. The total build time was about 10 minutes and almost 7 of them were compiled with just one file (5 of which nothing else was compiled). At that moment, it became clear that the problem was in an assembly system of such a scale that does not allow it to be ignored or postponed anymore.
The average compile time for C ++ files in this project and in this configuration was about 2 seconds. There were a couple of files that were collected for 30 seconds, but 400+ seconds for the assembly went beyond all reasonable limits. What is going on?
I did some experiments and found out that:
- Our assembly system, built on the principle of Unity builds , was not the culprit. The whole thing was in one specific cpp-file.
- This behavior was interpreted by the MSVC compiler (clang worked 10 times faster), but then we needed MSVC
- The problem concerned only the release assemblies (or rather those assemblies where inlining was enabled)
- The problem concerned not only the old VS2010 compiler. Compiling with VS2015 worked even slower
- A common point for all files, the compilation of which took more than 30 seconds, was the use of our “mathematical SIMD library”, which made it possible to write code in the HLSL style. The implementation was based on highly sophisticated macros and templates.
- The same file, the compilation of which took 7 minutes, included a very large and complex SIMD-function, which also due to the use of templates required the creation of several typed implementations at the compilation stage (this way we got rid of the overhead on runtime, so this the approach made sense)
Whether our approach was ideal was a separate question, but then it gave us enough advantages not to abandon it out of the blue. But all the same, something had to be done with the speed of compilation.
Compile acceleration
One simple change that was entirely at the mercy of the build system could be the exclusion of slowly compiled files from Unity builds. Their whole point is to slightly save on compiler launches and preprocessing common header files. However, for several files, the compilation of which takes 30+ seconds, this gain will be minimal, but the need to wait several minutes at each assembly because of the "stuck" at the end of the file assembly is a significant problem.
It would be nice to somehow force the build system to start compiling the “slow” files as early as possible. Let's start earlier - finish earlier. The ideal option would be to fasten an analysis of historical data on previous assemblies to the assembly system and automatic compilation queue generation based on them. But this was not necessary in this particular case - just the exclusion of files from the unity builds in our build system moved them to the top of the queue. Ok, that's enough for us.
This trick didn’t really speed up our 7-minute build of that “bad” file for a second, but it was easy to do and he immediately gave about one minute of total gain on the entire assembly (which had taken 10 minutes before).
And after that, I did something that I generally had no hopes for - I broke the largest template function into several smaller ones in that “slow” file (some of which were no longer template). Trivial refactoring. Some IDEs are able to do such things in the mode “selected with a mouse a part of the code, right click, Extract Function”. Well, that's just C ++ and the code, as I said, contained many macros and templates, so I had to do everything manually.
After selecting about 5 functions, the compile time of the problem file dropped from 420 seconds to 70. It became 6 times faster!
Of course, highlighting functions means that they are no longer an inline code and we have the costs of calling them (passing arguments, jump, return). At the same time, this approach still allows the calling function to use registers (better or worse), to reduce the total amount of code, etc. We measured the speed of the modified code on different platforms and concluded that the performance changes are insignificant. So, this time it worked!
Of course, a minute to compile a single file is still a lot. But further attempts to speed up the compilation would entail significant changes in the design of our mathematical library. This required more thoughtful planning.
Build after the changes are made already looks better. There are no more heaps of processor cores waiting to complete the compilation process on one of them. Linking is still consistent, but this is not news. The total assembly time fell from 10 minutes to 5 minutes 10 seconds, i.e. It became almost 2 times faster.
Morality
- Having at least some kind of profiling system for an assembly of a project is better than not having any at all. If we didn’t have such a system, we would have lost 5 minutes on each build of the project (not only on the build server, but also on the development machines).
- When your template function is compiled, N typed views are created. And each view is a separate code that is automatically generated first and then compiled. Moreover, for different versions of such code, depending on the types used, the compiler may also apply various optimizations. Dividing a large template function into smaller (and possibly non-template) functions can actually speed up compilation.
- Complex template functions can be compiled for a long time due to the optimizer being too long to work. For example, the MSVC compiler spends most of its time on this.
- Accelerating the assembly is a good thing. Well, remember, that comic - "-Hey, where are you going? - The code is compiled!". The less this happens in life, the better.
Source: https://habr.com/ru/post/338672/
All Articles