Storage Recycling Analysis
How to understand that storage is bad? How to determine that the performance margin is exhausted? What parameters indicate this? This article will discuss the analysis of storage utilization, as well as the identification and prediction of problems related to performance. The material may not be of interest to experienced storage administrators, since only general points will be considered, without delving into the logic of tricky performance optimization mechanisms.
To begin with we will be defined with terminology. There are several terms and abbreviations close in meaning: storage, disk array, SAN, Storage Array, or just Storage. I'll try to clarify.
SAN - Storage Area Network or storage area network, is a collection of equipment that transmits traffic between a server and a storage system.
')
Storage - data storage system or disk array, the equipment on which data is stored with the possibility of real-time access. There are still archival vaults, but here we will not consider them. Storage abbreviation can also be used as an abbreviation for saving data storage , but among Russian- speaking specialists, the term storage system is assigned to the data storage system.
Storage systems can provide two ways to access data:
- Block access, server operating system works with storage as with a SCSI hard disk (simplified).
- File access, server operating system works with DSS as with file storage using NFS, SMB and so on.
Typically, storage systems providing block access have higher performance requirements than systems providing file access, this is due to the specifics of the tasks being solved. Next, we will focus on storage with block access using the Fiber Channel protocol.
Three main metrics are used to evaluate storage performance.
- Service Time, often referred to as latency or responce time, is measured in milliseconds and means:
- when reading: the time from the moment the storage system received the task to read the information block to send the requested information.
- during recording: time from the moment of receiving the recorded block of information until confirmation of its successful recording.
- IO / s is the number of input / output operations per second.
- MB / s - the number of megabytes transferred per second.
The parameters IO / s and MB / s are closely related to each other by the size of the data block, i.e. One megabyte of information can be written in blocks of 4k and receive 256 I / O operations, or blocks of 64k and get 16 IO.
Consider the most typical manifestations of storage performance problems in terms of Service Time, IO / s and MB / s.
Increased Service Time

For each storage system, there is an extreme value of Service Time that corresponds to maximum performance, in other words, a slight increase in load will lead to a significant increase in Service Time, thereby causing degradation of demanding applications.
For example, below are graphs of Service Time versus IOPS for two storage configurations.
ST for All flash storage, 2 Node, 24x1.9 TB SSD, RAID 5, Random 32k, 50/50 Read / Write.

ST for classic storage, 2 Node, 24x1.8 TB HDD, RAID 5, Random 32k, 50/50 Read / Write.

In general cases, for All Flash the storage system is considered to be acceptable service time less than 1ms, and for classic storage systems up to 20ms. The threshold for an acceptable Service time depends on the number of controllers, the speed of the disks and, of course, the models of the storage system itself, and may differ from the given values.
You also need to consider to what level the delays of the disk subsystem maintain the normal operation of the application, and always have the necessary margin.
MB / s bar

Most often indicates the exhaustion of bandwidth or FC adapter.
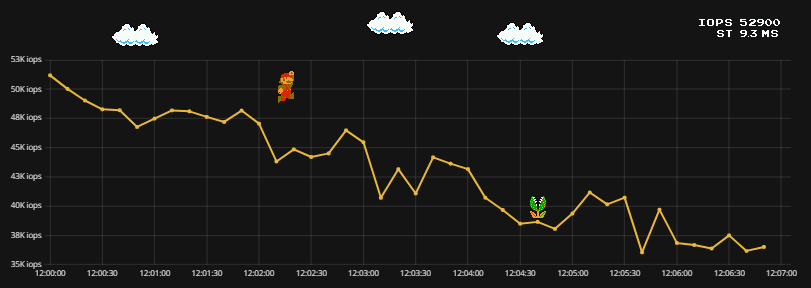
Competing values for MB / s or IO / s

The sum (orange graph) of two or more parameters on a time interval has a constant and does not exceed it at any time. This situation can occur in the case of competition for bandwidth of the channel or port of the storage system.
Decrease of IO with increasing ST


If the percentage distribution of the block sizes has not changed, but at the same time the ST starts to increase and the IO falls, this may indicate hardware problems with storage, degradation of one of the controllers or high utilization of the CPU.
CPU utilization
CPU utilization of storage controllers in general cases should not exceed 70%, if it is constantly above 70%, this indicates the lack of storage performance margin.
Here it should be noted that storage systems can be divided into two large groups:
- Using ASICs, in such storage systems the data transfer within the array is processed by a separate high-performance chip, and the CPU remains with service tasks, such as creating and deleting disks and snapshots, collecting statistics, and so on.
- Without using ASIC, in such storage systems all tasks are performed by the CPU.
CPU utilization should be interpreted differently for storage systems with and without ASIC, but in any case it should not be higher than 70% in the absence of running service tasks.
Slow IO reading

Such a problem can be observed if the storage system uses the data placement tearing between media of different speeds (for example, SSD and NL SATA).
For example: a certain database works with a high load one day a week, and idle for the rest of the time, in which case data for which there have been no calls for a long time will go to media at low speed, and the reading speed will gradually increase during the transition (the so-called data warming) on fast carriers.
What is the nature of the load does not indicate problems?
IO ramp

MB Racing

Jumping IO values

All of the above load cases do not indicate any problems on the storage side. The load is created by the host connected to the storage system and depends on the logic of the processes using disk space.
How to determine trashholds for Service Time, IO / s and MB / s?
These parameters can be calculated theoretically, adding up the performance of the disks and considering the penalty of the selected RAID level, you can also use the saisers if present, but the calculation will be very approximate, since the actual load profile will not be taken into account. To determine the exact threshold values, indicating, for example, about 90% of the storage load, it is necessary to carry out load testing using special software, having formed a load profile that is close to real and measure the maximum values of IO / s and MB / s. But what about Service Time? There is a non-linear relationship. To determine the Service Time of the corresponding 90% load, you simply need to generate 90% of the maximum achieved value by IO. The results obtained can be extrapolated to similar configurations of data storage systems.
Instead of conclusion
Analysis and interpretation of storage performance parameters in most cases is not a trivial task, you need to understand the architecture and operation of a specific storage system, have a SAN port scheme and know the operation nuances of the used FC adapters. I did not consider the impact of replication and the use of convergent solutions, since the use of these technologies significantly complicates the description of processes affecting performance and narrows the list of general recommendations. The article did not understand the parameters of using the controller cache, disk loading and utilization of the internal switching ports of the data storage system, since the interpretation of this data strongly depends on the specific storage model and technologies used.
Source: https://habr.com/ru/post/338438/
All Articles