How to increase service indicators by 7 times in three months using HADI-cycles and prioritization of hypotheses

My name is Ilya Kitanin, I have been leading development in various companies for more than 7 years, now I’m in the FRIA Pre-Accelerator. In this article I will tell you how with the help of HADI-cycles and Goldratt's Theory of Constraints (TOC) we were able to grow the key indicators of the Cofoundit service 7 times in 3 months and continue to grow actively now. In this material there are cases of application of the IIDF methodology, the rakes that we have passed, and the necessary minimum of the theory.
Cofoundit is an internal start of the IIDF to select employees and co-founders for the team, where start-ups and candidates can quickly find each other and run together to an international company.
My colleague Yulya Kopylova and I started doing this service on March 15 of this year. The service has existed for six months, but did not show significant results. And we had a task before July 1 to prove the consistency of the service. For this it was necessary to multiply increase the number of closed vacancies per month, as well as speed up the process.
As is usually the case, we faced several restrictions:
')
- Terms : as I wrote above, it was necessary to have time to show the result by July 1.
- Time : Yulia and I continued to carry out our main tasks, and engaged in service only in our free time. I was in charge of the development, and Julia acted as an account manager.
- The development budget was notably limited.

Dano: what was the service like when we started it
The mechanics were as follows:
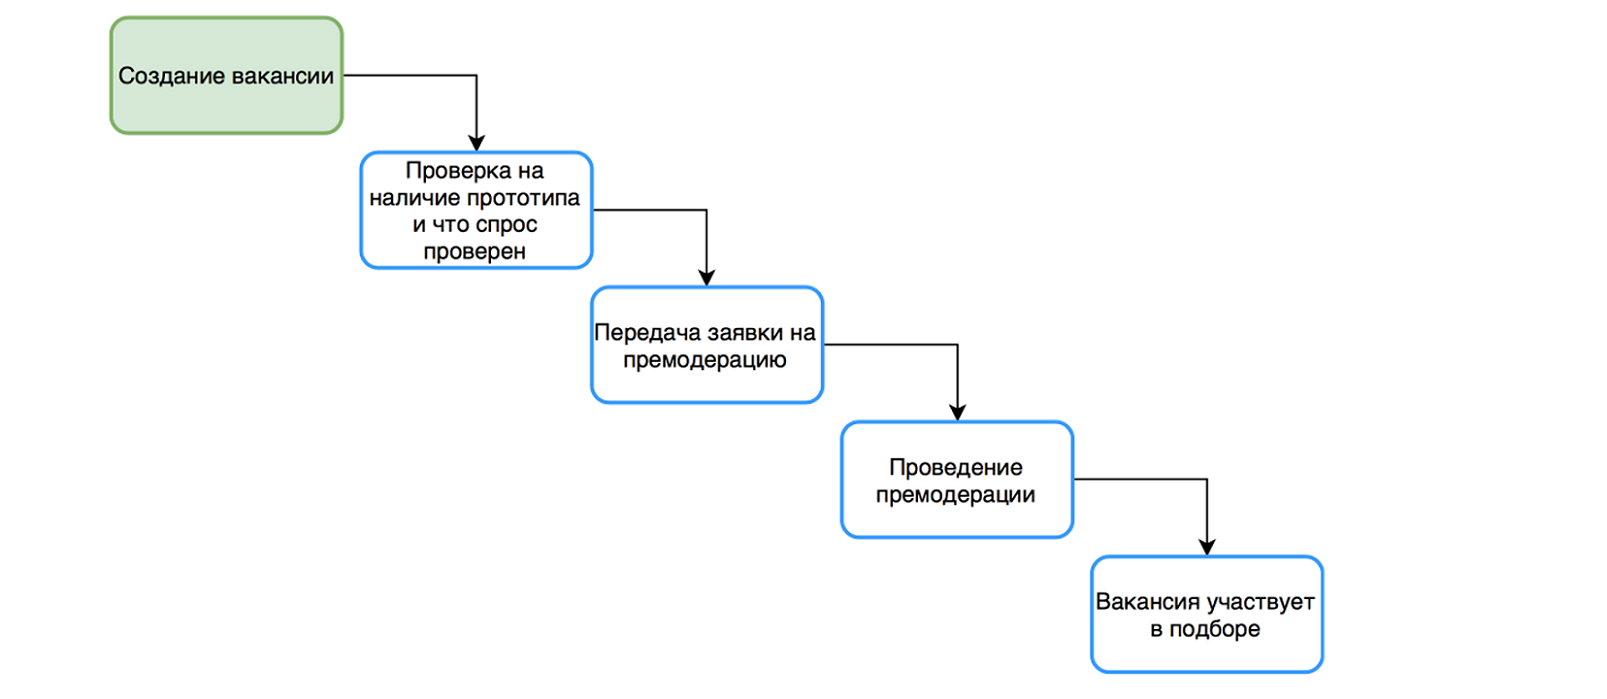
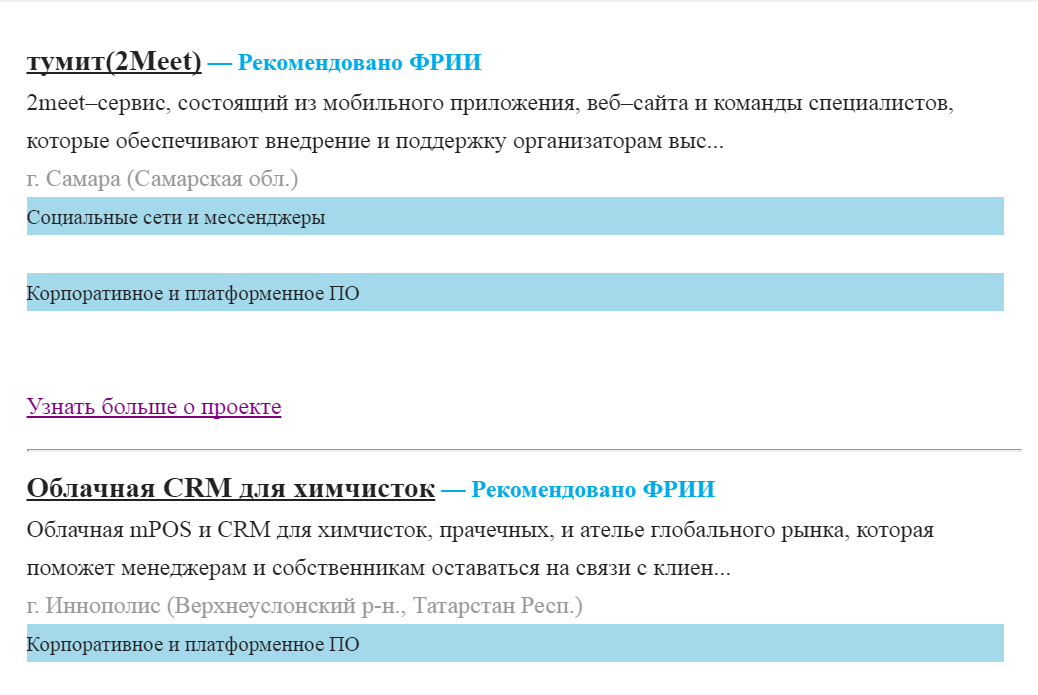
The startup filled out the Preaccelerator profile and created a vacancy in the “Team” block.

Examples of startup questionnaire questions
Then there was an automatic check for the minimum requirements (that the startup has a prototype, and the demand for the product is checked) - and the application was sent for manual moderation to Julia. Only when the moderation was successful did the vacancy be created and made available for the selection of candidates.
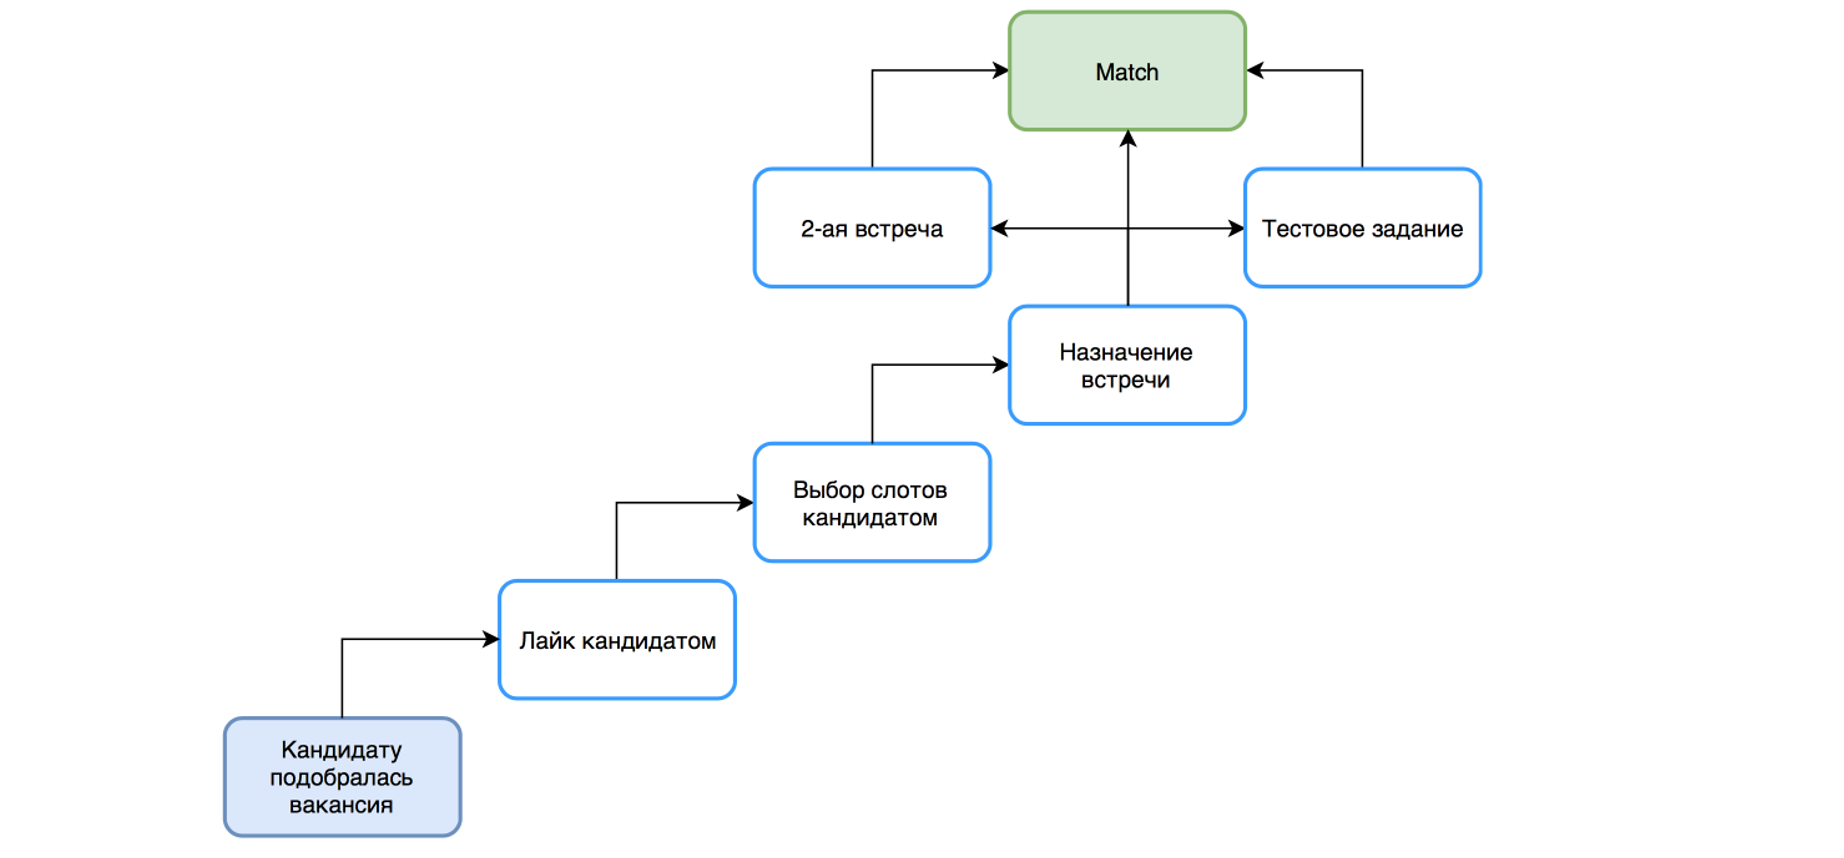
On the candidate’s side, the path was a bit simpler: he filled out a short form, where he answered a few questions and attached his resume. After that, he saw no more than 5 vacancies, each of which he could refuse (click "not interested") or be interested (like), then choose the estimated time of the meeting. At the same time, the startup left a letter that the candidate was interested in them.
The startup made an appointment and, after the meeting, decided whether they were continuing to communicate with the candidate, and in what format they started working together (a match occurred, the vacancy was closed), the candidate received a test task, or the startup made a second meeting.
With such mechanics, the key indicators of the service were not good enough:
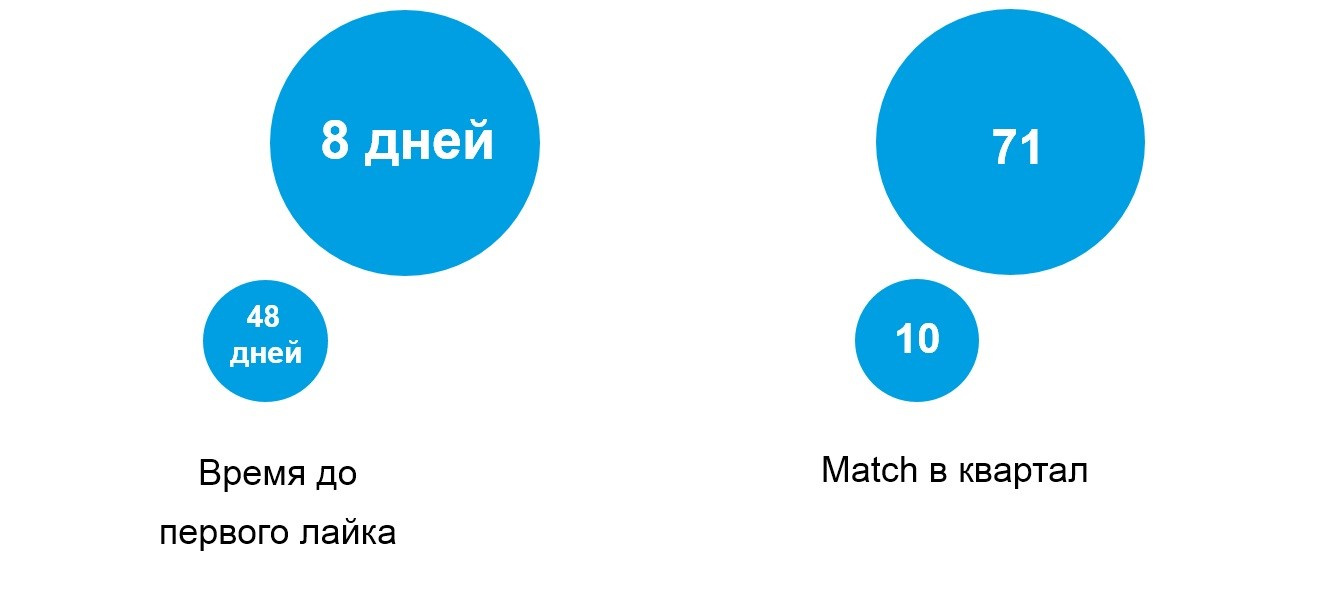
- 11 closed vacancies per quarter;
- The average time to first interest candidate (Like) - 48 days.
Solution: HADI cycles tool and TOC methodology for quick testing and prioritization of hypotheses
Looking at the goals and limitations that we face, we decided to use the HADI-cycles tool used by the IIDF Accelerator startups.
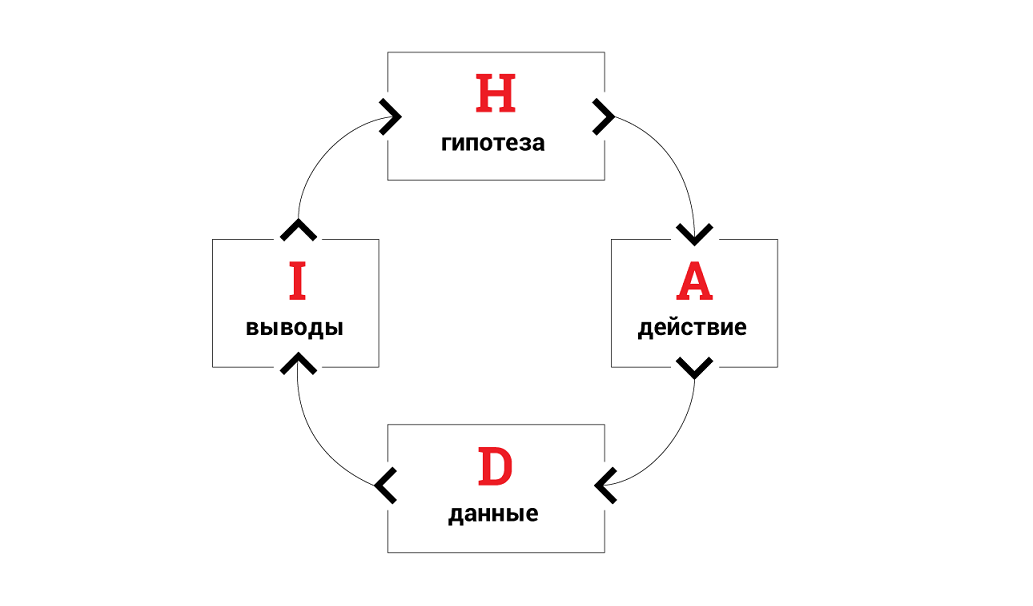
HADI cycles are a very simple hypothesis testing method that consists of 4 steps:
- Hypotheses ,
- Actions for its implementation,
- Collect data on the quality of work hypothesis
- Conclusions about the result of the hypothesis may include some of the following hypotheses.
The most important thing here is to test as many different hypotheses as possible as quickly as possible. Even if the hypothesis did not work - nothing terrible, it is important to quickly abandon it and start testing new ones.
The difficulty here is to determine which hypotheses should be tested first . To prioritize hypotheses, we decided to use the part of Goldratt's Theory of Constraints (TOC) associated with the definition of bottlenecks. To understand this methodology in Accelerator, startups are recommended to read Goldratt 's book “The Goal” .
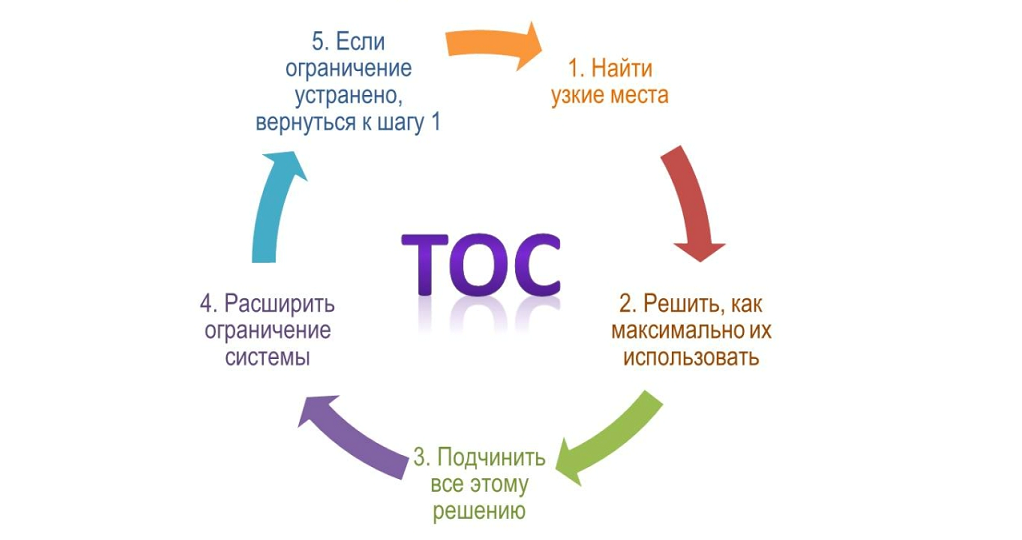
TOC is also a fairly simple methodology, in order to increase the system’s throughput (= increasing the effectiveness of a process) through it:
- Finding a “bottleneck” is a limitation of the system on which the production process (or some other) “gets stuck”, i.e. tasks pile up
- Decide how to maximize the “power” of this limit,
- To subordinate the system to this solution (= to make so that the “power” of the constraint does not idle),
- Extend the limit
- If the restriction is removed, return to step 1. If you need to expand it further - to step 4.
We used exactly these 2 methodologies, since HADI-cycles are ideally suited for rapid growth of indicators, and TOC helps to determine which particular hypothesis to test in the first place.
To begin with, we decided to define the limitations or “bottlenecks” of the system, for this we raised and analyzed all the statistics that were collected at that time (it turned out that we had limitations here too).


And immediately saw 2 "bottlenecks", where the conversion is cut off.
- Startups respond well to likes of candidates only for the first 5 days after the publication of a vacancy, and then they respond 2.5 times worse.
- Candidates open re-selection letters well (= similar jobs), but very rarely go into start-up profiles after viewing these letters.
Hypothesis 1. On the 1st issue, we decided to throw out from start-up those startups that do not meet the candidates for more than two weeks. We immediately wanted to make a beautiful decision, where we will be able to select a part of startups in a separate segment and automatically send them letters motivating them to return to the system. But our goal was to quickly test the hypothesis - and in the best traditions of MVP, we simply removed some of the projects from the selection. The implementation of the additional functionality was postponed until the moment when we already checked whether the hypothesis worked or not - whether the conversion to answers to candidates increased after our actions.
Hypothesis 2. On the 2nd problem, we did not know the reason and decided to force candidates to move from letter to system (where we can find out which startups he looked at, etc.) in order to collect more statistics. We removed the project descriptions from the letters and asked the user to go to the system to view them.
It was
It became

Thus, we obtained the first two hypotheses for verification.
Hypothesis 3. Also added the 3rd hypothesis - to remove the pre-moderation mechanism, this should have freed up the time of Julia, who was engaged in manual viewing of projects, and speeding up the hitting of vacancies in the selection. As a result, start-ups will not have to wait for verification, and the time from the moment a job is created to the start of recruitment will be reduced from 2-3 days to 4 hours.
While there was development on these three hypotheses, we had to come up with new ones - for continuous work on the product, so that development would not stand idle. At the same time, it is desirable that the new hypotheses do not overlap with the previous ones - they affect other metrics.
Hypothesis 4. We decided to do a “safe task” that cannot affect the metrics of previous hypotheses in any way - to expand the statistics with the expectation that it will allow us to test hypotheses faster and better in the future. We added to the analyst information about whether the candidate looked at the vacancy and when. Thus, we were able to split the conversion from selected vacancies into “likes” into two:
1) from selected - to viewed,
2) from viewed - in "likes".
This problem can hardly be called a hypothesis on HADI, but we needed it to construct the following hypotheses.
Hypothesis 5. Add motivation to startups to set the status that they work with the candidate. We decided to add a “bonus” to the letter after the interview: Start-ups that set the status in the profile that they work with the candidate will receive a free 3-week business development program. This should have increased the number of closed vacancies in the system - before that, it was necessary to call up start-ups additionally and set statuses manually.
Hypothesis 6. And we could not resist and added a hypothesis that also affects the speed of getting a startup: send candidates to the repeated selection of vacancies not 1 time per week, but 2. Thus, we wanted to increase the number of likes per week, as well as speed up the process.
Our first hypotheses showed a very good result, the improvements were even better than we expected. The number of likes per week increased by 45%, conversion to meetings - by 60%.
Prioritization of hypotheses using the "shoulder" of metrics
We tested quite a lot of hypotheses, and we needed a clearer and more reliable tool for prioritizing them - the obvious “bottlenecks” ended, which needed to be improved first of all, and a more systematic approach to defining “bottlenecks” and choosing hypotheses for testing was needed.
We remembered Accelerator’s main tool for prioritizing hypotheses - this is the calculation of unit-economy and the “leverage” of metrics. In order to determine which indicator is most effective to influence when testing hypotheses, based on current data, a change in the system indices is projected with an effect on each metric.
To do this, we built a “map of the possible future” - a table that predicts a change in the main parameter for us as each conversion of the candidate transitions in the funnel grows to the value we believe in.
We considered that the main parameter for us is the number of new candidates required for one vacancy closing, we calculated the service indicators at that time, built the formulas and obtained the following table:
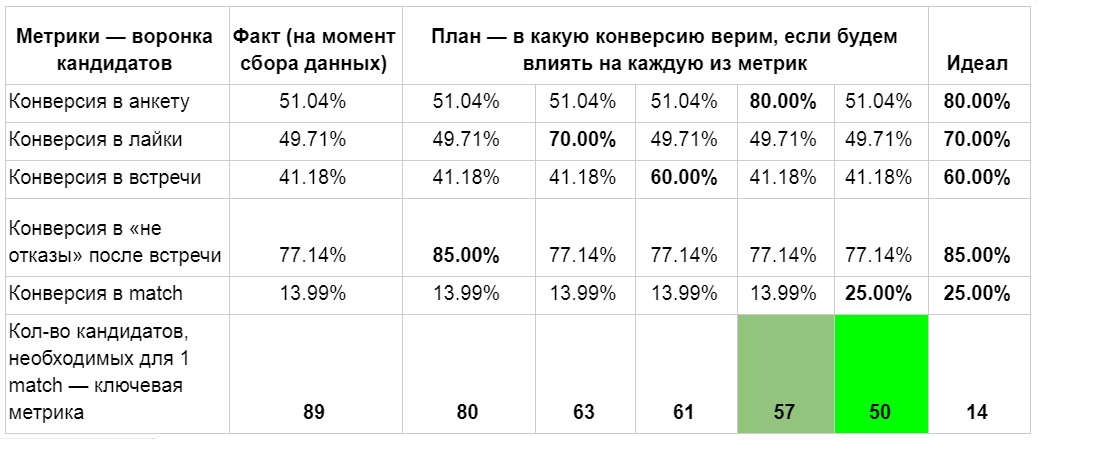
From the table, we saw that the most important indicators for us at that moment were the conversion to match (the closing of the vacancy) and the conversion to the questionnaire - they should bring the maximum effect. We started working on hypotheses affecting these parameters.
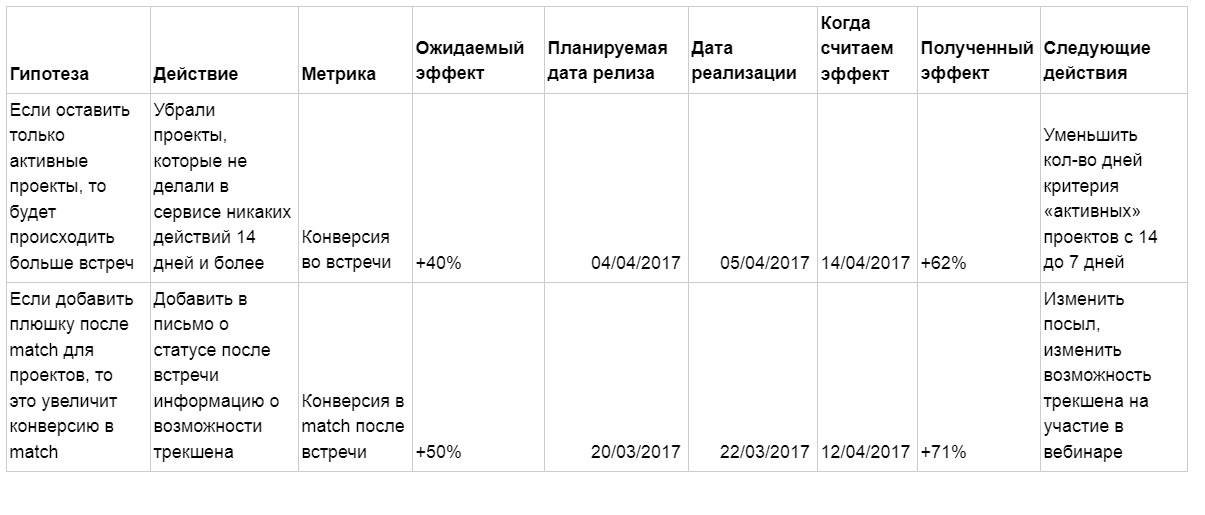
To test hypotheses on an ongoing basis, we had to come up with a convenient tool for their management. After several iterations, we came up with the following format:
- We describe the hypothesis that we want to test.
- Action - exactly how we want to check it.
- The metric we want to influence.
- The expected effect on the growth of this metric.
- The planned release date (in order not to test hypotheses that affect the same metric in parallel).
- The actual implementation date - start testing the hypothesis.
- The date when we calculate the effect (set on the basis of the required amount of data and the time for collecting them, is also needed in order not to test hypotheses that affect the same metric in parallel).
- The resulting effect (how the metric changed as a result).
- The following steps - here we write about what conclusions were drawn from the test of the hypothesis.
Result: sevenfold increase in the number of matches - a key indicator
As a result, for 3 months we tested 22 hypotheses (we could no longer manage it due to limitations in the development budget), which is a very good indicator.
4 of them were a real breakthrough, only 1 worsened the performance of the system, and the rest gave a relatively small increase. This allowed to improve the performance to:
And by July 1, we were able to prove the value of the service for the Fund and continue to develop it, greatly reducing the degree of stress and significantly reducing all restrictions. Deadline has stopped looming in front of us, with Yuli removed other tasks and agreed on a new development budget.
What we did wrong - conclusions
In the process of working on the project, we made 3 mistakes against which we want to warn other startups:
1. They did not want to abandon unconfirmed hypotheses.
We had a hypothesis that we loved very much.
Previously, a candidate attached his resume when filling out a questionnaire - and only then he could see startups with open vacancies.
We assumed that if you remove the step of attaching a resume from a questionnaire and request it from a candidate after he became interested in a startup, candidates will be more willing to attach a resume. But it turned out to be exactly the opposite: the conversion to the filling of the resume notably fell.
Nevertheless, the hypothesis was very dear to us, and we were not ready to give it up so easily. We began to dig into the data and convince ourselves that candidates began to leave better quality resumes. Finding the reasons why the fall in conversion is not critical for us here, to figure out how we can live with it.
All this was self-deception - in September we finally returned the summary back. We spent 3 months on this decision. 3 months, Karl! That is, our service worked worse for a quarter.
2. Did not decompose hypotheses
We had an assumption that warming up letters at different points in the life of a candidate and a startup in the service will help increase conversion at all stages. It really turned out to be true, but what was the mistake?
We actually tested several hypotheses within one. Every single letter is a hypothesis.
To start testing this hypothesis, we spent almost a month: a week with Julia we looked for time for a two-hour meeting, prepared TK and the letters themselves for 3-4 days, and for another week and a half the developers implemented the functionality of sending emails about the event.
If we tested each letter separately, we would be able to get the first result already 2 days after the hypothesis was formulated. And find out exactly which letter worked, which one did not, and why. Therefore, despite the fact that the hypothesis worked and showed a good gain of indicators, it can not be considered to be uniquely successful. If we approached the process a bit more carefully, we would probably get more growth and faster.
3. Tested related hypotheses that affect the same indicator.
We were sure that we are not doing this. When we added motivation with the help of a 3-week business development program, the conversion to vacancy closing increased dramatically. Then we methodically reduced the cost of motivation for us, until we removed it altogether. In this case, the conversion did not fall!
We carefully dismantled the statistics and found out that the hypothesis “Remove inactive startups from selection” affected the conversion to the closing of the vacancy (match) - there were more motivated teams, and they not only answered the candidates who liked them more often, but also displayed statuses after the meeting.
Summarizing:
- HADI-cycles - an effective tool for business development!
- Test hypotheses as quickly as possible; for prioritization, you can use the metric “shoulder” measurement tool.
- Do not make our mistakes:
a. Be decisive with unconfirmed hypotheses,
b. Decompose hypotheses
c. Do not test related hypotheses affecting one metric.
Source: https://habr.com/ru/post/338240/
All Articles