Optimize web servers for increased bandwidth and reduced latency
Hello! My name is Max Matiukhin, I work on the Badoo SRV team. We at Badoo not only actively write posts to our blog, but also carefully read the blogs of our colleagues from other companies. Recently, the guys from Dropbox have posted a smart post about various ways to optimize server applications: from hardware to the application level. Its author, Alexey Ivanov, gave a huge amount of advice and links to additional sources of information. Unfortunately, Dropbox does not have a blog on Habré, so I decided to translate this post for our readers.
This is an extended version of my speech at nginx.conf 2017 in September of this year. As a senior quality control engineer (SRE) on the Dropbox Traffic team, I am responsible for our Edge network: its reliability, performance, and efficiency. This is a proxy-tier-network built on the basis of nginx and intended both for processing delay-sensitive metadata and for transmitting high-bandwidth data. The system processing tens of gigabits per second and at the same time tens of thousands of transactions sensitive to delays uses various optimizations of efficiency and performance: starting with drivers and interrupts, through the core and TCP / IP stack, and ending with libraries and application-level settings.
Explanations
In this post we will look at numerous ways to configure web servers and proxies. Please do not engage in a cargo cult. Approach this from the standpoint of science, apply optimization one by one, measure the effect and decide whether they are really useful for your work.
This is not a Linux performance post (although I will often refer to bcc, eBPF, and perf) and not a comprehensive guide to using performance profiling tools (if you want to learn more about them, read the Brendan Gregg blog ).
This is also not a post about browser performance. I will mention client performance in terms of latency optimization, but very briefly. Want to find out more - read Ilya Grigorik's High Performance Browser Networking article.
And this is not a compilation of TLS best practices. Although I will mention the TLS libraries and their settings, you and your security team should independently evaluate their performance and the impact on security. To find out how your servers meet the best practices, you can use the Qualys SSL Test . If you want to learn more about TLS in general, subscribe to the Feisty Duck Bulletproof TLS Newsletter .
Post structure
We will look at performance / performance optimization at different levels of the system. Let's start with the lowest hardware-driver level: these settings can be applied to almost any high-loaded server. Then I will go to the Linux kernel and its TCP / IP stack: you can twist these handles on your mailboxes that actively use TCP. Finally, we will discuss settings at the level of libraries and applications, which for the most part are applicable to many web servers and in particular to nginx.
For each optimization area, I will try to clarify the tradeoffs regarding latency / throughput (if any), as well as give monitoring tips and suggestions for settings for different workload levels.
Equipment
CPU
For a good asymmetric RSA / EC performance, choose processors with at least AVX2 support ( avx2 in /proc/cpuinfo ) and preferably suitable for calculations with large integers ( bmi and adx ). For symmetric encryption, choose AES-NI for AES ciphers and AVX-512 for ChaCha + Poly. Intel has a comparison of the performance of different generations of processors with OpenSSL 1.0.2, where the impact of these hardware optimizations is considered.
For tasks where the delay level is important, like routing, it is recommended to reduce the number of NUMA nodes and disable Hyper-Threading. Tasks requiring high bandwidth are performed more efficiently with more cores using Hyper-Threading (unless there is no cache binding), and in general, NUMA does not play a special role for them.
If you choose among Intel products, then look at processors with Haswell / Broadwell architecture, and better Skylake. AMD has impressive performance with EPYC models.
LAN card
You need at least 10 Gbps, and better - 25 Gbps. If you want to transfer through one server with TLS even more, then the settings described here may not be enough - you may have to move TLS-framing to the kernel level ( FreeBSD , Linux ).
As for the software level, look for open-source-drivers with active mailing lists and communities. This will be a very important factor if (rather “when”) you will be engaged in solving problems related to drivers.
Memory
Rule of thumb: latency-sensitive tasks require faster memory; bandwidth sensitive tasks require more memory.
Discs
It all depends on your buffering / caching requirements. If you need to buffer or cache a lot, then it is better to choose SSD-drives. Some even install sharpened flash filesystems (usually log-structured), but they do not always show better performance than regular ext4 / xfs.
In any case, do not ruin your flash drives, forgetting to enable TRIM or update the firmware.
Operating systems: low
Firmware
Use fresh firmware to avoid long and painful detection of failures. Try to keep current firmware for the processor, motherboard, network cards and SSD drives. This does not mean that you should always use the latest versions - it is recommended to take the penultimate ones, if they do not contain critical bugs that have been fixed in the latest versions.
Drivers
Here you can give the same advice as for the firmware: if possible, use the latest versions, but not the latest. Try to share kernel upgrades and driver updates. For example, you can package the drivers with DKMS or precompile them for all kernel versions you use. Because of this, if something goes wrong after updating the kernel, you will quickly understand what the problem is.
CPU
Your best friend is the kernel repository (and the tools that come with it). In Ubuntu / Debian, you can install the linux-tools package with a set of utilities, but in this post we will only use cpupower , turbostat and x86_energy_perf_policy . To check processor-related optimizations, you can conduct stress testing of your software using your favorite load generator (for example, Yandex.Tank ). Here is a presentation on best load testing techniques from nginx developers: NGINX Performance testing .
cpupower
$ cpupower frequency-info ... driver: intel_pstate ... available cpufreq governors: performance powersave ... The governor "performance" may decide which speed to use ... boost state support: Supported: yes Active: yes Check if Turbo Boost is turned on, and if you have an Intel processor, make sure that the system works with intel_pstate , and not with acpi-cpufreq or pcc-cpufreq . If you are still using acpi-cpufreq, upgrade your kernel. If this is not possible, use the performance mode. When working with intel_pstate even the powersave mode should be executed with good performance, but you will have to check it yourself.
As for idle time, to see what is really happening with your processor, you can use turbostat to look directly at MSR processor and extract information about power, frequency and so-called Idle States :
# turbostat --debug -P ... Avg_MHz Busy% ... CPU%c1 CPU%c3 CPU%c6 ... Pkg%pc2 Pkg%pc3 Pkg%pc6 ... Here you can see the real frequency of the processor (yes, /proc/cpuinfo is lying to you), as well as the current state of the core / set of cores .
If even with the intel_pstate driver intel_pstate processor spends more time on idle time than you thought, you can:
- switch the controller to performance;
- For better performance, configure
x86_energy_perf_policy.
And for very sensitive tasks, you can:
- use the
/dev/cpu_dma_latency; - for UDP traffic use busy-polling .
Learn more about processor power management in general, and P-states in particular, from the presentation of Balancing Power and Performance in the Linux Kernel with LinuxCon Europe 2015.
Binding to the processor
You can further reduce latency by tying a thread or process to a CPU. For example, in nginx there is a directive worker_cpu_affinity , which automatically binds each process of a web server to a specific kernel. This eliminates the process / thread migration to another kernel, reduces the number of cache misses and errors of memory pages, and also slightly increases the number of instructions in the loop. All this can be checked through perf stat .
But the processor binding has a negative effect on performance, since the processes have to wait longer for the processor to be released. This can be monitored by running the runqlat on one of your nginx worker's PIDs:
usecs : count distribution 0 -> 1 : 819 | | 2 -> 3 : 58888 |****************************** | 4 -> 7 : 77984 |****************************************| 8 -> 15 : 10529 |***** | 16 -> 31 : 4853 |** | ... 4096 -> 8191 : 34 | | 8192 -> 16383 : 39 | | 16384 -> 32767 : 17 | | If you notice long tails for many milliseconds, then the servers are probably running too much, besides nginx, and the binding will increase the delay, rather than reduce it.
Memory
All Memory Management settings are usually highly dependent on the workflow, so I can only give such recommendations:
- set up the Transparent Huge Pages to
madviseand turn them on only when you are sure of their benefits , otherwise you can slow down the work greatly , aiming for a 20% reduction in latency; - if you use only one NUMA node, then set
vm.zone_reclaim_mode 0.
Modern processors are several separate processors that are connected by a very fast bus and share various resources, starting with the L1 cache on the HT cores and ending with the L3 cache as applied to packets, memory, and PCIe connections within sockets. This is NUMA: numerous execution and storage modules with a fast data bus.
A comprehensive description of NUMA and its application is contained in the Frank Denneman article NUMA Deep Dive Series .
In short, you can:
- ignore it by turning it off in the BIOS or executing its software under
numactl --interleave=all(so you will get mediocre, but fairly stable performance); - opt out of it using single-node servers, as Facebook does with the OCP Yosemite platform ;
- accept it by optimizing the placement of the processor / memory in the kernel and user spaces.
Let's consider the third option, since the other two do not need much optimization.
To use NUMA correctly, you need to treat each of its nodes as a separate server. Verify topology with numactl --hardware :
$ numactl --hardware available: 4 nodes (0-3) node 0 cpus: 0 1 2 3 16 17 18 19 node 0 size: 32149 MB node 1 cpus: 4 5 6 7 20 21 22 23 node 1 size: 32213 MB node 2 cpus: 8 9 10 11 24 25 26 27 node 2 size: 0 MB node 3 cpus: 12 13 14 15 28 29 30 31 node 3 size: 0 MB node distances: node 0 1 2 3 0: 10 16 16 16 1: 16 10 16 16 2: 16 16 10 16 3: 16 16 16 10 What you need to check:
- the number of nodes;
- the amount of memory for each node;
- the number of processors for each node;
- distance between nodes.
This is a very bad example, because there are four nodes, and memory-free nodes are also attached. Here you cannot use each node as a separate server without losing half of the cores.
You can check this with numastat :
$ numastat -n -c Node 0 Node 1 Node 2 Node 3 Total -------- -------- ------ ------ -------- Numa_Hit 26833500 11885723 0 0 38719223 Numa_Miss 18672 8561876 0 0 8580548 Numa_Foreign 8561876 18672 0 0 8580548 Interleave_Hit 392066 553771 0 0 945836 Local_Node 8222745 11507968 0 0 19730712 Other_Node 18629427 8939632 0 0 27569060 Also, using numastat you can get memory usage statistics for each node in the /proc/meminfo :
$ numastat -m -c Node 0 Node 1 Node 2 Node 3 Total ------ ------ ------ ------ ----- MemTotal 32150 32214 0 0 64363 MemFree 462 5793 0 0 6255 MemUsed 31688 26421 0 0 58109 Active 16021 8588 0 0 24608 Inactive 13436 16121 0 0 29557 Active(anon) 1193 970 0 0 2163 Inactive(anon) 121 108 0 0 229 Active(file) 14828 7618 0 0 22446 Inactive(file) 13315 16013 0 0 29327 ... FilePages 28498 23957 0 0 52454 Mapped 131 130 0 0 261 AnonPages 962 757 0 0 1718 Shmem 355 323 0 0 678 KernelStack 10 5 0 0 16 Now consider an example of a simpler topology.
$ numactl --hardware available: 2 nodes (0-1) node 0 cpus: 0 1 2 3 4 5 6 7 16 17 18 19 20 21 22 23 node 0 size: 46967 MB node 1 cpus: 8 9 10 11 12 13 14 15 24 25 26 27 28 29 30 31 node 1 size: 48355 MB Since the nodes are mostly symmetric, we can bind an instance of our application to each NUMA node using numactl --cpunodebind=X --membind=X , and then open it on a different port. Throughput is increased by using both nodes and reducing latency by preserving the locality of the memory.
You can check the effectiveness of NUMA placement by delaying operations in memory. For example, using funclatency in BCC, measure the delay of an operation actively using memory, say, memmove.
You can monitor the performance on the kernel side using perf stat , keeping track of the corresponding memory and scheduler events:
# perf stat -e sched:sched_stick_numa,sched:sched_move_numa,sched:sched_swap_numa,migrate:mm_migrate_pages,minor-faults -p PID ... 1 sched:sched_stick_numa 3 sched:sched_move_numa 41 sched:sched_swap_numa 5,239 migrate:mm_migrate_pages 50,161 minor-faults The latest portion of NUMA-related optimizations for network loads with active network utilization is dictated by the fact that the network card is a PCIe device, and each device is tied to its own NUMA node; therefore, some processors will have less delay when accessing the network. We will discuss possible optimizations in the chapter where the binding of a network card → processor will be considered, but for now let's move on to PCI Express.
PCIe
There is usually no need to delve into solving problems with PCIe , unless some kind of hardware failure occurs. However, it is worthwhile to at least create “bus width”, “bus speed” and warnings RxErr/BadTLP for your PCIe devices. This should save you hours of debugging from damaged hardware or faulty PCIe matching. You can use lspci for this:
# lspci -s 0a:00.0 -vvv ... LnkCap: Port #0, Speed 8GT/s, Width x8, ASPM L1, Exit Latency L0s <2us, L1 <16us LnkSta: Speed 8GT/s, Width x8, TrErr- Train- SlotClk+ DLActive- BWMgmt- ABWMgmt- ... Capabilities: [100 v2] Advanced Error Reporting UESta: DLP- SDES- TLP- FCP- CmpltTO- CmpltAbrt- ... UEMsk: DLP- SDES- TLP- FCP- CmpltTO- CmpltAbrt- ... UESvrt: DLP+ SDES+ TLP- FCP+ CmpltTO- CmpltAbrt- ... CESta: RxErr- BadTLP- BadDLLP- Rollover- Timeout- NonFatalErr- CEMsk: RxErr- BadTLP- BadDLLP- Rollover- Timeout- NonFatalErr+ PCIe can become a bottleneck if you have multiple high-speed devices competing for channel width (for example, when combining a fast network with fast storage), so you may need to physically shard your PCIe devices among processors to get maximum throughput.

I also advise you to read the article Understanding PCIe Configuration for Maximum Performance , it discusses the PCIe configuration in more detail, which can be useful at high speeds when packet loss occurs between the card and the OS.
Intel suggests that sometimes PCIe power management (ASPM) can lead to high latency and, therefore, more packet loss. You can disable this feature by typing pcie_aspm=off on the kernel command line.
LAN card
Before we begin, it is worth mentioning that Intel and Mellanox offer their own performance tuning guides, and regardless of the vendor you choose, you should read both materials. In addition, drivers usually come with their own README and sets of useful utilities.
You can also search for manuals for your OS. For example, the Red Hat Enterprise Linux Network Performance Tuning Guide explains many of the optimizations mentioned above. Cloudflare also has a good article about setting up this part of the network stack , although for the most part it is about situations where you need low latency.
During optimization, your best friend will be ethtool.
Note: if you use a fairly fresh kernel (and you should do it!), Then you will also encounter some aspects of your user space. For example, for network operations, you probably want to use more recent versions of the ethtool packages, iproute2 and perhaps iptables/nftables .
You can get valuable information about what is happening with your network card using ethtool -S :
$ ethtool -S eth0 | egrep 'miss|over|drop|lost|fifo' rx_dropped: 0 tx_dropped: 0 port.rx_dropped: 0 port.tx_dropped_link_down: 0 port.rx_oversize: 0 port.arq_overflows: 0 Consult your network card manufacturer for detailed statistics. For example, Mellanox has a separate Wiki article about it .
As for the kernel, you need to watch /proc/interrupts , /proc/softirqs and /proc/net/softnet_stat . There are two useful BCC tools here: hardirqs and softirqs . The goal of your network optimization is to configure the system so that the processor is used to a minimum and packets are not lost.
Interrupt Binding
Usually the settings here begin with the distribution of interrupts across processors. How exactly this is done depends on your workload:
- for maximum throughput, you can distribute interrupts across all NUMA nodes;
- To minimize latency, you can limit interrupts to one NUMA node (to do this, you may need to reduce the number of queues in order not to exceed the capabilities of one node (usually you have to halve it with
ethtool -L).
As a rule, vendors provide scripts for this. For example, in Intel it is set_irq_affinity .
Ring Buffer Size
Network cards need to exchange information with the kernel. This is usually done through a data structure called a “ring”. The current / maximum size of this ring can be viewed using ethtool -g :
$ ethtool -g eth0 Ring parameters for eth0: Pre-set maximums: RX: 4096 TX: 4096 Current hardware settings: RX: 4096 TX: 4096 With -G you can customize values within predefined extremes. Usually, the more, the better (especially if you use interrupt unions), because it gives you better protection from peaks and some problems in the core, which means it reduces the number of dropped packets due to lack of buffer space or missed interrupts. But there are a couple of cautions:
in older kernels or drivers without BQL support , high values may refer to a higher bufferbloat on the TX side;
- Larger buffers increase cache pressure , so if you run into this, try reducing buffers.
Interrupt association
This mechanism ensures that the kernel notifies new events by merging several messages into one interrupt. The current settings can be viewed using ethtool -c :
$ ethtool -c eth0 Coalesce parameters for eth0: ... rx-usecs: 50 tx-usecs: 50 Also, you can stick to static limits (static limits), severely limiting the maximum number of interrupts per second per core, or rely on automatic hardware-controlled interrupt frequency depending on bandwidth.
Enabling merge ( -C ) will increase latency and is likely to result in packet loss, so this feature is not recommended for delays sensitive tasks. But on the other hand, its complete shutdown can lead to throttling of interruptions, and, consequently, a performance limitation.
Unloading
Modern network cards are quite smart and can unload a large part of the work with iron or emulate the unloading in the drivers themselves.
All possible downloads can be viewed using ethtool -k :
$ ethtool -k eth0 Features for eth0: ... tcp-segmentation-offload: on generic-segmentation-offload: on generic-receive-offload: on large-receive-offload: off [fixed] All non-configurable offloads are marked with the [fixed] suffix. You can talk about them for a long time , but I will only give a few rules of thumb:
- do not enable LRO — use GRO instead;
- be careful with TSO, as it depends a lot on the quality of your drivers / firmware;
- Do not enable TSO / GSO on older kernels, because this can lead to excessive bufferbloat.
Packet handling
All modern network cards are optimized for multiprocessor systems, so they distribute packets in virtual queues (usually one per processor). When this is done hardware, it is called RSS; when the OS is responsible for balancing packets between processors, it is called RPS (TX-equivalent is called XPS). If the OS tries to regulate threads to the processors that are currently handling this socket, this is called RFS. And when iron does it, it's called “accelerated RFS” or aRFS.
Here are some good techniques:
- if you use 25 Gbit + hardware, then there are probably enough queues and a huge indirection table to use RSS between all cores (some older cards can only use the first 16 processors);
- You can try enabling RPS if:
1) you have more processors than hardware queues, and you want to sacrifice latency in favor of bandwidth;
2) you use internal tunneling (for example, GRE / IPinIP), in which the network card cannot use RSS;
- Do not enable RPS if you have an old enough processor that does not have x2APIC;
- Binding each processor to its own TX queue via XPS is generally a good idea;
- The effectiveness of RFS depends a lot on your workload, and also on whether you apply a processor reference.
Flow Director and ATR
The included Flow Director (or fdir in Intel terminology) by default operates in the Application Targeting Routing mode , which implements aRFS by sampling packets and adjusting the flows to the processor core, where they appear to be processed. Statistics can be viewed using ethtool -S:$ ethtool -S eth0 | egrep 'fdir' port.fdir_flush_cnt: 0 … ethtool -S:$ ethtool -S eth0 | egrep 'fdir' port.fdir_flush_cnt: 0 …
Intel , fdir , , 1% , TCP. , Flow Director , TCPOFOQueue .
:
, Linux, «- sysctl.conf». , , TCP/ IP- , sysctls.conf , 2.6.18/ 2.6.32.
:
/proc/net/snmp and /proc/net/netstatTCP- ;- ,
ss -n --extended --infogetsockopt(``[TCP_INFO]``)/getsockopt(``[TCP_CC_INFO]``); - tcptrace(1) ` TCP-;
- RUM- / .
CDN, , , , . , Fastly on LinuxCon Australia . , Linux, , NetDevConf Netconf .
PackageCloud Linux, , , «» :
- Monitoring and Tuning the Linux Networking Stack: Receiving Data ;
- Monitoring and Tuning the Linux Networking Stack: Sending Data .
: ! , IW10 ( 2010 ) – , TSO, FQ, pacing, TLP RACK. , , , , SO_REUSEPORT .
Overview
Linux Making Linux TCP Fast . . TCP- :

Fair queueing pacing
Fair queueing «» TCP-, . Pacing, , , Congestion Control, , .
, fair queueing pacing Linux fq qdisc . BBR ( , ), CUBIC, 15–20%- , , ( loss-based CCs ). (<3.19), ACKs / RPCs.
TSO TSQ
TCP-, , .
CC- – , . - : tcp_cdg ( CAIA ), tcp_nv (Facebook) tcp_bbr (Google). , , (delay), .
BBR – , . , RTT . , -.
BBR Edge PoP :

TCP BBR Tokyo PoP: x — , y —
. — p90+ ( -), , . FQ/ pacing , , , , « TCP».
BBR, APNIC ( loss-based- ). bbr-dev ( ). , Internet Congestion Control Research Group .
ACK-
(loss detection). . TCP TLP RACK , ( FACK ER) . , .
HOL
API (userspace socket API) , . (, HTTP/2) Head-of-Line h2-. sysctl net.ipv4.tcp_notsent_lowat . , ( epoll ). HTTP/2-, , .
Sysctls
, sysctls. , :
net.ipv4.tcp_tw_recycle=1: — NAT , , ;net.ipv4.tcp_timestamps=0: , . , , SACK- syncookie .
:
net.ipv4.tcp_slow_start_after_idle=0: (slow start) , «» RTO, ;net.ipv4.tcp_mtu_probing=1: ICMP-« » ( );net.ipv4.tcp_rmem, net.ipv4.tcp_wmem: , BDP; , – ;echo 2 > /sys/module/tcp_cubic/parameters/hystart_detect: FQ+CUBIC, tcp_cubic .
, RFC- ( ) , curl, TCP Tuning for HTTP , , HTTP.
:
Tools
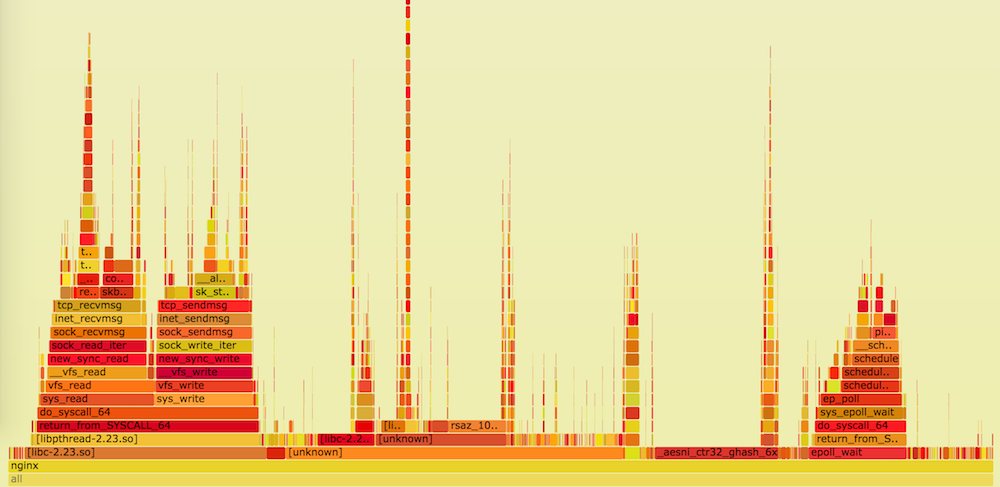
, . , , perf , bcc .
. perf top , on-CPU flame- ad hoc- funclatency bcc .
- , , , -.
, (, -fstack-protector-strong SafeStack ). , , (, AddressSanitizer ).
glibc, -lc , -lm , -lrt . : , .
zlib
-. , , zlib perf top , :
# perf top ... 8.88% nginx [.] longest_match 8.29% nginx [.] deflate_slow 1.90% nginx [.] compress_block : Intel Cloudflare , zlib-ng , zlib-, .
malloc
. . Lua FFI , , - . jemalloc tcmalloc .
malloc :
nginx Lua, perf top PCRE . , PCRE JIT , nginx pcre_jit on; .
flame- funclatency :
# funclatency /srv/nginx-bazel/sbin/nginx:ngx_http_regex_exec -u ... usecs : count distribution 0 -> 1 : 1159 |********** | 2 -> 3 : 4468 |****************************************| 4 -> 7 : 622 |***** | 8 -> 15 : 610 |***** | 16 -> 31 : 209 |* | 32 -> 63 : 91 | | TLS
TLS CDN, TLS- . .
, , — TLS- : Vanilla OpenSSL , OpenBSD's LibreSSL BoringSSL Google. , : , OpenSSL , ; BoringSSL , . , - : TLS- , AES-NI SSE ADX AVX-512. . , BoringSSL bssl speed .
, , , . , - — . , , Mozilla SSL Configuration Generator .
“front”- ( ), TLS-«», , , .
ECDSA , , RSA. , «» . ECDSA , OpenSSL, , ( BoringSSL ).
, – , 4096 RSA :
$ bssl speed Did 1517 RSA 2048 signing ... (1507.3 ops/sec) Did 160 RSA 4096 signing ... (153.4 ops/sec) : p-224 ECDSA 60%- p-256:
$ bssl speed Did 7056 ECDSA P-224 signing ... (6831.1 ops/sec) Did 17000 ECDSA P-256 signing ... (16885.3 ops/sec) : .
OpenTLS, RSA, perf top : , AVX2, ADX (, Haswell), AVX2:
6.42% nginx [.] rsaz_1024_sqr_avx2 1.61% nginx [.] rsaz_1024_mul_avx2 ADX:
7.08% nginx [.] sqrx8x_internal 2.30% nginx [.] mulx4x_internal , , . , AES-NI AES-GCM. perf top :
8.47% nginx [.] aesni_ctr32_ghash_6x / , , . , , , , ChaCha20-Poly1305 . TTLB .
BoringSSL ChaCha20-Poly1305 , OpenSSL 1.0.2 Cloudflare . BoringSSL « » , , , , ( cloudflare/sslconfig ):
ssl_ciphers '[ECDHE-ECDSA-AES128-GCM-SHA256|ECDHE-ECDSA-CHACHA20-POLY1305|ECDHE-RSA-AES128-GCM-SHA256|ECDHE-RSA-CHACHA20-POLY1305]:ECDHE+AES128:RSA+AES128:ECDHE+AES256:RSA+AES256:ECDHE+3DES:RSA+3DES'; ssl_prefer_server_ciphers on; :
RUM-. API Navigation Timing Resource Timing . — TTFB TTV/ TTI. , , .
Compression
nginx mime.types, MIME-. , , , , gzip_types . , mime.type s compressible == true to gzip_types mime-db .
gzip, :
- (
gzip_buffers); - TTFB (
gzip_no_buffer).
, HTTP- gzip: nginx ngx_brotli , 30% , gzip .
, : .
, . gzip brotli Deploying Brotli for static content .
: + + . , TTFB.
-, . - nginx , . proxy_request_buffering proxy_buffering . , client_body_buffer_size proxy_buffers , / . , proxy_max_temp_file_size 0.
:
- / — , . , . , , . , , / (, SSD, );
- . , , . , - ( Slow POST/ Slow Read );
X-Accel-Buffering.
, TTFB TTLB. , / , .
TLS
TLS , nginx. , , Optimizing for TLS High Performance Browser Networking Making HTTPS Fast(er) nginx.conf 2014. , , -, , , Mozilla's Server Side TLS Guide / , .
:
DBA, « – , ». TLS: RTT, «». :
- ( ) «» ( ). nginx
ssl_session_tickets. , :
1) , / TLS-. , : 1) -; 2) - ;
2) PFS , TLS--, -, ;
3) -. AES-256, 128- -. Nginx 128- 256- ;
4) - ( );
- TLS- (ID). ssl_session_cache. , PFS , . - :
1) ~256 , ;
2) . , , , TLS- - ngx_http_lua_module .
, , . For example:
ssl_session_tickets on; ssl_session_timeout 1h; ssl_session_ticket_key /run/nginx-ephemeral/nginx_session_ticket_curr; ssl_session_ticket_key /run/nginx-ephemeral/nginx_session_ticket_prev; ssl_session_ticket_key /run/nginx-ephemeral/nginx_session_ticket_next; , , .
«» OCSP
«» OCSP-, :
- TLS-«» , OCSP;
- OCSP ;
- , , , .
«» OCSP- , - ssl_stapling_file :
ssl_stapling_file /var/cache/nginx/ocsp/www.der; TLS-
TLS (), , . TTFB .
nginx 16- , IW10, roundtrip. nginx ssl_buffer_size :
- , , 4 ( );
- 16 .
:
- ;
ssl_buffer_sizenginx, , , , , .
— . nginx Cloudflare, . , , , .
TLS 1.3
TLS 1.3 , TLS , , :
- ;
- «» 0-RTT , , ;
- (, DPI ), TLS.
nginx — - . , - . , , , nginx , .
. , , , .
, nginx ngx_process_events_and_timers , – , eventloop stall .
# funclatency '/srv/nginx-bazel/sbin/nginx:ngx_process_events_and_timers' -m msecs : count distribution 0 -> 1 : 3799 |****************************************| 2 -> 3 : 0 | | 4 -> 7 : 0 | | 8 -> 15 : 0 | | 16 -> 31 : 409 |**** | 32 -> 63 : 313 |*** | 64 -> 127 : 128 |* | AIO
eventloop stall , , / , . / fileslower :
# fileslower 10 Tracing sync read/writes slower than 10 ms TIME(s) COMM TID D BYTES LAT(ms) FILENAME 2.642 nginx 69097 R 5242880 12.18 0002121812 4.760 nginx 69754 W 8192 42.08 0002121598 4.760 nginx 69435 W 2852 42.39 0002121845 4.760 nginx 69088 W 2852 41.83 0002121854 nginx / ( AIO, AIO Unix , , , ). :
aio threads; aio_write on; thread_pool, , , , , . nginx-, D, . eventloop stall , / .
Journaling
, . , , , ext4slower / :
# ext4slower 10 TIME COMM PID T BYTES OFF_KB LAT(ms) FILENAME 06:26:03 nginx 69094 W 163070 634126 18.78 access.log 06:26:08 nginx 69094 W 151 126029 37.35 error.log 06:26:13 nginx 69082 W 153168 638728 159.96 access.log buffer access_log, . gzip , / .
/ , syslog . nginx.
open(2) , - / / , . , ngx_open_cached_file :
# funclatency /srv/nginx-bazel/sbin/nginx:ngx_open_cached_file -u usecs : count distribution 0 -> 1 : 10219 |****************************************| 2 -> 3 : 21 | | 4 -> 7 : 3 | | 8 -> 15 : 1 | | , , :
open_file_cache max=10000; open_file_cache_min_uses 2; open_file_cache_errors on; open_file_cache opensnoop , , , :
# opensnoop -n nginx PID COMM FD ERR PATH 69435 nginx 311 0 /srv/site/assets/serviceworker.js 69086 nginx 158 0 /srv/site/error/404.html ... Final word
')
Source: https://habr.com/ru/post/338226/
All Articles