Amazingly useful tool: lsof
I used to look for problems in the code or in the system, using logs or monitoring indicators that are displayed on nice control panels with a simple and intuitive interface. However, if for some reason the data on the control panel is not received, or the logs of some services are not available, debugging becomes more complicated. Now there are few such problems, they are rare, but they still happen. Therefore, even in our time, knowledge of tools that help to understand what is wrong with a certain process on any computer is very valuable.

When I debug something for which there are no logs or monitoring indicators, I connect to the remote computer via ssh. Of course, this approach is limited, it is not so simple, it does not correspond to the fashionable trends of DevOps, or to all those modern things that can be read on the Internet, but it is surprisingly well suited for me to quickly analyze the situation.
This is actually similar to using the
')
Sometimes I have to deploy the code I wrote and debug it when something goes wrong. Almost always, when I find myself in a new system for myself, the most difficult for me is the search for something . For example, find out which port is listening on the process. Or, more often, it is required to find out in which file a certain demon writes logs. And even if I manage to find answers to these questions, using a bunch of calls to the
If what you are reading now would be a speech by Raymond Goettinger, the lead developer of CPython, there would come a moment when the audience is waiting for the phrase: “there must be a better way.”
And, in fact, there is such a way. The tool that I constantly use to search the system for what I need has become a great tool called
The
The
A veteran of SRE, who dealt with this matter decades before the term “SRE” appeared, once told me: “I stopped learning the lsof options as soon as I learned all the ones I need. Learn the most important things, and that will be all you will ever need. ”
The
If you want to study them all - man will help you. Here I would like to talk about those that I usually use.
The
Usually, if before the parameter of some option put a “^” (cover), which means denial, this leads to the exclusion of files corresponding to this parameter from the program output. Here, for example, how you can find out the number of files on a computer that are open to all users with the exception of
The
The
Here is another interesting example. For example, there are a number of Python 2.7 and Python 3.6 processes, and you need to find out which files are open by processes that are not Python 2.7 processes. You can do it like this:
The
Perhaps the
I can not remember when I would not use the option
For example, here’s how Ubuntu looks like displaying information about all files opened by a process, say, with PID 1.
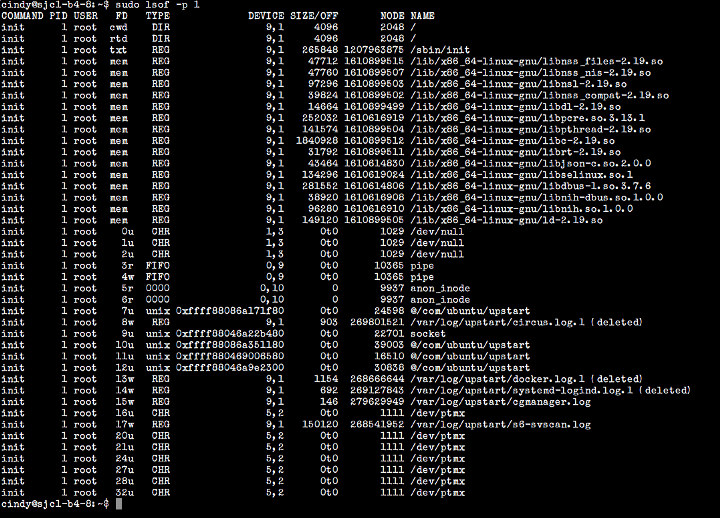
Output from the lsof command invoked with the -p option in Ubuntu
This is what is displayed on my MacBook Air.
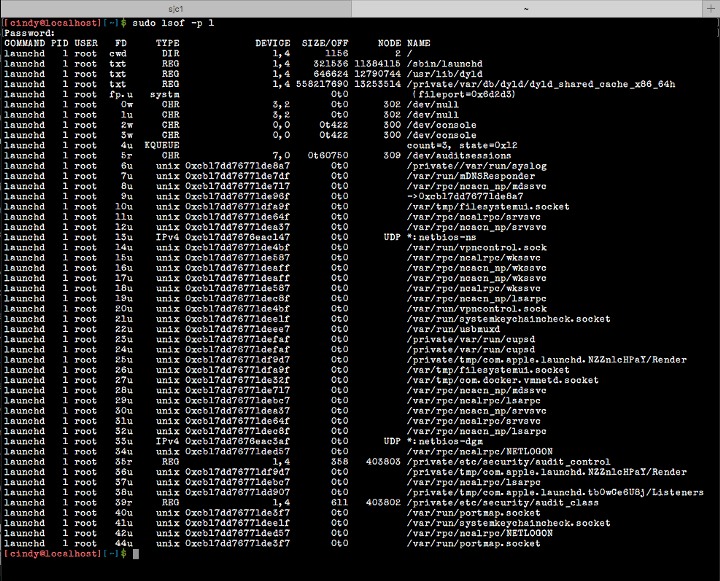
Output from the lsof command invoked with the -p option on a MacBook Air
The
This option can be used with another option -
Suppressing both of the above transformations can sometimes speed up
The
With

Displaying information about connections that Slack has opened
And with
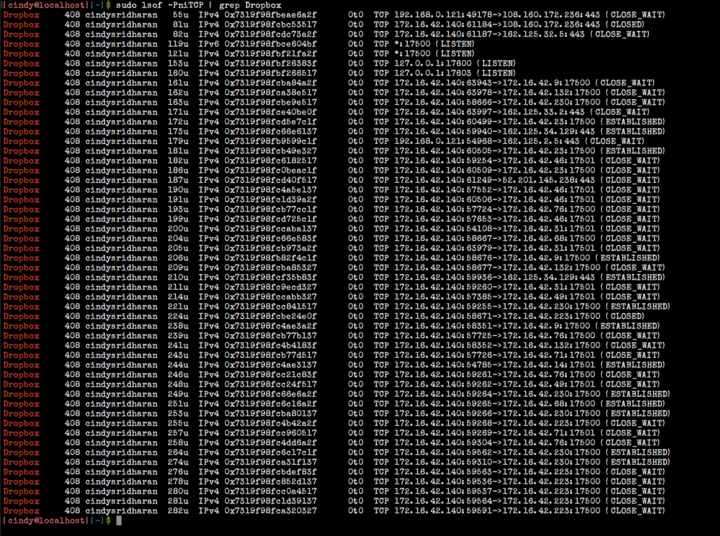
Displaying the connections that Dropbox has opened
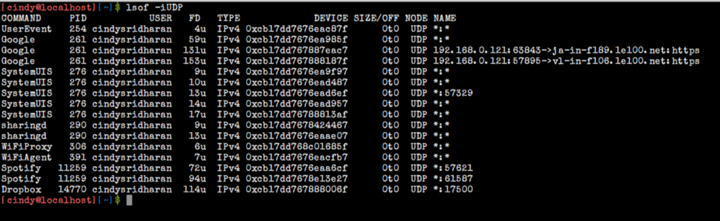
Displaying UDP connections
Using the
Displaying IPv6 Connections
The
Usually
Of course, there are several exceptions to this rule, here, as usual, it is recommended to look at the documentation, but if in a nutshell, it works like this:
Perhaps I'm exaggerating a little here, the “victory” was not so big, but when something happened that was going on,
A couple of weeks ago, I had to pick up one copy of a new service in a test environment. The test service in question was not connected to the working monitoring infrastructure. I tried to find out why the process that had just been launched did not register itself with Consul, and as a result, other services could not detect it. “So, I don't know what's the matter, but I'll take a look at the logs,” I thought. If something does not work as expected, I look at the logs of the service I am trying to work on, and in most cases the logs immediately indicate the root of the problem.
The service in question was launched using the process manager and circus sockets. Logs for processes running under
Since I knew that the process that I was trying to deal with was working under
One of the ways to understand which file was really used by the process of interest to me for logging was to use the
Viewing another file immediately made it possible to find out why the process failed (while
The more often I use the
Dear readers! What are some of the most common Linux command-line tools that you use?
When I debug something for which there are no logs or monitoring indicators, I connect to the remote computer via ssh. Of course, this approach is limited, it is not so simple, it does not correspond to the fashionable trends of DevOps, or to all those modern things that can be read on the Internet, but it is surprisingly well suited for me to quickly analyze the situation.
This is actually similar to using the
print command when debugging programs. Here I would immediately like to clarify that I am not a SRE and not an operating engineer in the field of IT. My main area of activity is development.')
Sometimes I have to deploy the code I wrote and debug it when something goes wrong. Almost always, when I find myself in a new system for myself, the most difficult for me is the search for something . For example, find out which port is listening on the process. Or, more often, it is required to find out in which file a certain demon writes logs. And even if I manage to find answers to these questions, using a bunch of calls to the
ps , pstree and ls , and a great many calls to the grep , often the “answers” that I find either do not contain anything useful or turn out to be incorrect.If what you are reading now would be a speech by Raymond Goettinger, the lead developer of CPython, there would come a moment when the audience is waiting for the phrase: “there must be a better way.”
And, in fact, there is such a way. The tool that I constantly use to search the system for what I need has become a great tool called
lsof .The
lsof utility (its name sounds like el-soff, although some people prefer something like liss-off or even el-es-o-eff) is an incredibly useful command that lists a list of all open files (LiSts all Open Files).The
lsof especially good for finding something, since on Unix-like systems everything is a file. This is a surprisingly universal debugging tool that can quite easily replace the ps , netstat utilities, and some others as well.Lsof options
A veteran of SRE, who dealt with this matter decades before the term “SRE” appeared, once told me: “I stopped learning the lsof options as soon as I learned all the ones I need. Learn the most important things, and that will be all you will ever need. ”
The
lsof utility has an extensive range of options. NAME lsof - list open files SYNOPSIS lsof [ -?abChKlnNOPRtUvVX ] [ -AA ] [ -cc ] [ +cc ] [ +|-dd ] [+|-DD ] [ +|-es ] [ +|-f [cfgGn] ] [ -F [f] ] [ -g [s] ] [ -i [i] ] [-k k ] [ +|-L [l] ] [ +|-mm ] [ +|-M ] [ -o [o] ] [ -ps ] [ +|-r[t[m<fmt>]] ] [ -s [p:s] ] [ -S [t] ] [ -T [t] ] [ -us ] [ +|-w ] [ -x[fl] ] [ -z [z] ] [ -Z [Z] ] [ -- ] [names] If you want to study them all - man will help you. Here I would like to talk about those that I usually use.
▍ -u option
The
-u option displays a list of files opened by a specific user. The following example shows how you can find out how many files the user cindy keeps open. cindy@ubuntu:~$ lsof -u cindy | wc -l 248 Usually, if before the parameter of some option put a “^” (cover), which means denial, this leads to the exclusion of files corresponding to this parameter from the program output. Here, for example, how you can find out the number of files on a computer that are open to all users with the exception of
cindy . cindy@ubuntu:~$ lsof -u^cindy | wc -l 38193 --U option
The
-U option -U all Unix domain socket files. cindy@ubuntu:~$ lsof -U | head -5 COMMAND PID USER FD TYPE DEVICE SIZE/OFF NODE NAME init 1 root 7u unix 0xffff88086a171f80 0t0 24598 @/com/ubuntu/upstart init 1 root 9u unix 0xffff88046a22b480 0t0 22701 socket init 1 root 10u unix 0xffff88086a351180 0t0 39003 @/com/ubuntu/upstart init 1 root 11u unix 0xffff880469006580 0t0 16510 @/com/ubuntu/upstart ▍ -c option
The
-c option allows you to display information about files that keep processes open, executing commands whose names begin with the specified characters. For example, the following command will allow you to see the first 15 files opened by all Python processes running on the computer. cindy@ubuntu:~$ lsof -cpython | head -15 COMMAND PID USER FD TYPE DEVICE SIZE/OFF NODE NAME python2.7 16905 root cwd DIR 9,1 4096 271589387 /home/cindy/sourcebox python2.7 16905 root rtd DIR 9,1 4096 2048 / python2.7 16905 root txt REG 9,1 3345416 268757001 /usr/bin/python2.7 python2.7 16905 root mem REG 9,1 11152 1610852447 /usr/lib/python2.7/lib-dynload/resource.x86_64-linux-gnu.so python2.7 16905 root mem REG 9,1 101240 1610899495 /lib/x86_64-linux-gnu/libresolv-2.19.so python2.7 16905 root mem REG 9,1 22952 1610899509 /lib/x86_64-linux-gnu/libnss_dns-2.19.so python2.7 16905 root mem REG 9,1 47712 1610899515 /lib/x86_64-linux-gnu/libnss_files-2.19.so python2.7 16905 root mem REG 9,1 33448 1610852462 /usr/lib/python2.7/lib-dynload/_multiprocessing.x86_64-linux-gnu.so python2.7 16905 root mem REG 9,1 54064 1610852477 /usr/lib/python2.7/lib-dynload/_json.x86_64-linux-gnu.so python2.7 16905 root mem REG 9,1 18936 1610619044 /lib/x86_64-linux-gnu/libuuid.so.1.3.0 python2.7 16905 root mem REG 9,1 30944 1207967802 /usr/lib/x86_64-linux-gnu/libffi.so.6.0.1 python2.7 16905 root mem REG 9,1 136232 1610852472 /usr/lib/python2.7/lib-dynload/_ctypes.x86_64-linux-gnu.so python2.7 16905 root mem REG 9,1 77752 1610852454 /usr/lib/python2.7/lib-dynload/parser.x86_64-linux-gnu.so python2.7 16905 root mem REG 9,1 387256 1610620979 /lib/x86_64-linux-gnu/libssl.so.1.0.0 Here is another interesting example. For example, there are a number of Python 2.7 and Python 3.6 processes, and you need to find out which files are open by processes that are not Python 2.7 processes. You can do it like this:
cindy@ubuntu:~$ lsof -cpython -c^python2.7 | head -10 COMMAND PID USER FD TYPE DEVICE SIZE/OFF NODE NAME python 20017 root cwd DIR 9,1 4096 2048 / python 20017 root rtd DIR 9,1 4096 2048 / python 20017 root txt REG 9,1 3345416 268757001 /usr/bin/python2.7 python 20017 root mem REG 9,1 11152 1610852447 /usr/lib/python2.7/lib-dynload/resource.x86_64-linux-gnu.so python 20017 root mem REG 9,1 6256 805552236 /usr/lib/python2.7/dist-packages/_psutil_posix.x86_64-linux-gnu.so python 20017 root mem REG 9,1 14768 805552237 /usr/lib/python2.7/dist-packages/_psutil_linux.x86_64-linux-gnu.so python 20017 root mem REG 9,1 10592 805451779 /usr/lib/python2.7/dist-packages/Crypto/Util/strxor.x86_64-linux-gnu.so python 20017 root mem REG 9,1 11176 1744859170 /usr/lib/python2.7/dist-packages/Crypto/Cipher/_ARC4.x86_64-linux-gnu.so python 20017 root mem REG 9,1 23560 1744859162 /usr/lib/python2.7/dist-packages/Crypto/Cipher/_Blowfish.x86_64-linux-gnu.so ▍Option + d
The
+d option allows you to find out which folders and files are open in a certain directory (but not in its subdirectories). cindy@ubuntu:~$ lsof +d /usr/bin | head -4 COMMAND PID USER FD TYPE DEVICE SIZE/OFF NODE NAME circusd 1351 root txt REG 9,1 3345416 268757001 /usr/bin/python2.7 docker 1363 root txt REG 9,1 19605520 270753792 /usr/bin/docker runsvdir 1597 root txt REG 9,1 17144 272310314 /usr/bin/runsvdir ▍ -d option
Perhaps the
-d option is one of those that I use most often. It gives only options -p . This option allows you to specify a list of file descriptors, separated by a comma, to be included in the output or excluded from it. This is what the documentation says about it:, «^». , «^». .
, , , - : «0-7» «3-10».
, «^», - «^0-7» 0 7.
, , .
, lsof .▍ -p option
I can not remember when I would not use the option
-p , working with lsof . It allows you to display all files opened by the process with the specified when calling the PID command.For example, here’s how Ubuntu looks like displaying information about all files opened by a process, say, with PID 1.
Output from the lsof command invoked with the -p option in Ubuntu
This is what is displayed on my MacBook Air.
Output from the lsof command invoked with the -p option on a MacBook Air
▍ -P option
The
-P option suppresses, for network files, the conversion of port numbers to port names. It is useful to use in cases where the resolution of port names does not work correctly.This option can be used with another option -
-n , which suppresses the conversion of network numbers to host names for network files. It is also useful for resolving hostnames in the wrong way.Suppressing both of the above transformations can sometimes speed up
lsof .▍ -i option
The
-i option allows you to display information about files whose Internet addresses match the specified address. If you do not specify addresses when invoking the command, this option allows you to display information about all Internet sockets and network files.With
lsof you can, for example, look at TCP connections opened by a Slack or Dropbox client. For fun, try to see how many connections Chrome tabs open, each of which is a separate process. Let's look at the connections opened by Slack: lsof -i -a -u $USER | grep Slack Displaying information about connections that Slack has opened
And with
lsof you can learn about TCP sockets opened by the Dropbox client:Displaying the connections that Dropbox has opened
Lsof allows Lsof to view UDP connection information using the lsof -iUDP .Displaying UDP connections
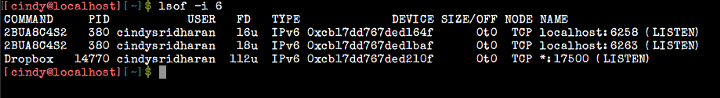
Using the
lsof -i 6 command, you can display a list of open IPv6 connections.Displaying IPv6 Connections
▍ -t option
The
-t option suppresses all information except process IDs. I often use it if I want to redirect the PID list to some other command, mostly kill-9 . cindy@ubuntu:~$ lsof -t /var/log/dummy_svc.log 1235 2171 2188 2189 16758 16761 16762 Combination of options
Usually
lsof combines the results of using several options, following the principle of logical OR. If you specify the -a option, the results will be combined according to the rules of logical I.Of course, there are several exceptions to this rule, here, as usual, it is recommended to look at the documentation, but if in a nutshell, it works like this:
, , -i , -u foo, , , «foo». :

ID (UID) «^» (), -u;
(PID) «^» (), -p;
(PGID) «^» (), -g;
«^» (), -c;
TCP UDP, -s [p:s].

- , , .

-a . , -a, -U -u foo, UNIX, , «foo».
, , -i , -u foo, , , «foo». :
ID (UID) «^» (), -u;
(PID) «^» (), -p;
(PGID) «^» (), -g;
«^» (), -c;
TCP UDP, -s [p:s].
- , , .
-a . , -a, -U -u foo, UNIX, , «foo»., , -i , -u foo, , , «foo». :
ID (UID) «^» (), -u;
(PID) «^» (), -p;
(PGID) «^» (), -g;
«^» (), -c;
TCP UDP, -s [p:s].
- , , .
-a . , -a, -U -u foo, UNIX, , «foo»., , -i , -u foo, , , «foo». :
ID (UID) «^» (), -u;
(PID) «^» (), -p;
(PGID) «^» (), -g;
«^» (), -c;
TCP UDP, -s [p:s].
- , , .
-a . , -a, -U -u foo, UNIX, , «foo»., , -i , -u foo, , , «foo». :
ID (UID) «^» (), -u;
(PID) «^» (), -p;
(PGID) «^» (), -g;
«^» (), -c;
TCP UDP, -s [p:s].
- , , .
-a . , -a, -U -u foo, UNIX, , «foo»., , -i , -u foo, , , «foo». :
ID (UID) «^» (), -u;
(PID) «^» (), -p;
(PGID) «^» (), -g;
«^» (), -c;
TCP UDP, -s [p:s].
- , , .
-a . , -a, -U -u foo, UNIX, , «foo».
, , -i , -u foo, , , «foo». :

ID (UID) «^» (), -u;
(PID) «^» (), -p;
(PGID) «^» (), -g;
«^» (), -c;
TCP UDP, -s [p:s].

- , , .

-a . , -a, -U -u foo, UNIX, , «foo».The story of a big victory
Perhaps I'm exaggerating a little here, the “victory” was not so big, but when something happened that was going on,
lsof was very helpful.A couple of weeks ago, I had to pick up one copy of a new service in a test environment. The test service in question was not connected to the working monitoring infrastructure. I tried to find out why the process that had just been launched did not register itself with Consul, and as a result, other services could not detect it. “So, I don't know what's the matter, but I'll take a look at the logs,” I thought. If something does not work as expected, I look at the logs of the service I am trying to work on, and in most cases the logs immediately indicate the root of the problem.
The service in question was launched using the process manager and circus sockets. Logs for processes running under
circus are stored in a special place on the host - let's call it /var/log/circusd . Newer services on the host were launched by another manager, s6 , who writes logs to another location. Then, there are also logs that socklog/svlogd, which, again, are somewhere else. In short, there was no shortage of logs, and the main problem was to find out in which file descriptor my logging process was writing.Since I knew that the process that I was trying to deal with was working under
circus , connecting with the tail command to /var/log/circusd/whatever_tab_completion_suggested would allow me to look at the stdout and stderr streams of this process. True, viewing the log did not give me absolutely nothing. It quickly became clear that I was reading the wrong log file, and indeed, upon closer inspection, it turned out that /var/log/circusd were two files in /var/log/circusd : stage-svcname-stderr.log and staging-svcname.stderr.log . I then used to complete the command with the Tab key, and the file that was automatically selected was not the one I needed.One of the ways to understand which file was really used by the process of interest to me for logging was to use the
lsof -l filename , which would output information about all processes that have open file descriptors. It turned out that none of the working processes had associated a log file that I was viewing using the tail command, which meant that this file could be safely deleted.Viewing another file immediately made it possible to find out why the process failed (while
circus restarted it after the failure, which led to an endless cycle of restart failures).Results
The more often I use the
lsof command, the more other tools it replaces and the more useful it allows me to learn. Hopefully lsof now has a chance to benefit you lsof .Dear readers! What are some of the most common Linux command-line tools that you use?
Source: https://habr.com/ru/post/337934/
All Articles