Using different metrics to cluster key queries
Technology determines the result. Calltouch has long accepted this truth for itself.
Our senior product manager, Fyodor Ivanov, mthmtcn, wrote material on the use of various metrics for clustering key queries.
Today, conversion optimization tools in contextual advertising are widely used by both direct advertisers and agencies. For more than a year we at Calltouch have been developing our tool for optimizing rates in contextual advertising. The main goal of optimizers is to calculate such rates for keywords, which would allow to achieve the desired key indicators. ( K P I ) which are set as optimization goal. A classic example of such a problem setting is optimization by C P A : ( C o s tP e rA c t i o n ) . In this case, the main goal of the optimizer is to get as many conversions (target actions) as possible so that the average cost of this action does not exceed the established target limit. C P A . There are also optimization strategies like maximizing Ro o i( R e t u r no fI n v e s t m e n t ) , attracting maximum conversions for a given budget of advertising campaigns, etc.
Today there are a significant number of systems that are involved in bid management. Each tool has its own characteristics in terms of initial setup, functionality, additional options, etc. In particular, the Calltouch optimizer specializes in optimizing contextual advertising in calling topics (although its capabilities are not limited to optimizing only calls). Systems for context optimization as a whole successfully cope with the tasks that advertisers set for them. However, a significant effect from optimization is achieved mainly by those customers who have large advertising budgets. To understand this relationship is quite simple. One way or another, all conversion optimizers are repelled from data collected over a certain reference period. The larger the budget of the advertising account, the more statistics needed to calculate the optimal rates can be collected. In addition, the size of the budget for the context directly affects the speed of data collection, and hence the speed with which the optimizers “accelerate”. The above is vividly illustrated by the Yandex Yandex online help on automated bid management strategy in a campaign:
')
It is obvious that only a very small number of advertising campaigns fit the “filter” discussed above. For advertisers with small budgets, as well as for newly created advertising campaigns, launching this kind of optimizer is not possible. Of course, the “third-party” optimizers are not so demanding on the volume of traffic (in particular, we set a minimum threshold of 1 target visit and 10 clicks average daily for a “folder” - a package of optimized campaigns with common K P I and optimization strategy), but they are somehow forced to exist in conditions of a significant shortage of accumulated statistics. Consider the problem of lack of data in more detail.
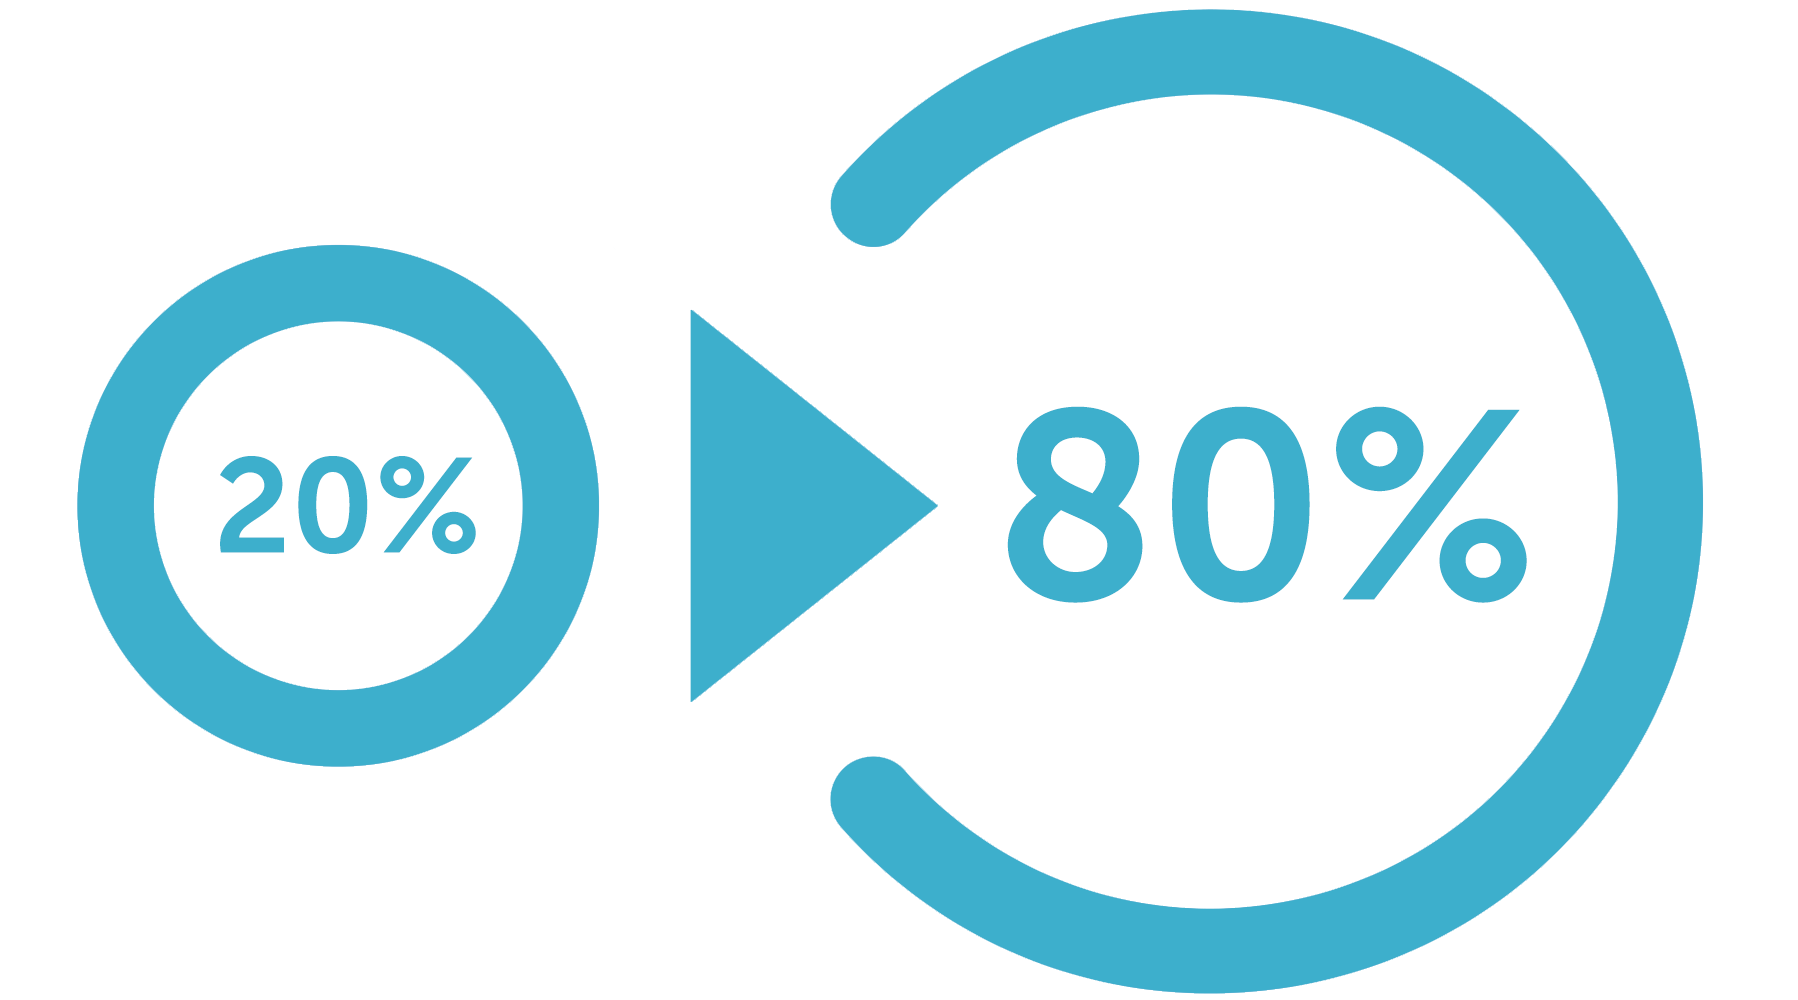
The Pareto principle is widely known, which can be formulated as: “20% of efforts give 80% of the result”:
Based on our observations, this principle also takes place in contextual advertising, but the proportion is slightly different: “5% of key phrases account for 95% of traffic (statistics)”:

Since conversion optimizers decide on the optimal rate for each keyword phrase separately, an informed decision can only be made on approximately 5% of the phrases. If we look at this picture in more detail, then all key phrases can be divided into 3 groups according to the volume of statistics (for a certain period of its collection, which is otherwise called reference):

Of course, the question of the sufficiency of statistics should be consistent with some criterion for estimating the amount of data. The calculation of this criterion is based on the methods of probability theory and mathematical statistics related to the assessment of the sufficiency of the sample size of a certain distribution.
Thus, all key phrases can be divided into 3 main groups:
Before we start discussing various approaches for calculating rates under conditions of insufficient data, it is necessary to understand how these data are converted into an optimal rate. This transformation can be divided into 2 main blocks:
First, consider the second block. We assume that we predicted the conversion rate With R by phrase. If the client has set targets K P I and the phrase has been accumulated some statistics S t on the required key metrics, then the optimal rate B i d calculated as a function of the above parameters:
The key point in calculating the bid is to predict the conversion rate as precisely as possible, which is done before the moment the bid is calculated. By definition, the conversion rate of a key phrase is the probability that a click on this phrase will lead to a conversion. With enough clicks CL and conversions CV This coefficient can be calculated as:
For example, suppose the phrase X for a certain period there were 2 clicks and 1 conversion. In this case, the formula will give the value CR=0.5 . Let optimization strategy - “maximum conversions at CPA=2000 rub. ", then Bid=200∗0.5=1000 rub. It remains to hope that the phrase X not related to YAN-campaign ...
The opposite case. Let the phrase Y There were 2 clicks and 0 conversions. In this case, the formula will give the value CR=0 . Let optimization strategy - “maximum conversions at CPA=2000 rub ", then Bid=2000∗0=0 rub. In this case, the minimum bid for the currency of this account will be sent. Impressions on the phrase will practically cease, and it will never bring conversion in the future.
If the phrase was 0 clicks and 0 conversions, then the calculation CR “Directly” is basically impossible in view of the vagueness of the expression “0/0”.
Thus, the “simple” formula for calculating CR can be used only for key phrases with a sufficient amount of statistics (as we remember, there are about 5% of such phrases), and we cannot make “weighted” decisions on the remaining 95% of phrases.
In order to get out of this situation, various techniques can be used, for example:
Methods 2 and 5 are actively used in our tool, in the near future we also plan to add the possibility of flexible adjustment of the reference period. About how to do this, we will write a separate article. And in this paper we consider the method of "pooling", which showed the greatest efficiency and is widely used in systems for optimizing contextual advertising.
Pooling methods
Pooling (eng. Pooling) is essentially a "reasonable" increase in statistics on a keyword phrase by borrowing statistics on other phrases. In order to understand the principle of classic pooling, let's turn to the structure of an advertising account (for example, Yandex Direct):
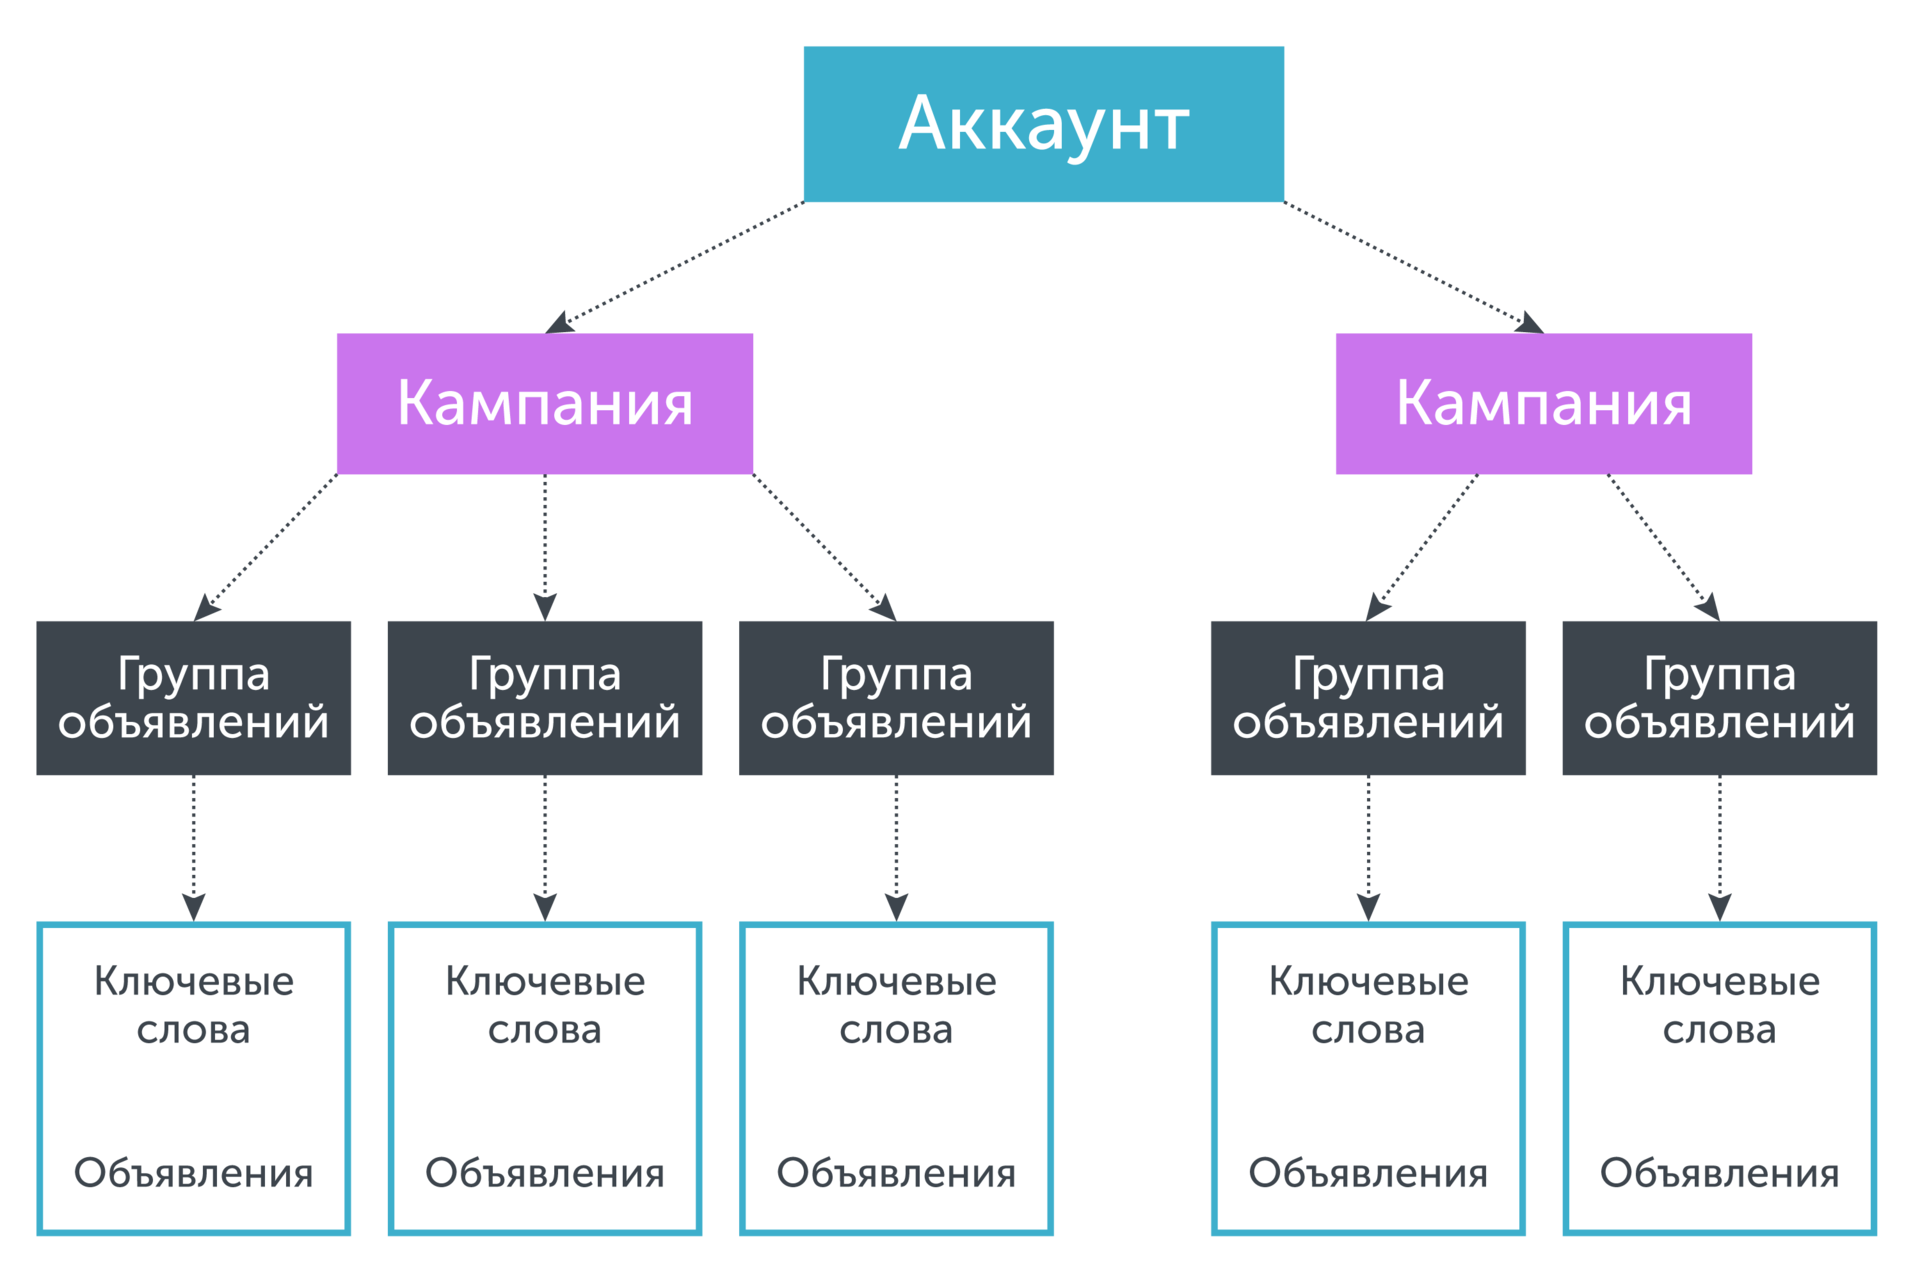
The account has a tree structure, where the “root” is the account itself, and the “leaves” are key phrases. Key phrases in a certain way associated with the ads, the display of which they initiate. Ads, in turn, are collected in ad groups, which in turn are combined in an advertising campaign. If we need to predict the conversion rate for a keyword phrase, for which there is not enough own statistics, then we combine the statistics for the keyword phrase and ads, the ad group to which the phrase belongs, the campaign to which the ad group belongs, and so on until typed thus statistics will not be enough to make a decision about the value of the predicted parameter. Graphically, this is equivalent to “moving down” in a tree from “leaves” to “root”:
The simplest pooling formula is:
Let's give an example. Let the phrase X There were 5 clicks and 1 conversion, and for the ad group in which X , accumulated 100 clicks and 5 conversions. If we assume that one hundred clicks is enough to make a decision about the optimal rate, we get:
Obviously, the larger the variance, the smaller k , which means the less influence the next level of pooling has in predicting the conversion rate. Magnitude sigma2F determined by how close the conversion rates are to each other. With the classic model of pooling sigma2F will directly depend on how well developed advertising account, and hence the quality of forecasting depends on the human factor.
In addition, hierarchical pooling takes into account only the statistics on phrases, leaving aside its structure.
In connection with all of the above, the Calltouch team developed a different approach to predicting conversion rates.
The main idea of our approach is to abandon the hierarchical structure during pooling. Instead, a special metric is introduced. d (measure of distance), allowing to evaluate the similarity of the texts of key phrases among themselves.
For a given key phrase X we will select such elements from a variety of phrases with a sufficient amount of statistics S (which we will call the clustering core), so that the distance between the text X and the selected elements did not exceed some predetermined number delta :

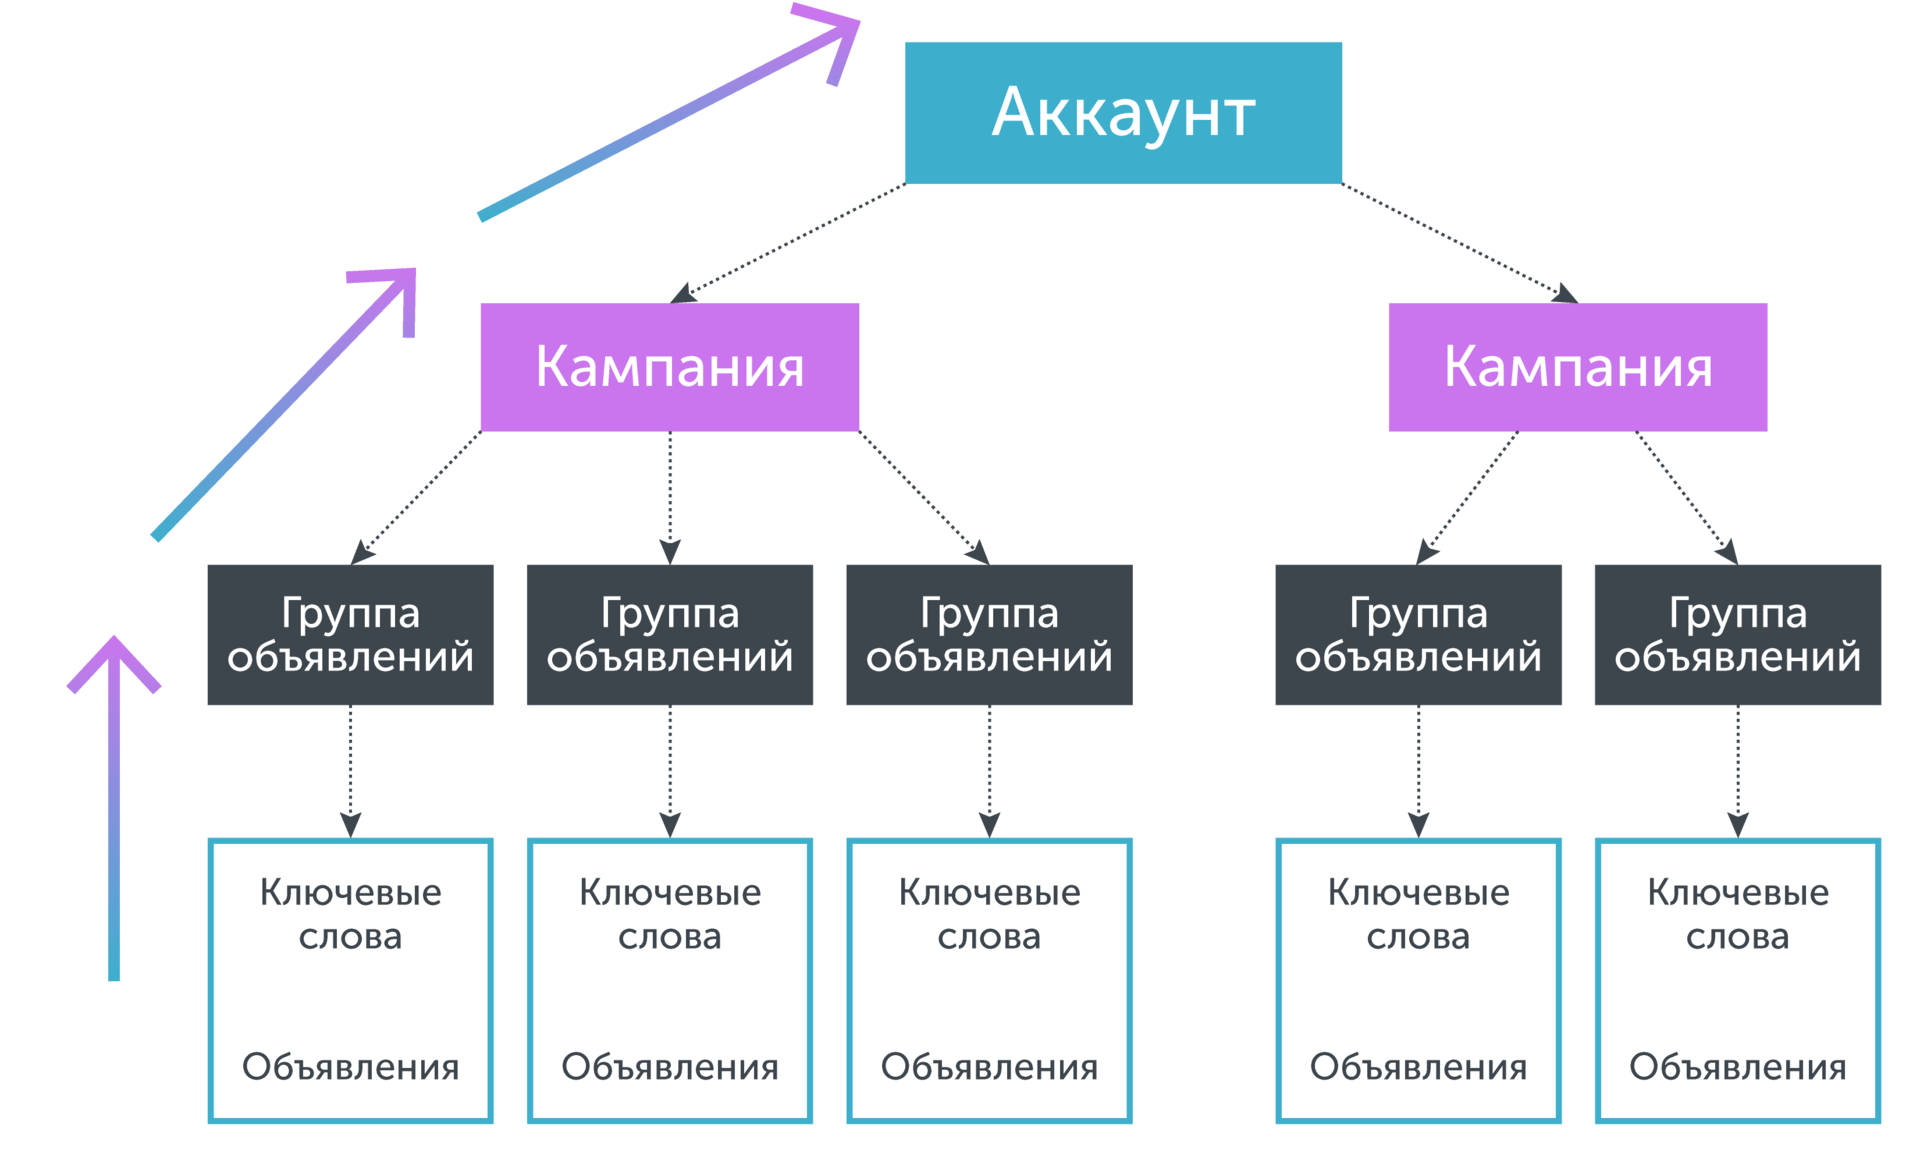
Now consider the structure of clusters in more detail:
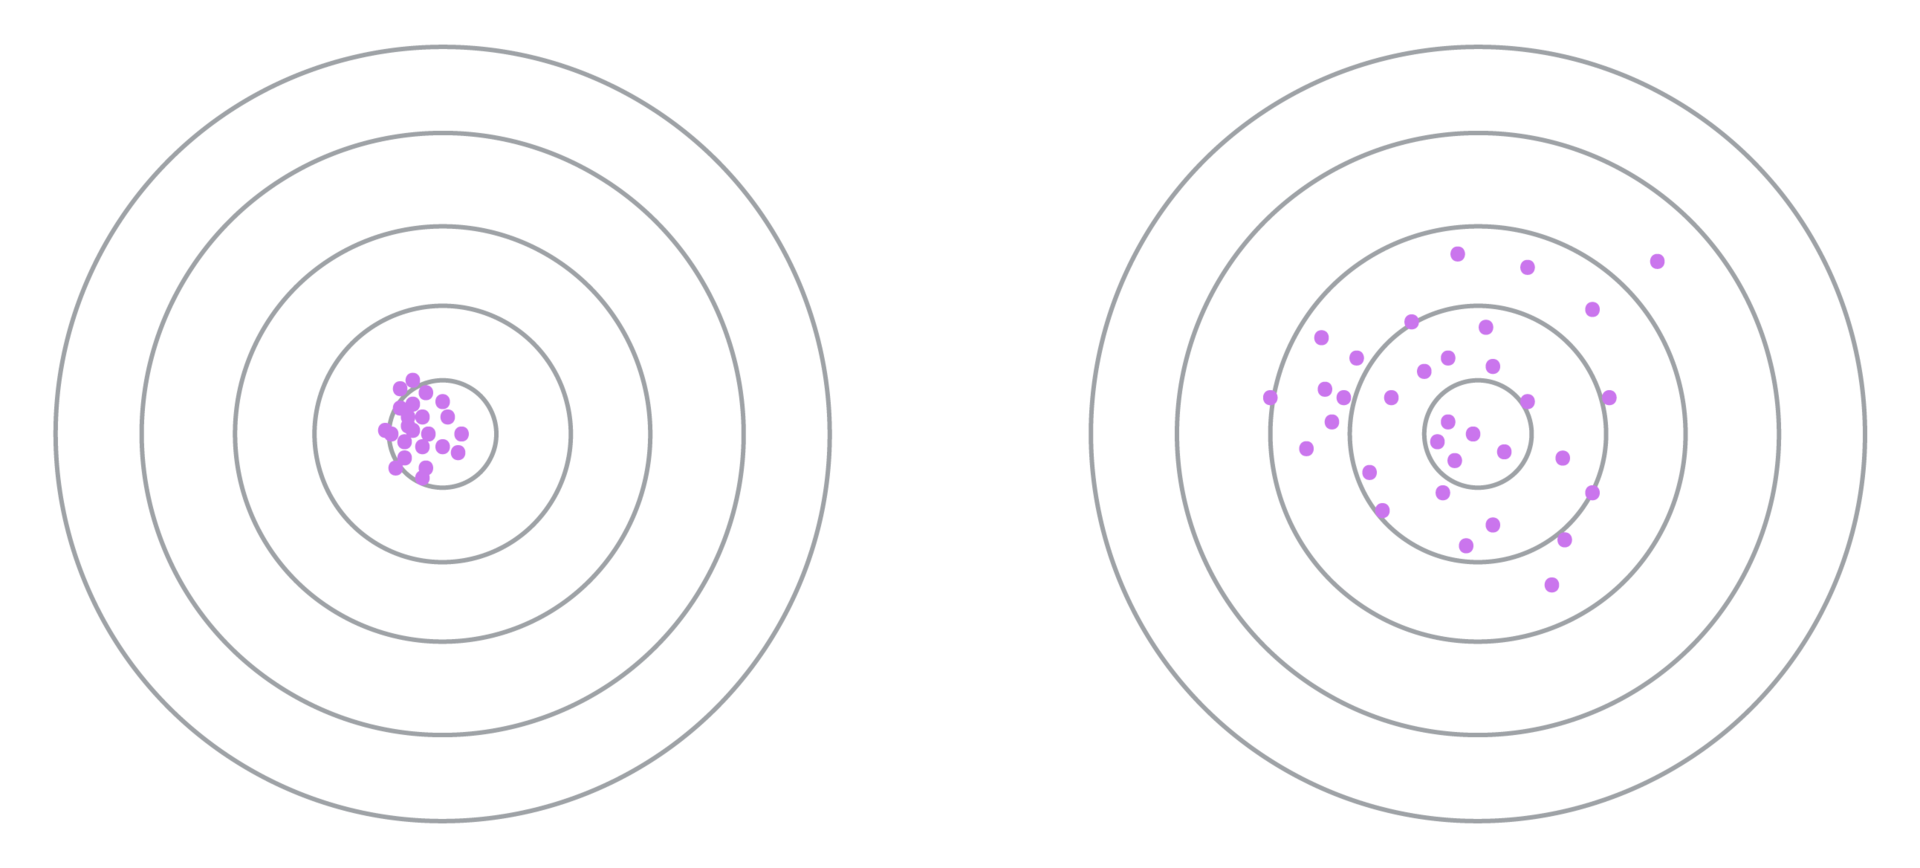
In the left figure, key phrases with a small variance of the conversion rate are selected, while on the right - with a large one. It is seen that in the case of a large variance, the algorithm converges more slowly (it is required to increase the threshold several times delta , and the forecast itself is less accurate. Therefore, it is required to select in advance such a metric of similarity of phrases, which would minimize the variance.
There are many different metrics that allow us to calculate the similarity of two texts (key phrases in our case). Each of these metrics has both its own advantages and disadvantages, which limit the scope of their possible application. In the study conducted by our team, the following types of distances were considered:
Consider each of the metrics in more detail.
The Levenshtein distance is defined as the minimum number of operations to insert one character, delete one character, and replace one character with another, necessary to turn one line into another. Denote this distance between the lines. S1 and S2 as L(S1,S2) . Clearly the more L(S1,S2) the smaller row S1 and S2 look alike.
Let's give some examples.
Let be S1=′string′ and S2=′dog′ then to turn S1 at S2 , it is required to replace “t” with “o”, “p” with “b” and “o” with “a”, which means L(S1,S2)=3 .
If a S1= 'this is one phrase' and S2= 'and this is a completely different phrase', then L(S1,S2)=12 .
The main advantages of the Levenshtein distance are its weak dependence on the word forms in the text as well as ease of implementation, and the main disadvantage is the dependence on the word order.
The basic idea behind the calculation of the N-gram distance is the splitting of strings into substrings of length N and counting the number of matching substrings.
For example, if N = 2 (splitting into bigrams) and S1= 'once keyword,' a S2= 'two keywords' then S1 corresponds to the following set of bigrams: 'ra', 'az', 'ke', 'her', ..., 'rd', and the line S2 : 'dv', 'va', 'ke', 'her', ..., 'rd'.
If N = 3 (splitting into trigrams), then for the same S1 and S2 we will receive:
S1 : 'time', 'azk', 'zke', 'kei', 'eir', ..., 'hordes'
S2 : 'two', 'vak', 'ake', 'key', 'eir', ..., 'hordes'
N-gram distance itself Ng(N,S1,S2) calculated by the following formula:
In our case: Ng(2,S1,S2)=0.75 and Ng(3,S1,S2)=0.83 .
The main advantage of this approach to calculating the similarity of key phrases is that it depends little on the form of words in the text. The main disadvantage is the dependence on the free parameter N, the choice of which can have a strong effect on the variance within the cluster.
The basic idea on which the cosine distance calculation is based is that a string of characters can be converted into a numerical vector. If we do this procedure with two compared lines, then the measure of their similarity can be estimated through the cosine between two numerical vectors. It is known from the school mathematics course that if the angle between the vectors is 0 (that is, the vectors completely coincide), then the cosine is 1. And vice versa: if the angle between the vectors is 90 degrees (the vectors are orthogonal, that is, they do not fully coincide), then they are equal to 0.
Before introducing the formal definition of cosine distance, it is required to determine the method of mapping a string to a number vector. As such a display, we used the transformation of a text string into a vector of indicators.
Consider an example. Let be
S1= 'buy plastic windows at a discount',
S2= 'buy cheap plastic windows with free delivery in Moscow'
Create a table:
The first row of the table lists all the different words that appear in the texts. S1 and S2 , the second and third lines are indicators of the fact that this word occurs in the line S1 or S2 respectively. So, if we replace each of the lines S1 and S2 on vectors from indicators (let's call them respectively A and B ), then we can calculate the cosine between the lines using the formula:
For our example:
Distance between S1 and S2 we will consider the formula:
Then in our case:
The main advantage of cosine distance is that this metric works well on sparse data (real texts of key phrases can be very long, contain significant amounts of service information, such as negative keywords, stop words, etc.). The key disadvantage of cosine distance is its very strong dependence on the forms of the word.
We illustrate this with a telling example. Let be,
S 1 = 'buy plastic windows'
S 2 = 'buy a plastic window'
It is easy to see that all the words in two at first glance very similar texts are used in different forms. If we calculate the cosine distance between such lines, we getC o s D ( S 1 , S 2 ) = 1 . This means that between S 1 and S 2 is nothing at all that does not agree with common sense. The situation can be corrected by preliminary text preprocessing (lemmatization). We give a brief reference from Wikipedia.
In our case from S 1 = “buy plastic windows” we get “buy plastic window”, and fromS 2 = “buy plastic window” - “buy plastic window”. Then for normalized texts we have:
We and the optimizer development team tested the metrics discussed above on statistics collected in our clients' advertising accounts. Various topics were considered, such as: real estate, cars, medicine, etc. Since the Calltouch service database contains data on more than 10,000 clients, we had more than enough data to conduct reliable tests with metrics. The table shows the averaged variance indices calculated when clustering key phrases using different metrics.
As the clustering core, such key phrases were selected, for which in the last 28 days there was at least one conversion and the number of clicksC L which satisfied the ratio:
C R ), while using any of the above metrics of the similarity of phrases to each other significantly reduces this indicator. The cosine distance was the best metric for clustering.
This article describes a new approach to clustering key phrases based on textual similarity. It is shown that this method significantly reduces the intracluster dispersion of the conversion rate, which significantly improves the accuracy of predicting the conversion of a keyword phrase. The methods described in the article can be used to optimize even those phrases whose own statistics are not enough to make a decision about the optimal rate. The above methods for calculating the conversion rate are elements of the Calltouch conversion optimizer, which in practice shows high efficiency both on large projects and on accounts with a relatively small advertising budget.
Our senior product manager, Fyodor Ivanov, mthmtcn, wrote material on the use of various metrics for clustering key queries.
Introduction
Today, conversion optimization tools in contextual advertising are widely used by both direct advertisers and agencies. For more than a year we at Calltouch have been developing our tool for optimizing rates in contextual advertising. The main goal of optimizers is to calculate such rates for keywords, which would allow to achieve the desired key indicators. ( K P I ) which are set as optimization goal. A classic example of such a problem setting is optimization by C P A : ( C o s tP e rA c t i o n ) . In this case, the main goal of the optimizer is to get as many conversions (target actions) as possible so that the average cost of this action does not exceed the established target limit. C P A . There are also optimization strategies like maximizing Ro o i( R e t u r no fI n v e s t m e n t ) , attracting maximum conversions for a given budget of advertising campaigns, etc.
Today there are a significant number of systems that are involved in bid management. Each tool has its own characteristics in terms of initial setup, functionality, additional options, etc. In particular, the Calltouch optimizer specializes in optimizing contextual advertising in calling topics (although its capabilities are not limited to optimizing only calls). Systems for context optimization as a whole successfully cope with the tasks that advertisers set for them. However, a significant effect from optimization is achieved mainly by those customers who have large advertising budgets. To understand this relationship is quite simple. One way or another, all conversion optimizers are repelled from data collected over a certain reference period. The larger the budget of the advertising account, the more statistics needed to calculate the optimal rates can be collected. In addition, the size of the budget for the context directly affects the speed of data collection, and hence the speed with which the optimizers “accelerate”. The above is vividly illustrated by the Yandex Yandex online help on automated bid management strategy in a campaign:
Targeted visits in 28 days + 0.01 x clicks in 28 days ≥ 40- This is the optimization threshold for the automatic CPA strategy (for 1 campaign).
The strategy is effective for campaigns with more than 200 clicks per week and more than 10 targeted visits per week.- and this is a criterion that guarantees the effectiveness of optimization.
')
It is obvious that only a very small number of advertising campaigns fit the “filter” discussed above. For advertisers with small budgets, as well as for newly created advertising campaigns, launching this kind of optimizer is not possible. Of course, the “third-party” optimizers are not so demanding on the volume of traffic (in particular, we set a minimum threshold of 1 target visit and 10 clicks average daily for a “folder” - a package of optimized campaigns with common K P I and optimization strategy), but they are somehow forced to exist in conditions of a significant shortage of accumulated statistics. Consider the problem of lack of data in more detail.
Keyword Statistics
The Pareto principle is widely known, which can be formulated as: “20% of efforts give 80% of the result”:
Based on our observations, this principle also takes place in contextual advertising, but the proportion is slightly different: “5% of key phrases account for 95% of traffic (statistics)”:
Since conversion optimizers decide on the optimal rate for each keyword phrase separately, an informed decision can only be made on approximately 5% of the phrases. If we look at this picture in more detail, then all key phrases can be divided into 3 groups according to the volume of statistics (for a certain period of its collection, which is otherwise called reference):
Of course, the question of the sufficiency of statistics should be consistent with some criterion for estimating the amount of data. The calculation of this criterion is based on the methods of probability theory and mathematical statistics related to the assessment of the sufficiency of the sample size of a certain distribution.
Thus, all key phrases can be divided into 3 main groups:
- Phrases with sufficient statistics for the reference period
- Phrases with statistics that are not enough to make a decision
- Phrases without statistics for the reference period
Before we start discussing various approaches for calculating rates under conditions of insufficient data, it is necessary to understand how these data are converted into an optimal rate. This transformation can be divided into 2 main blocks:
- Calculation of the predicted ratio C R keyword conversion
- Calculation of the optimal rate for the calculated C R and established K P I
First, consider the second block. We assume that we predicted the conversion rate With R by phrase. If the client has set targets K P I and the phrase has been accumulated some statistics S t on the required key metrics, then the optimal rate B i d calculated as a function of the above parameters:
Bid=f(CR,KPI,ST)
It is clear that the conversion rate itself also depends on the accumulated statistics, but does not depend on KPI :
CR=CR(ST)
Therefore, the final formula for calculating the optimal rate is:
Bid=f(CR(ST),KPI,ST)
Specific type of function f depends on how the metrics used are contained in ST , and from the optimization strategy and KPI . For example, for an optimization strategy by CPA The simplest formula for calculating the rate is:
Bid=CPA∗CR
For other strategies, more complex formulas are used to calculate rates.
The key point in calculating the bid is to predict the conversion rate as precisely as possible, which is done before the moment the bid is calculated. By definition, the conversion rate of a key phrase is the probability that a click on this phrase will lead to a conversion. With enough clicks CL and conversions CV This coefficient can be calculated as:
CR= fracCVCL
However, the use of this formula "in the forehead" with a small amount of statistics can lead to a deliberately inaccurate prediction of conversion rate.
For example, suppose the phrase X for a certain period there were 2 clicks and 1 conversion. In this case, the formula will give the value CR=0.5 . Let optimization strategy - “maximum conversions at CPA=2000 rub. ", then Bid=200∗0.5=1000 rub. It remains to hope that the phrase X not related to YAN-campaign ...
The opposite case. Let the phrase Y There were 2 clicks and 0 conversions. In this case, the formula will give the value CR=0 . Let optimization strategy - “maximum conversions at CPA=2000 rub ", then Bid=2000∗0=0 rub. In this case, the minimum bid for the currency of this account will be sent. Impressions on the phrase will practically cease, and it will never bring conversion in the future.
If the phrase was 0 clicks and 0 conversions, then the calculation CR “Directly” is basically impossible in view of the vagueness of the expression “0/0”.
Thus, the “simple” formula for calculating CR can be used only for key phrases with a sufficient amount of statistics (as we remember, there are about 5% of such phrases), and we cannot make “weighted” decisions on the remaining 95% of phrases.
In order to get out of this situation, various techniques can be used, for example:
- Promotional flat rates
- Analysis of metrics correlated with CR (eg bounce rate)
- Raise rates until phrases start typing statistics
- Extension of the reference period
- The use of "pooling" (smart inheritance and statistics averaging)
Methods 2 and 5 are actively used in our tool, in the near future we also plan to add the possibility of flexible adjustment of the reference period. About how to do this, we will write a separate article. And in this paper we consider the method of "pooling", which showed the greatest efficiency and is widely used in systems for optimizing contextual advertising.
Pooling methods
Pooling (eng. Pooling) is essentially a "reasonable" increase in statistics on a keyword phrase by borrowing statistics on other phrases. In order to understand the principle of classic pooling, let's turn to the structure of an advertising account (for example, Yandex Direct):
The account has a tree structure, where the “root” is the account itself, and the “leaves” are key phrases. Key phrases in a certain way associated with the ads, the display of which they initiate. Ads, in turn, are collected in ad groups, which in turn are combined in an advertising campaign. If we need to predict the conversion rate for a keyword phrase, for which there is not enough own statistics, then we combine the statistics for the keyword phrase and ads, the ad group to which the phrase belongs, the campaign to which the ad group belongs, and so on until typed thus statistics will not be enough to make a decision about the value of the predicted parameter. Graphically, this is equivalent to “moving down” in a tree from “leaves” to “root”:
The simplest pooling formula is:
CRpool= fracCV+1CL+ frac1CRup,
Where CRpool - projected CR key phrase CV - the number of conversions for the key phrase, CL - the number of clicks on the key phrase, CRup - The value of the conversion rate for the next level of pooling (for example, the value of the campaign conversion rate). Thus, this model predicts how many phrases will require additional clicks to get another conversion, suggesting that, on average, all phrases have CR close to CRup . In turn, it can be calculated directly, provided that there is enough statistical data at this level, otherwise it can be calculated using a higher level pooling. In this case, a complex nested model is obtained.
Let's give an example. Let the phrase X There were 5 clicks and 1 conversion, and for the ad group in which X , accumulated 100 clicks and 5 conversions. If we assume that one hundred clicks is enough to make a decision about the optimal rate, we get:
CRpool= frac1+15+ frac1 frac5100= frac225=0.08.
The method of pooling and its various generalizations are widely used in systems for the automation of contextual advertising. For example, Marin Software, the world's most popular advertising management platform in the world, patented its model (US PTO patent 60948670):
CR= frac widetildeFk+CVk+CL
k=( widetildeF− widetildeF2)/( sigma2F)–1,
Where widetildeF - the average probability of conversion for the next level of pooling, sigma2F - dispersion (a measure of the spread) of the probability values of the conversion of the next level of pooling.
Obviously, the larger the variance, the smaller k , which means the less influence the next level of pooling has in predicting the conversion rate. Magnitude sigma2F determined by how close the conversion rates are to each other. With the classic model of pooling sigma2F will directly depend on how well developed advertising account, and hence the quality of forecasting depends on the human factor.
In addition, hierarchical pooling takes into account only the statistics on phrases, leaving aside its structure.
In connection with all of the above, the Calltouch team developed a different approach to predicting conversion rates.
The main ideas of our approach
The main idea of our approach is to abandon the hierarchical structure during pooling. Instead, a special metric is introduced. d (measure of distance), allowing to evaluate the similarity of the texts of key phrases among themselves.
For a given key phrase X we will select such elements from a variety of phrases with a sufficient amount of statistics S (which we will call the clustering core), so that the distance between the text X and the selected elements did not exceed some predetermined number delta :
luster (X, \ delta) = \ {p∈S: d (X, p) \ leq \ delta \}
luster (X, \ delta) = \ {p∈S: d (X, p) \ leq \ delta \}
If for a given delta the cluster does not contain enough statistics, then delta increases by a certain step h : delta:= delta+h until in Cluster(X, delta) there is not enough statistics to predict the conversion rate of the phrase X . Once the cluster is composed, the average value of the phrase conversion rate within the cluster is selected as the value CRup . Graphically, this process can be represented as follows:Now consider the structure of clusters in more detail:
In the left figure, key phrases with a small variance of the conversion rate are selected, while on the right - with a large one. It is seen that in the case of a large variance, the algorithm converges more slowly (it is required to increase the threshold several times delta , and the forecast itself is less accurate. Therefore, it is required to select in advance such a metric of similarity of phrases, which would minimize the variance.
Similarity metrics
There are many different metrics that allow us to calculate the similarity of two texts (key phrases in our case). Each of these metrics has both its own advantages and disadvantages, which limit the scope of their possible application. In the study conducted by our team, the following types of distances were considered:
- Levenshtein distance
- N-gram distance
- Cosine distance
Consider each of the metrics in more detail.
Levenshtein distance
The Levenshtein distance is defined as the minimum number of operations to insert one character, delete one character, and replace one character with another, necessary to turn one line into another. Denote this distance between the lines. S1 and S2 as L(S1,S2) . Clearly the more L(S1,S2) the smaller row S1 and S2 look alike.
Let's give some examples.
Let be S1=′string′ and S2=′dog′ then to turn S1 at S2 , it is required to replace “t” with “o”, “p” with “b” and “o” with “a”, which means L(S1,S2)=3 .
If a S1= 'this is one phrase' and S2= 'and this is a completely different phrase', then L(S1,S2)=12 .
The main advantages of the Levenshtein distance are its weak dependence on the word forms in the text as well as ease of implementation, and the main disadvantage is the dependence on the word order.
N-gram distance
The basic idea behind the calculation of the N-gram distance is the splitting of strings into substrings of length N and counting the number of matching substrings.
For example, if N = 2 (splitting into bigrams) and S1= 'once keyword,' a S2= 'two keywords' then S1 corresponds to the following set of bigrams: 'ra', 'az', 'ke', 'her', ..., 'rd', and the line S2 : 'dv', 'va', 'ke', 'her', ..., 'rd'.
If N = 3 (splitting into trigrams), then for the same S1 and S2 we will receive:
S1 : 'time', 'azk', 'zke', 'kei', 'eir', ..., 'hordes'
S2 : 'two', 'vak', 'ake', 'key', 'eir', ..., 'hordes'
N-gram distance itself Ng(N,S1,S2) calculated by the following formula:
Ng(N,S1,S2)= frac2|S1 capS2||S1|+|S2|,
Where |S1| - number of N-grams per S1 , |S2| - number of N-grams per S2 and |S1 capS2| - the number of total N-grams S1 and S2 .
In our case: Ng(2,S1,S2)=0.75 and Ng(3,S1,S2)=0.83 .
The main advantage of this approach to calculating the similarity of key phrases is that it depends little on the form of words in the text. The main disadvantage is the dependence on the free parameter N, the choice of which can have a strong effect on the variance within the cluster.
Cosine distance
The basic idea on which the cosine distance calculation is based is that a string of characters can be converted into a numerical vector. If we do this procedure with two compared lines, then the measure of their similarity can be estimated through the cosine between two numerical vectors. It is known from the school mathematics course that if the angle between the vectors is 0 (that is, the vectors completely coincide), then the cosine is 1. And vice versa: if the angle between the vectors is 90 degrees (the vectors are orthogonal, that is, they do not fully coincide), then they are equal to 0.
Before introducing the formal definition of cosine distance, it is required to determine the method of mapping a string to a number vector. As such a display, we used the transformation of a text string into a vector of indicators.
Consider an example. Let be
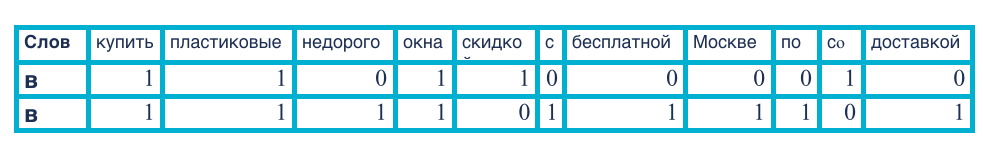
S1= 'buy plastic windows at a discount',
S2= 'buy cheap plastic windows with free delivery in Moscow'
Create a table:
The first row of the table lists all the different words that appear in the texts. S1 and S2 , the second and third lines are indicators of the fact that this word occurs in the line S1 or S2 respectively. So, if we replace each of the lines S1 and S2 on vectors from indicators (let's call them respectively A and B ), then we can calculate the cosine between the lines using the formula:
Cos(S1,S2)= frac sum limitsni=1AiBi sqrt sum limitsni=1A2i sqrt sum limitsni=1B2i
For our example:
Cos(S1,S2) approx$0.4
Distance between S1 and S2 we will consider the formula:
CosD(S1,S2)=1−Cos(S1,S2)
Then in our case:
C o s D ( S 1 , S 2 ) a p p r o x 0.55
The main advantage of cosine distance is that this metric works well on sparse data (real texts of key phrases can be very long, contain significant amounts of service information, such as negative keywords, stop words, etc.). The key disadvantage of cosine distance is its very strong dependence on the forms of the word.
We illustrate this with a telling example. Let be,
S 1 = 'buy plastic windows'
S 2 = 'buy a plastic window'
It is easy to see that all the words in two at first glance very similar texts are used in different forms. If we calculate the cosine distance between such lines, we getC o s D ( S 1 , S 2 ) = 1 . This means that between S 1 and S 2 is nothing at all that does not agree with common sense. The situation can be corrected by preliminary text preprocessing (lemmatization). We give a brief reference from Wikipedia.
Lemmatization (normalization) is the process of bringing a word form to a lemma - its normal (vocabulary) form.
In Russian, the following morphological forms are considered normal:
- for nouns, nominative, singular;
- for adjectives - nominative, singular, masculine;
- for verbs, participles, adverts - the verb in infinitive.
In addition, lemmatization removes from the text all official words - prepositions, conjunctions, particles, etc.
In our case from S 1 = “buy plastic windows” we get “buy plastic window”, and fromS 2 = “buy plastic window” - “buy plastic window”. Then for normalized texts we have:
C o s D ( S 1 , S 2 ) ≈ 0.33
Thus, the cosine distance should be calculated after preprocessing the text.
results
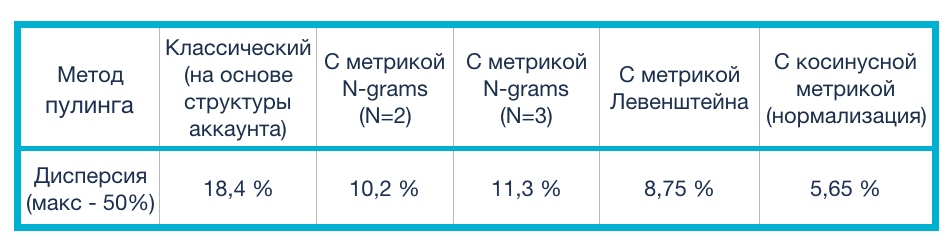
We and the optimizer development team tested the metrics discussed above on statistics collected in our clients' advertising accounts. Various topics were considered, such as: real estate, cars, medicine, etc. Since the Calltouch service database contains data on more than 10,000 clients, we had more than enough data to conduct reliable tests with metrics. The table shows the averaged variance indices calculated when clustering key phrases using different metrics.
As the clustering core, such key phrases were selected, for which in the last 28 days there was at least one conversion and the number of clicksC L which satisfied the ratio:
C L ≥ 1C R c a m p ,
Where C L c a m p - the conversion rate of the campaign that owns the keyword phrase. The table below shows that the classical method of pooling has the greatest variance (and therefore its use leads to the least accurate prediction
C R ), while using any of the above metrics of the similarity of phrases to each other significantly reduces this indicator. The cosine distance was the best metric for clustering.
Conclusion
This article describes a new approach to clustering key phrases based on textual similarity. It is shown that this method significantly reduces the intracluster dispersion of the conversion rate, which significantly improves the accuracy of predicting the conversion of a keyword phrase. The methods described in the article can be used to optimize even those phrases whose own statistics are not enough to make a decision about the optimal rate. The above methods for calculating the conversion rate are elements of the Calltouch conversion optimizer, which in practice shows high efficiency both on large projects and on accounts with a relatively small advertising budget.
Source: https://habr.com/ru/post/337888/
All Articles