How to understand that your predictive model is useless
When creating products based on machine learning, situations arise that I would like to avoid. In this text I analyze eight problems encountered in my work.
My experience is related to credit scoring models and predictive systems for industrial companies. The text will help developers and dateintists to build useful models, and managers to avoid blunders in the project.

This text is not intended to advertise any company. It is based on the practice of data analysis in the company "Romashka", which has never existed and will not exist. By "we" I mean a team of myself and my imaginary friends. All services that we created were made for a specific client and cannot be sold or transferred to other persons.
What models and for what?
Let the predictive model be an algorithm that builds forecasts and allows you to automatically make a business-friendly decision based on historical data.
I do not consider:
- one-time study of data that does not go into production;
- systems that monitor something (for example, clickable ads), but do not make decisions;
- algorithms for the sake of algorithms, i.e. not bringing direct benefits for the business (for example, artificial intelligence, which teaches virtual little men to walk).
I will talk about learning algorithms with a teacher, i.e. those that have "seen" many examples of pairs (X, Y), and can now make an estimate for any X for Y. X is information known at the time of the forecast (for example, a loan application filled in by the client). Y is unknown information necessary for making a decision (for example, whether the client will pay the loan on time). The decision itself can be made by some simple algorithm outside the model (for example, approving a loan, if the predicted probability of default is no higher than 15%).
The analyst who creates the model, as a rule, relies on metrics of forecast quality , for example, the average error (MAE) or the proportion of correct answers (accuracy). Such metrics make it possible to quickly understand which of the two models predicts more precisely (and whether, say, we need to replace the logistic regression with a neural network). But the main question, and how useful the model is , is not always the answer. For example, a credit scoring model can very easily reach 98% accuracy on data, in which 98% of clients are “good”, calling them “good” all in a row.
From the point of view of an entrepreneur or a manager, it is obvious which model is useful: which makes money. If, due to the introduction of a new scoring model, over the next year, it will be possible to refuse 3000 customers who would have brought a total loss of 50 million rubles and approve 5000 new customers who will bring a total profit of 10 million rubles, then the model is clearly good. At the development stage of the model, of course, you hardly know these amounts for sure (and even then it is far from a fact). But the sooner, more accurately and honestly you estimate the economic benefits of the project, the better.
Problems
Quite often, building a seemingly good predictive model does not lead to the expected success: it is not being introduced, or is being introduced with a long delay, or starts working normally only after dozens of releases, or stops working normally several months after implementation, or does not work at all ... Everyone seems to have done their best: the analyst squeezed the maximum predictive power out of the data, the developer created an environment in which the model works at lightning speed and never falls, and the manager applied all so that the first two can complete the work on time. So why did they get into trouble?
1. Model is not needed at all
We somehow built a model that predicts the strength of the beer after fermentation (in fact, it was not beer and not alcohol at all, but the essence is similar). The task was posed as follows: to understand how the parameters set at the beginning of fermentation affect the strength of the final beer, and learn how to better manage it. The task seemed fun and promising, and we spent more than one hundred man-hours on it before we found out that, in actual fact, the final fortress was not so important to the customer. For example, when a beer is obtained 7.6% instead of the required 8%, it simply mixes it with a stronger one in order to achieve the desired degree. That is, even if we built an ideal model, it would bring about profit at all.
This situation sounds pretty silly, but in fact it happens all the time. Managers initiate machine learning projects, “because it’s interesting,” or just to be in trend. The realization that this is not very necessary can come far from immediately, and then be rejected for a long time. Very few people are pleased to admit that time was wasted. Fortunately, there is a relatively simple way to avoid such failures: before starting any project, evaluate the effect of the ideal predictive model. If you were offered an oracle that knows exactly the future ahead, how much would you be willing to pay for it? If losses from a marriage make up a small amount anyway, then perhaps it is not necessary to build a complex system to minimize the proportion of defects.
Once, the credit scoring team was offered a new data source: checks from a large grocery store chain. It looked very tempting: "tell me what you buy, and I will tell you who you are." But it soon turned out that it was possible to identify the identity of the buyer only if he used a loyalty card. The share of such buyers turned out to be small, and at the intersection with the bank’s customers, they accounted for less than 5% of incoming loan applications. Moreover, it was the best 5%: almost all applications were approved, and the share of "default" among them was close to zero. Even if we could refuse all “bad” applications among them, it would reduce credit losses by a very small amount. It would hardly have recouped the costs of building a model, its implementation, and real-time integration with the database of stores. Therefore, a week was played with the checks, and they were transferred to the secondary sales department: there will be more benefit from such data.
But we still completed the beer model and introduced it. It turned out that it does not give savings on reducing the marriage, but it allows reducing labor costs by automating part of the process. But we understood this only after long discussions with the customer. And, honestly, we were just lucky.
2. Model frankly weak
Even if the ideal model is able to bring great benefits, not the fact that you will be able to get close to it. In X, there may simply be no information relevant to the prediction of Y. Of course, you can rarely be completely sure that you have pulled out all the useful signs from X. The greatest improvement in forecast is usually brought by feature engineering , which can last for months. But you can work iteratively: Brainstorm - creating features - training a prototype model - testing a prototype.
At the very beginning of the project, you can gather a large company and brainstorm, coming up with a variety of signs. In my experience, the strongest sign often gave half of the accuracy that was ultimately obtained from the full model. For scoring, this turned out to be the client's current credit load, for beer, the strength of the previous batch of the same variety. If, after a couple of cycles, good signs could not be found, and the quality of the model is close to zero, it may be better to wind up the project, or immediately go looking for additional data.
It is important that you need to test not only the accuracy of the forecast, but also the quality of decisions made on its basis. It is not always possible to measure the benefits of the offline model (in a test environment). But you can come up with metrics that somehow bring you closer to evaluating the monetary effect. For example, if the credit risk manager needs approval of at least 50% of applications (otherwise the sales plan fails), then you can evaluate the proportion of “bad” clients among the 50% of the best from the point of view of the model. It will be approximately proportional to the losses incurred by the bank due to loan defaults. Such a metric can be calculated immediately after the creation of the first prototype of the model. If a rough estimate of the benefits of its implementation does not even cover your own labor costs, then you should think: can we even get a good forecast?
3. Model cannot be implemented
It happens that the model created by analysts demonstrates good measures of both the accuracy of the forecast and the economic effect. But when its introduction into production begins, it turns out that the data required for the forecast are not available in real time. Sometimes it happens that this is real data "from the future." For example, when forecasting the strength of a beer, an important factor is the measurement of its density after the first stage of fermentation, but we want to use the forecast at the beginning of this stage. If we hadn’t discussed with the customer the exact nature of this feature, we would have built a useless model.
It may be even more unpleasant if data are available at the time of the forecast, but for technical reasons it is impossible to load them into the model. Last year, we worked on a model recommending the optimal channel of interaction with a client who did not make a regular loan payment on time. The debtor can call a live operator (but this is not very cheap) or a robot (cheap, but not so efficient, and infuriates customers), or you can not call at all and hope that the customer will pay today or tomorrow. One of the strong factors was the results of calls for yesterday. But it turned out that they cannot be used: the call logs are transferred to the database once a day, at night, and the call plan for tomorrow is formed today, when the data for yesterday is known. That is, data on calls are available with a lag of two days before the forecast is applied.
In my practice several times it happened that the models with good accuracy were put off in the back box or were immediately thrown away due to the unavailability of data in real time. Sometimes we had to redo them from scratch, trying to replace the signs "from the future" with some other. To prevent this from happening, the very first useful model prototype should be tested on a data stream as close as possible to the real one. It may seem that this will lead to additional costs for the development of a test environment. But, most likely, before the launch of the model “in battle”, it will have to be created anyway. Start building an infrastructure to test the model as early as possible, and you may learn a lot of interesting details in time.
4. The model is very difficult to implement.
If the model is based on data "from the future," this is hardly something you can do. But it often happens that even with the available data the introduction of the model is not easy. It is so difficult that the implementation is delayed for an indefinite period due to the lack of labor resources for this. What developers do so long, if the model has already been created?
Most likely, they rewrite all code from scratch. The reasons for this may be completely different. Perhaps their whole system is written in java, and they are not ready to use the model in python, because the integration of two different environments will give them even more headaches than rewriting the code. Or the performance requirements are so high that all production code can only be written in C ++, otherwise the model will work too slowly. Or you have done the preprocessing of signs for training the model using SQL, unloading them from the database, but in combat there is no database, and the data will come in the form of a json request.
If the model was created in one language (most likely in python), and will be applied in another, the painful problem of its transfer arises. There are ready-made solutions, for example, the PMML format, but their applicability leaves much to be desired. If this is a linear model, it is enough to save the coefficient vector in a text file. In the case of a neural network or decision trees, the coefficients will need more, and it will be easier to make mistakes in their writing and reading. It is even more difficult to serialize fully non-parametric models, in particular, complex Bayesian models. But even this can be simply compared with the creation of features, the code for which can be quite arbitrary. Even the innocuous function log() in different programming languages can mean different things, what can we say about the code for working with pictures or texts!
Even if the programming language is fine, performance issues and differences in data format in training and in battle remain. Another possible source of problems: when creating a model, the analyst actively used tools for working with large data tables, but in battle, it is necessary to make a forecast for each observation separately. Many actions performed with the n * m matrix, with the 1 * m matrix, are ineffective or meaningless. Therefore, it is useful for analytics to prepare from the very beginning of the project to receive data in the right format and to be able to work with observations individually. The moral is the same as in the previous section: start testing the entire pipeline as early as possible!
Developers and administrators of a productive system, it is useful from the beginning of the project to think about the environment in which the model will work. They have the power to make the data scientist code run in it with a minimum of changes. If you implement predictive models on a regular basis, you should create (or search with external providers) a platform that provides load management, fault tolerance, and data transfer once. On it, any new model can be run as a service. If it is impossible or unprofitable to do this, it would be useful to discuss the limitations in advance with the model developer. Perhaps you will save him and yourself from long hours of unnecessary work.
5. When introducing stupid errors occur
A couple of weeks before I came to the bank, they launched a model of credit risk from a third-party supplier. On a retrospective sample sent by the supplier, the model performed well, singling out very bad customers among the approved ones. Therefore, when the forecasts began to come to us in real time, we immediately began to apply them. A few days later, someone noticed that we were refusing more applications than expected. Then - that the distribution of incoming forecasts is unlike what was in the test sample. Began to understand, and realized that the predictions come with the opposite sign . We did not receive the probability that the borrower is bad, but the probability that he is good. For several days we refused to credit not the worst, but the best customers!
Such violations of business logic most often occur not in the model itself, but when preparing signs, or, more often, when applying a forecast. If they are less obvious than a mistake in a sign, then they can not be found for a very long time. All this time, the model will work worse than expected, for no apparent reason. The standard way to prevent this is to do unit tests for any piece of decision-making strategy. In addition, you need to test the entire decision-making system (model + its environment) as a whole (yes, I repeat this already three sections in a row). But this will not save from all misfortunes: the problem may not be in the code, but in the data. To mitigate such risks, serious innovations can be run not on the entire data stream (in our case, loan applications), but on a small, but representative part of it (for example, on randomly selected 10% of applications). A / B tests are generally useful. And if your models are responsible for really important decisions, such tests can go on in large numbers and for a long time.
6. Model is unstable
It happens that the model has passed all the tests, and was implemented without a single error. You look at the first decisions that she made, and they seem meaningful to you. They are not perfect - the 17th batch of beer turned out to be rather weak, and 14 and 23 — very strong, but on the whole everything is not bad. It takes a week or two, you continue to look at the results of the A / B test, and you understand that there are too many lots too strong. Discuss this with the customer, and he explains that he has recently replaced wort boiling tanks, and this could increase the level of dissolution of the hops. Your inner mathematician is indignant: "Why, how is that! You gave me a training sample, not a representative general population! This is deception!". But you take yourself in hand, and notice that in the training set (for the last three years) the average concentration of the dissolved hops was not stable. Yes, it is now higher than ever, but there have been sharp jumps and falls before. But they didn’t teach your model.
Another example: the confidence of the financier community in statistical methods was severely undermined after the 2007 crisis. Then the American mortgage market collapsed, pulling the entire global economy. The models that were then used to assess credit risks did not assume that all borrowers could stop paying at the same time, because there were no such events in their training sample. But an individual understanding the subject could mentally continue the existing trends and predict such an outcome.
It happens that the data stream to which you apply the model is stationary, i.e. does not change its statistical properties with time. Then the most popular methods of machine learning, neural networks and gradient boosting over decisive trees, work well. Both of these methods are based on the interpolation of training data: neurons - by logistic curves, boosting - by piecewise constant functions. Both those and others very poorly cope with the problem of extrapolation - predictions for X, which lie outside the training sample (more precisely, its convex hull ).
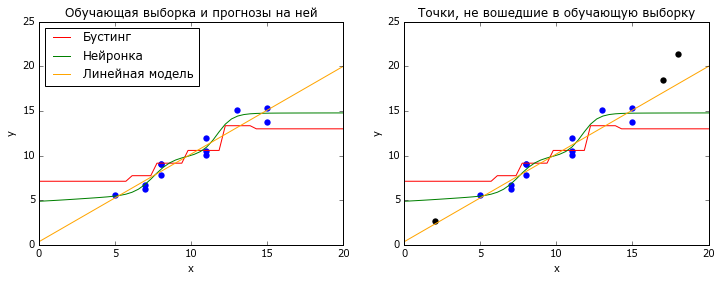
# coding: utf-8 # , import numpy as np import matplotlib.pyplot as plt from matplotlib import rc rc('font', family='Verdana') from sklearn.ensemble import GradientBoostingRegressor from sklearn.neural_network import MLPRegressor from sklearn.linear_model import LinearRegression # np.random.seed(2) n = 15 x_all = np.random.randint(20,size=(n,1)) y_all = x_all.ravel() + 10 * 0.1 + np.random.normal(size=n) fltr = ((x_all<=15)&(x_all>=5)) x_train = x_all[fltr.ravel(),:] y_train = y_all[fltr.ravel()] x_new = x_all[~fltr.ravel(),:] y_new = y_all[~fltr.ravel()] x_plot = np.linspace(0, 20) # m1 = GradientBoostingRegressor( n_estimators=10, max_depth = 3, random_state=42 ).fit(x_train, y_train) m2 = MLPRegressor( hidden_layer_sizes=(10), activation = 'logistic', random_state = 42, learning_rate_init = 1e-1, solver = 'lbfgs', alpha = 0.1 ).fit(x_train, y_train) m3 = LinearRegression().fit(x_train, y_train) # plt.figure(figsize=(12,4)) title = {1:' ', 2:', '} for i in [1,2]: plt.subplot(1,2,i) plt.scatter(x_train.ravel(), y_train, lw=0, s=40) plt.xlim([0, 20]) plt.ylim([0, 25]) plt.plot(x_plot, m1.predict(x_plot[:,np.newaxis]), color = 'red') plt.plot(x_plot, m2.predict(x_plot[:,np.newaxis]), color = 'green') plt.plot(x_plot, m3.predict(x_plot[:,np.newaxis]), color = 'orange') plt.xlabel('x') plt.ylabel('y') plt.title(title[i]) if i == 1: plt.legend(['', '', ' '], loc = 'upper left') if i == 2: plt.scatter(x_new.ravel(), y_new, lw=0, s=40, color = 'black') plt.show() Some simpler models (including linear ones) extrapolate better. But how to understand that you need them? Cross-validation ( cross-validation ) comes to the rescue, but not the classic one, in which all data is randomly mixed, but something like TimeSeriesSplit from sklearn. In it, the model is trained on all the data up to the moment t, and is tested on the data after this moment, and so on for several different t. Good quality on such tests gives hope that the model can predict the future, even if it is somewhat different from the past.
Sometimes introducing strong dependencies into a model, such as linear ones, is enough to adapt well to changes in the process. If this is undesirable or not enough, you can think of more versatile ways of making it adaptable. The simplest way is to calibrate the model by a constant: subtract from the forecast its average error over the previous n observations. If the matter is not only in the additive constant, it is possible to overweigh the observations (for example, by the principle of exponential smoothing ) when training the model. This will help the model focus on the most recent past.
Even if it seems to you that the model simply must be stable, it will be useful to start automatic monitoring. He could describe the dynamics of the predicted value, the forecast itself, the main factors of the model, and various quality metrics. If the model is really good, then she is with you for a long time. Therefore, it is better to work on the template once, than to check the model performance manually every month.
7. The training set is not truly representative.
It happens that the source of the non-representativeness of the sample is not changes over time, but features of the process that generated the data. The bank where I worked previously had a policy: it is impossible to give loans to people who have payments for current debts that exceed 40% of their income. On the one hand, this is reasonable, because a high credit load often leads to bankruptcy, especially in times of crisis. On the other hand, we can estimate both income and loan payments only approximately. Perhaps some of our unsuccessful customers were actually much better off. And in any case, a specialist who earns 200 thousand a month, and 100 of them donate to the mortgage, may be a promising client. Denying such a credit card - loss of profits. One would hope that the model would rank the clients well even with a very high credit load ... But this is not accurate, because there is not one such in the training sample!
I was lucky that three years before my arrival, my colleagues introduced a simple, albeit scary rule: approximately 1% of randomly selected applications for credit cards approve bypassing almost all policies. This 1% brought the bank losses, but allowed to obtain representative data on which you can train and test any model. Therefore, I was able to prove that even among seemingly very borrowed people you can find good clients. As a result, we began to issue credit cards to people with an estimated credit load from 40% to 90%, but with a more severe cut-off threshold for the predicted probability of default.
If there were no such stream of pure data, then it would be difficult to convince the management that the model normally ranks people with a load of more than 40%. Probably, I would train it on a sample with a load of 0-20%, and would show that on test data with a load of 20-40%, the model is able to make adequate decisions. But a narrow trickle of unfiltered data is still very useful, and if the cost of the error is not very high, it’s better to have it. Martin Tsinkevich, an ML developer from Google, gives his advice in his manual for machine learning. For example, when filtering email, 0.1% of emails marked as spam by the algorithm can still be shown to the user. This will allow to track and correct the errors of the algorithm.
8. Forecast is used inefficiently.
As a rule, a decision made on the basis of a model's forecast is only a small part of some business process, and can interact with it in a bizarre way. For example, most applications for credit cards approved by an automatic algorithm must also be approved by a live underwriter before the card is issued. When we began to approve applications with high credit load, the underwriters continued to refuse them. Perhaps they did not immediately find out about the changes, or simply decided not to take responsibility for unusual customers. We had to transfer to credit specialists labels of the type “not to refuse this client due to high load” in order for them to begin to approve such applications. But until we identified this problem, came up with a solution and implemented it, a lot of time passed during which the bank did not receive profit. Moral: with other participants in the business process you need to agree in advance.
Sometimes, in order to kill the benefits of introducing or updating a model, another division is not needed. It is bad enough to agree on the limits of what is permissible with your own manager. He may be ready to start approving customers chosen by the model, but only if they have no more than one active loan, never had delinquencies, several successfully closed loans, and there is double proof of income. If we already approve almost the entire described segment, then the model will change little.
However, with proper use of the model, the human factor can be useful. Suppose we have developed a model that tells the employee of a clothing store what else can be offered to a client, based on an existing order. Such a model can very effectively use big data (especially if the stores - the whole network). But the model does not possess a part of relevant information, for example, about the appearance of clients. Therefore, the accuracy of guessing exactly that-outfit-what-wants-the client remains low. However, it is very easy to combine artificial intelligence with human: the model prompts the seller three items, and he chooses the most suitable of them. If you correctly explain the task to all sellers, you can come to success.
Conclusion
I walked through some of the major failures I encountered while building and embedding predictive models in the business. Most often, these are not mathematical problems, but organizational ones: a model is not needed at all, or built on a sample curve, or there are difficulties with embedding it in existing processes and systems. To reduce the risk of such failures can be, if you follow simple principles:
- Use reasonable and measurable measures of forecast accuracy and economic effect.
- Starting with the first prototype, test on a streamlined data stream.
- Test the entire process, from data preparation to decision making, not just the forecast.
I hope that this text will help someone to take a closer look at their project and avoid stupid mistakes.
High you ROC-AUC and Er squares!
')
Source: https://habr.com/ru/post/337722/
All Articles