How to optimally calculate the amount of "iron": Sizing model of the EFS
More than a hundred teams participate in the development of the Sberbank Unified Frontal System Program. Each team creates and develops a specific product or service component. Each new initiative requires an estimate of the amount of hardware that will be required to develop and implement this initiative. And this is a large stream of requests for evaluation. How we solve this problem, read under a cat.

Evaluation is required at the start - for budget reservation and financial justification of the initiative. As a rule, we have a preliminary architecture and estimates from the business for the planned load, as well as estimates from the technologist for the load on the integration interactions. The total number and composition of positions can be adjusted in the course of design and implementation, or according to the results of load testing. That is, everything is complicated by the fact that the input data is small and "this is not accurate."
But there are smoothing factors. Despite the fact that the calculation is carried out separately, all reserved iron falls into the common reserve pool of the ESF Program. This allows in many places to use the "average temperature in the hospital" - if in fact in one case the load was greater, it is leveled in the other. An additional smoothing factor is that the presence in the reserve pool does not mean direct costs, since the equipment park is centrally managed and the physical reserve is common to the entire bank. For us, it is more important to minimize the system error than the error in a particular sizing.
')
This means that the classic approach to sizing, which implies the development of a sizing model for each initiative, multiple input parameters and a separate calculation for each component, is not suitable here. Fortunately, we still have a single system, there are three or four typical architectures, assembled from typical “cubes”. Therefore, we managed to reduce all the complexity and variability into a general sizing model.
Sizing model is a template of several sections. Consider each of them in more detail.
We minimized the amount of input data, leaving only those that significantly affect the assessment of "iron", and at the same time can be obtained from the product team at an early stage. The key input parameter is the peak number of business transactions per hour.
We separate the input for remote channels and the internal network.
In both cases, we receive an estimate from the customer:
We also get the number of requests through MQ (Messages Queue) integration with external systems.
The “magic number” 10, connecting the peak volume per hour and average per day, is used when the customer cannot estimate both parameters himself. It is based on the experience of industrial operation of Sberbank systems and is determined by the following features of its business:
Model Parameters
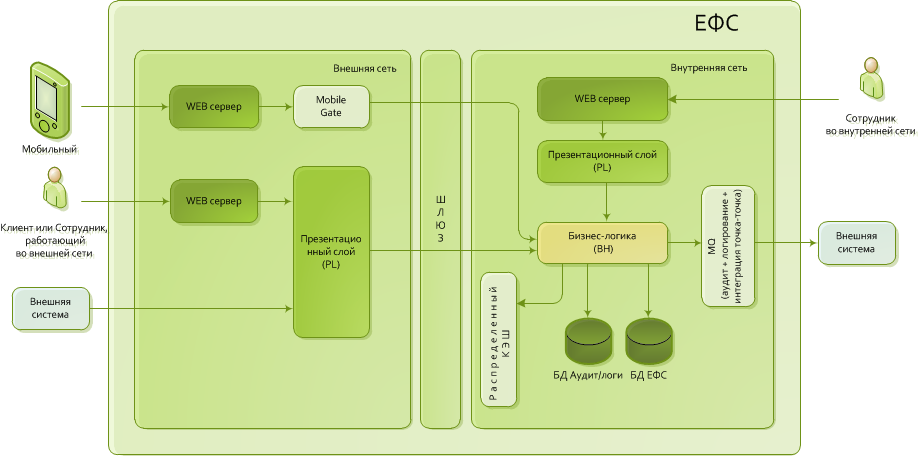
See larger diagram .
Figure 1. Simplified architecture of the ESF
The architecture of the ESF is based on the classical three-tier architecture.
Parameters are divided into three groups:
They are almost always modified by the architect for a particular sizing. The key parameters are the coefficients connecting the number of business transactions with the number of incoming http requests. It also turns on / off typical “cubes” and determines the distribution of request flows between them.
These are typical performance parameters, suitable for most cases.
Typical parameters of iron productivity in our conditions. For example, we take MQ performance with persistence disabled, since we do not use persistent messages.
Model parameters:
Estimated coefficients
The table contains a description of the coefficients for which we have developed values. If interested, ask questions in the comments - share expert assessments.
A calculation model with calculation formulas that displays input data and parameters in the final estimates for each position.
We describe a simplified sizing model. It reduced the set of positions and does not reflect the multiblock organization of the industrial environment. Simplifications are made in order not to overload the article with aspects that are not interesting if your business does not have Sberbank scales. Multi-block architecture is a topic for a separate article - we will talk about it in other posts.
Application servers and web servers are allocated for each application service. We do not combine different application services in order to exclude mutual influence on failures or during maintenance. Databases are common and are considered for financial justification and forecasting.
Below are the formulas that we use for the calculation.
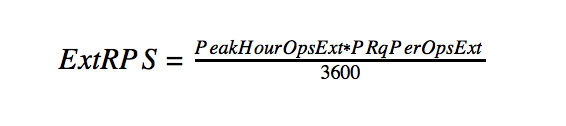
It is considered as a multiplication of the peak number of users by the number of requests per second.
This calculation includes the distribution of statics, query routing and caching for the internal network.
Number of intranet web servers


At the output of the sizing model, we get an estimate of "iron" for the industrial environment.
In world practice, there are three main models of sizing:
Model based on the analysis of the number of simultaneously working users in the system and their behavior. This model is focused on companies that have general information about the number of users and their behavior in the information system.
Model based on the analysis of transactions, the amount of data in the IP, which accounts for one user or group of users. This model is focused on companies that have accurate data on the quantitative characteristics of employees in the IS. This means that the company has an IT infrastructure, the company is at the stage of implementing a system for automating business processes or improving them.
Model based on performance tests. This model is focused on companies that have a clear plan for the implementation of business applications with a detailed study of the details. These are mainly companies that have already implemented any system for automating business processes, but wish to expand the functionality of the system. Or the existing IT infrastructure does not withstand the current load.
In the EFS program, we have a combo from the “Transactional Model” and “Test Model”. Since we have information about the amount of peak load of business operations, but also we are guided by the indicators obtained from the conducted load testing. But there are special cases when new functionality is introduced in the ESF, which was not in other systems, and we receive the expected data at the entrance, then we act by analogy with the “User Model”.
Let's talk, and what model do you use?
Evaluation is required at the start - for budget reservation and financial justification of the initiative. As a rule, we have a preliminary architecture and estimates from the business for the planned load, as well as estimates from the technologist for the load on the integration interactions. The total number and composition of positions can be adjusted in the course of design and implementation, or according to the results of load testing. That is, everything is complicated by the fact that the input data is small and "this is not accurate."
But there are smoothing factors. Despite the fact that the calculation is carried out separately, all reserved iron falls into the common reserve pool of the ESF Program. This allows in many places to use the "average temperature in the hospital" - if in fact in one case the load was greater, it is leveled in the other. An additional smoothing factor is that the presence in the reserve pool does not mean direct costs, since the equipment park is centrally managed and the physical reserve is common to the entire bank. For us, it is more important to minimize the system error than the error in a particular sizing.
')
This means that the classic approach to sizing, which implies the development of a sizing model for each initiative, multiple input parameters and a separate calculation for each component, is not suitable here. Fortunately, we still have a single system, there are three or four typical architectures, assembled from typical “cubes”. Therefore, we managed to reduce all the complexity and variability into a general sizing model.
What is a sizing model in the ESF?
Sizing model is a template of several sections. Consider each of them in more detail.
Section 1. Input
We minimized the amount of input data, leaving only those that significantly affect the assessment of "iron", and at the same time can be obtained from the product team at an early stage. The key input parameter is the peak number of business transactions per hour.
We separate the input for remote channels and the internal network.
In both cases, we receive an estimate from the customer:
- Peak number of business transactions per hour. This indicator is key and affects the required processing capacity.
- The average number of business transactions per day. Specifies the amount of stored data.
We also get the number of requests through MQ (Messages Queue) integration with external systems.
| Internal network | |
| Name | Comment |
| Peak number of business transactions per hour | Taken from business requirements or calculated: operations per day / 10 |
| Average number of business transactions per day | Taken from business requirements or calculated: operations per hour * 10 |
| Peak number of requests via MQ per second (direct integration with external systems) | The amount of the interactions point-to-point through MQ |
| External network | |
| Name | Comment |
| Peak number of business transactions per hour | Taken from business requirements or calculated: operations per day / 10 |
| Average number of business transactions per day | Taken from business requirements or calculated: operations per hour * 10 |
The “magic number” 10, connecting the peak volume per hour and average per day, is used when the customer cannot estimate both parameters himself. It is based on the experience of industrial operation of Sberbank systems and is determined by the following features of its business:
- In Russia, 12 time zones, offices and customers are distributed in all time zones, the time of the offices - 10-12 hours a day.
- The largest number of users and operations are concentrated in the time zone of Moscow, this zone determines the peak load.
- The load distribution on the clock has two peaks - in the morning and in the afternoon, generally the same for all time zones, taking into account the time shift.
Model Parameters
See larger diagram .
Figure 1. Simplified architecture of the ESF
The architecture of the ESF is based on the classical three-tier architecture.
- Presentation layer. Most often - just nginx with statics, in special cases an application server is added.
- Application server with business logic.
- Database.
Section 2. Model parameters
Parameters are divided into three groups:
- parameters depending on the implemented functionality.
They are almost always modified by the architect for a particular sizing. The key parameters are the coefficients connecting the number of business transactions with the number of incoming http requests. It also turns on / off typical “cubes” and determines the distribution of request flows between them.
- parameters that may vary for a particular sizing.
These are typical performance parameters, suitable for most cases.
- fixed parameters.
Typical parameters of iron productivity in our conditions. For example, we take MQ performance with persistence disabled, since we do not use persistent messages.
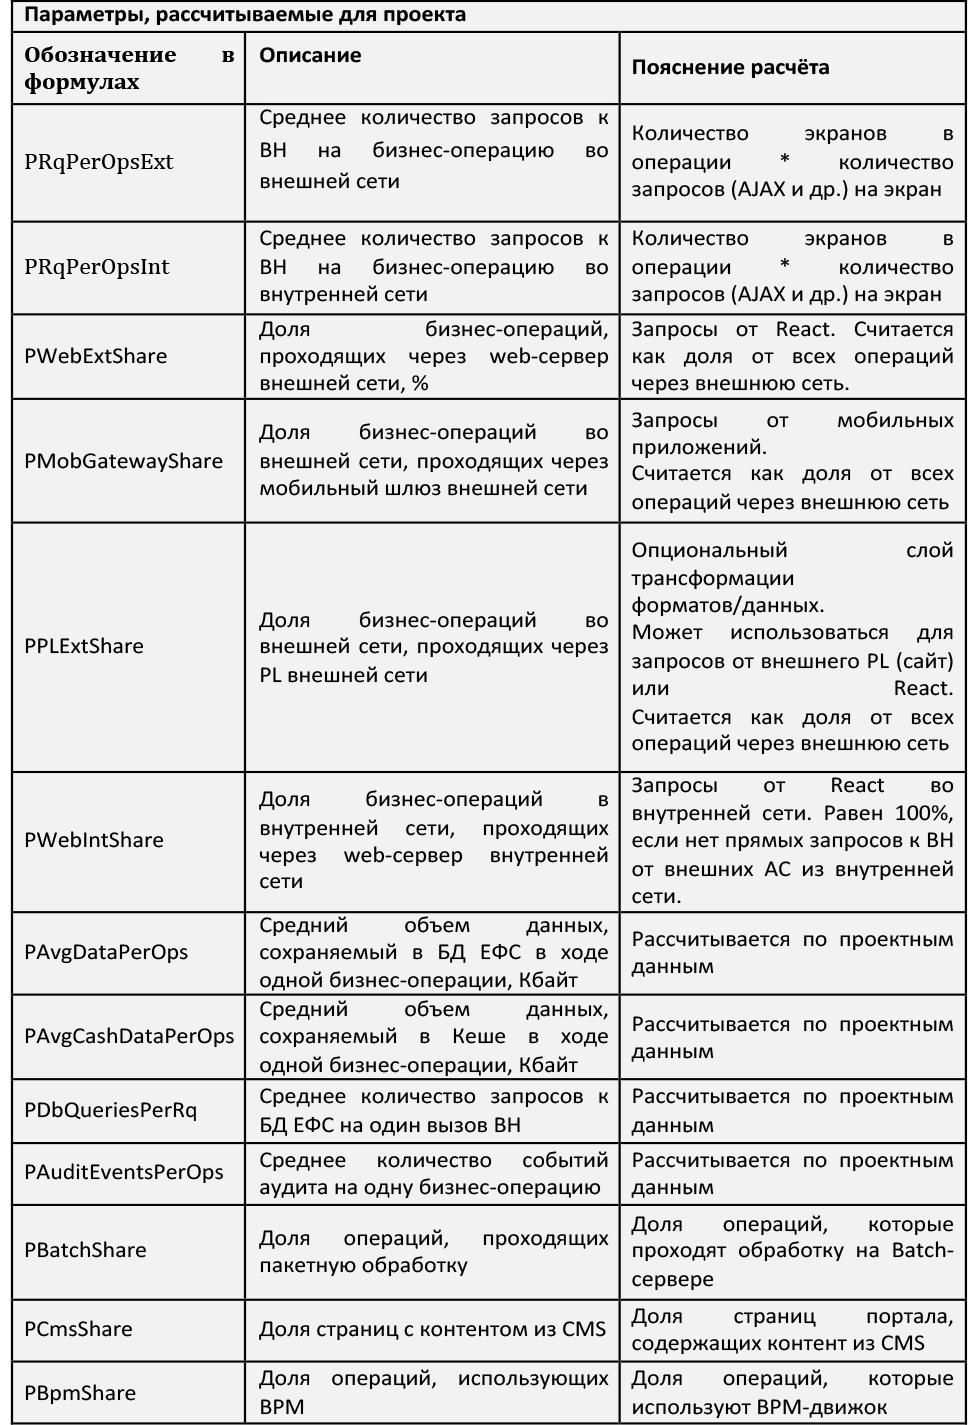
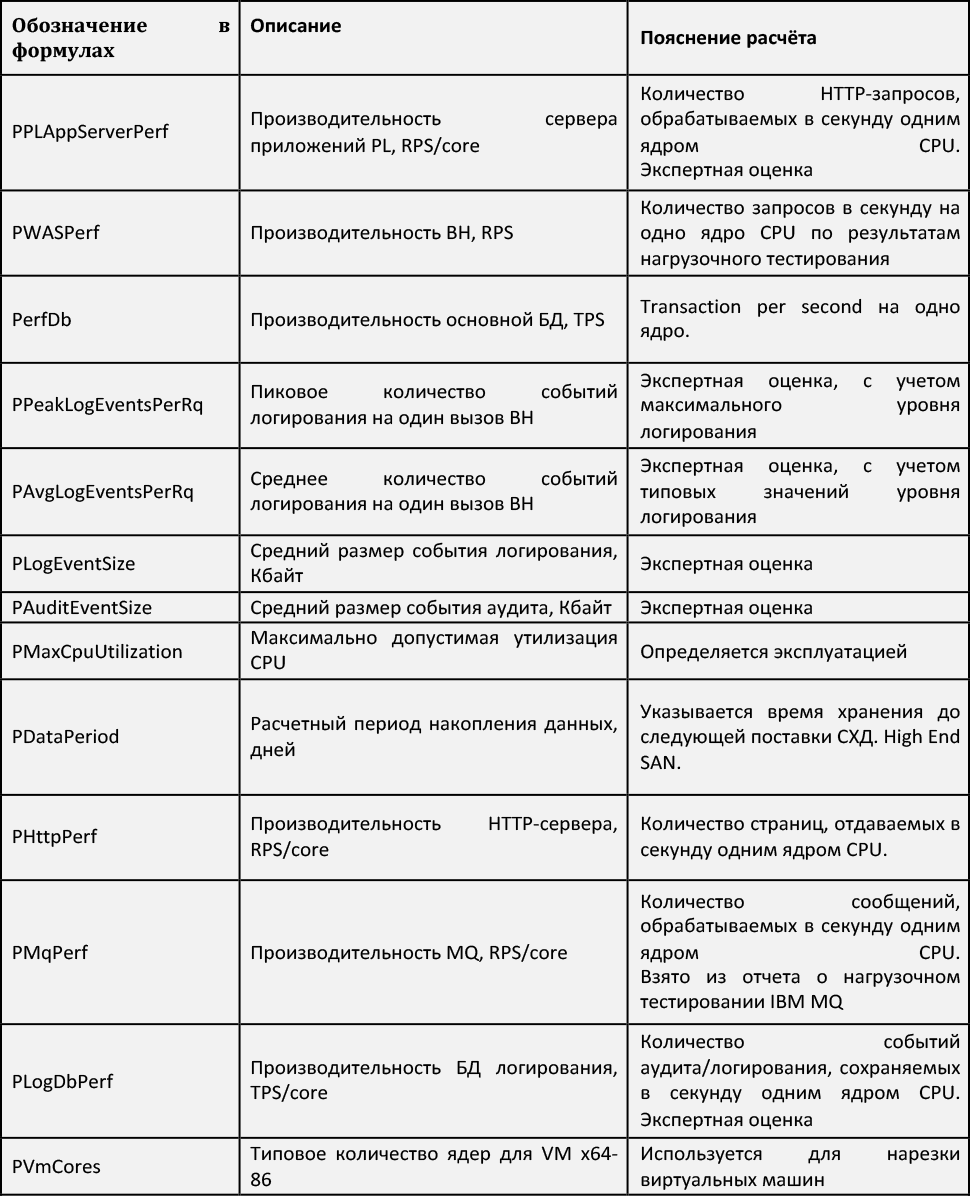
Model parameters:
Estimated coefficients
The table contains a description of the coefficients for which we have developed values. If interested, ask questions in the comments - share expert assessments.
Section 3. Calculation Model
A calculation model with calculation formulas that displays input data and parameters in the final estimates for each position.
We describe a simplified sizing model. It reduced the set of positions and does not reflect the multiblock organization of the industrial environment. Simplifications are made in order not to overload the article with aspects that are not interesting if your business does not have Sberbank scales. Multi-block architecture is a topic for a separate article - we will talk about it in other posts.
Application servers and web servers are allocated for each application service. We do not combine different application services in order to exclude mutual influence on failures or during maintenance. Databases are common and are considered for financial justification and forecasting.
Below are the formulas that we use for the calculation.
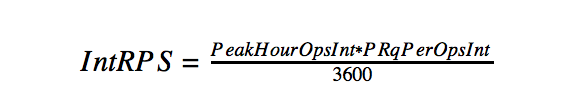
- Peak number of requests per second on the internal network:
It is considered as a multiplication of the peak number of users by the number of requests per second.
- Peak number of requests per second on the external network:
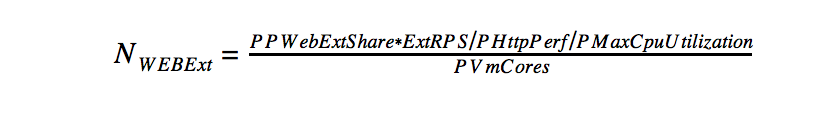
- Calculate the number of web servers.
This calculation includes the distribution of statics, query routing and caching for the internal network.
Number of intranet web servers
- Number of Web servers on the external network
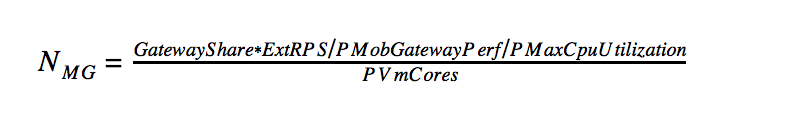
- Mobile External Gateway
- Presentation logic in the external network
- Presentation logic in the internal network
- Calculation of application servers for business logic
- MQ (audit + logging + point-to-point integration)
- Distributed internal cache
- DBMS Calculation
- The number of CPU DB
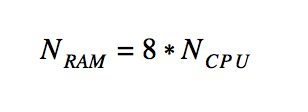
- RAM DB number
- DB size
At the output of the sizing model, we get an estimate of "iron" for the industrial environment.
In world practice, there are three main models of sizing:
- Custom model
Model based on the analysis of the number of simultaneously working users in the system and their behavior. This model is focused on companies that have general information about the number of users and their behavior in the information system.
- Transactional model
Model based on the analysis of transactions, the amount of data in the IP, which accounts for one user or group of users. This model is focused on companies that have accurate data on the quantitative characteristics of employees in the IS. This means that the company has an IT infrastructure, the company is at the stage of implementing a system for automating business processes or improving them.
- Test model
Model based on performance tests. This model is focused on companies that have a clear plan for the implementation of business applications with a detailed study of the details. These are mainly companies that have already implemented any system for automating business processes, but wish to expand the functionality of the system. Or the existing IT infrastructure does not withstand the current load.
In the EFS program, we have a combo from the “Transactional Model” and “Test Model”. Since we have information about the amount of peak load of business operations, but also we are guided by the indicators obtained from the conducted load testing. But there are special cases when new functionality is introduced in the ESF, which was not in other systems, and we receive the expected data at the entrance, then we act by analogy with the “User Model”.
Let's talk, and what model do you use?
Source: https://habr.com/ru/post/337676/
All Articles