Kaggle: how our nets considered sea lions in the Aleutian Islands
Hello colleagues!
On June 27, the Kaggle Sea Lion (Sea Lion) counting competition on NOAA Fisheries Steller Sea Lions Population Count ended. It competed 385 teams. I want to share with you the story of our participation in Challenger and (almost) victory in it.
A small lyrical digression.
As many already know, Kaggle is a platform for conducting online competitions in Data Science. And recently, there began to appear more and more tasks from the field of computer vision. For me, this type of task is the most fascinating. And the Steller Sea Lions Population Count competition is one of them. I will narrate with the expectation of a reader who knows the basics of deep learning in relation to pictures, so I will not explain many things in detail.
A few words about yourself. I study in graduate school at the University of Heidelberg in Germany. I am engaged in research in the field of deep learning and computer vision. The page of our group CompVis .
I wanted to participate in the rating competition on Kaggle with prizes. On this case, I was also shot down by Dmitry Kotovenko , who at that time was doing an internship in our research group. It was decided to participate in the competition in computer vision.
At that time I had a certain experience of participating in competitions at Kaggle, but only in non-ranking ones, for which they do not give either medals or experience points (Ranking Points). But I had a fairly extensive experience with imaging through deep learning. Dima had experience at Kaggle in rating competitions, and had 1 bronze medal, but he was just starting to work with computer vision.
We faced a difficult choice of 3 competitions: the prediction of uterine cancer on medical images , the classification of satellite images from the forests of the Amazon, and the calculation of sea lions on aerial photographs. The first was dropped due to visually not very pleasant pictures, and between the second and the third was chosen the third because of the earlier deadline.
Formulation of the problem
In connection with a significant decrease in the sea lions population in the western Aleutian Islands (owned by the USA) over the past 30 years, scientists from the NOAA Fisheries Alaska Fisheries Science Center keep a constant record of the number of individuals using aerial photographs from drones. Until that time, the individuals were counted on photographs by hand. It took biologists up to 4 months to calculate the number of sea lions in the thousands of photographs received by NOAA Fisheries every year. The task of this competition is to develop an algorithm for automatic calculation of sea lions on aerial photographs.
All Sivuchi are divided into 5 classes:
- adult_males - adult males (
 ),
), - subadult_males - young males (
 ),
), - adult_females - adult females (
 ),
), - juveniles - teenagers (
 ),
), - pups - cubs (
 ).
).
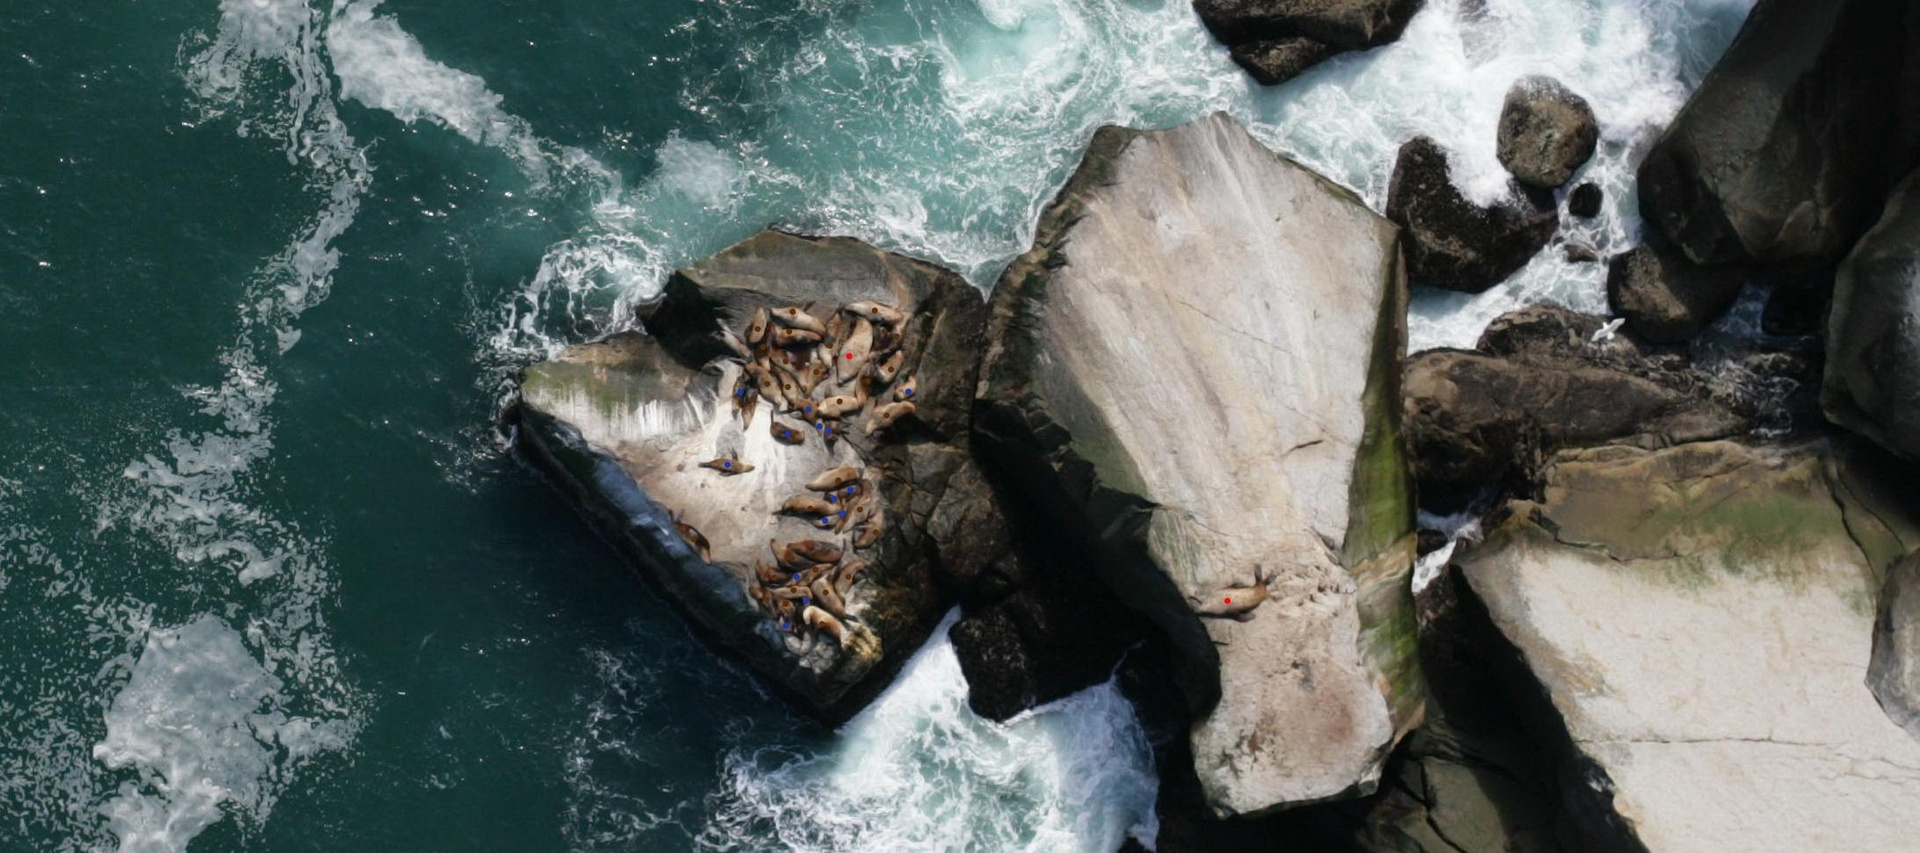
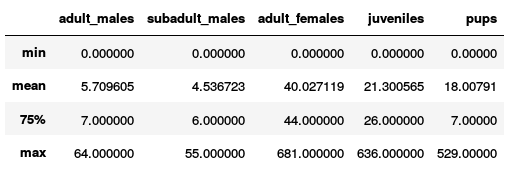
948 training pictures are given, for each of which Ground Truth knows the number of individuals of each class. It is required to predict the number of individuals by classes on each of the 18641 test images. Here is an example of some parts from dataset.
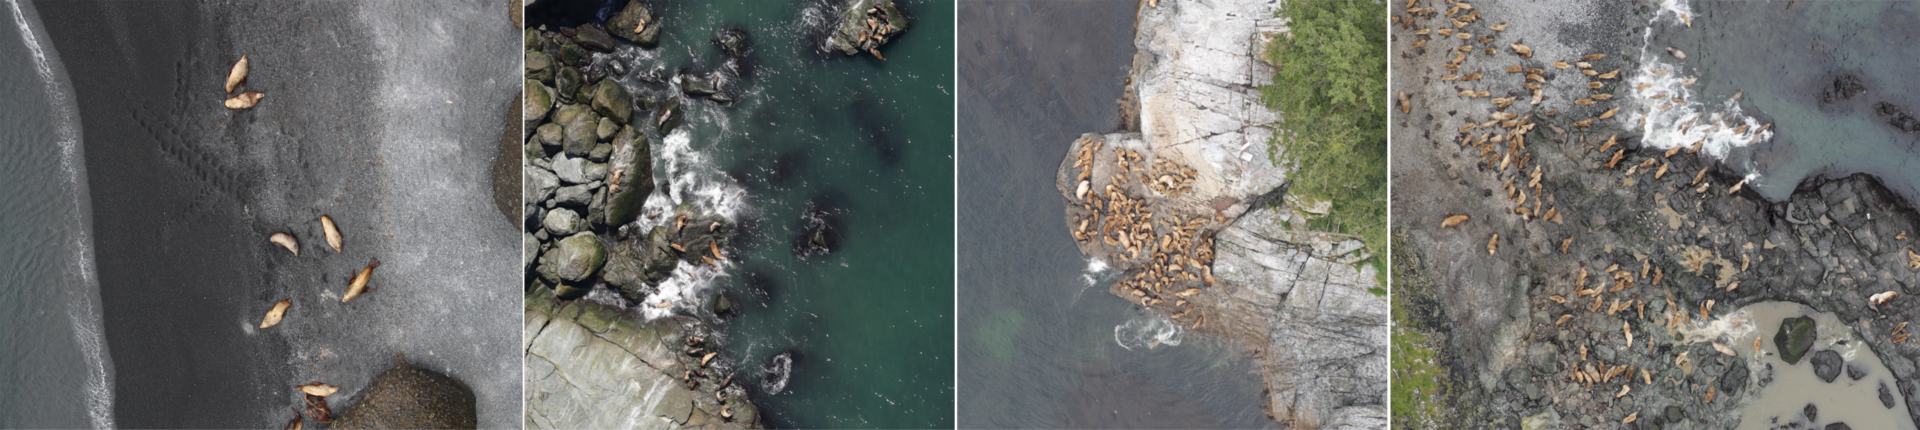
Pictures of different resolutions: 4608x3456 to 5760x3840. The quality and scale is very diverse, as can be seen from the example above.
The position on the leaderboard is determined by the RMSE error averaged over all test images and over the classes.
As a bonus, the organizers provided copies of training images with sea lions marked with dots of different colors. Each color corresponded to a specific class. All these points were hand-labeled by someone else (I hope, by biologists), and they were not always clearly in the center of the animal. That is, in fact, we have a rough position of each individual, given by one point. It looks like this.
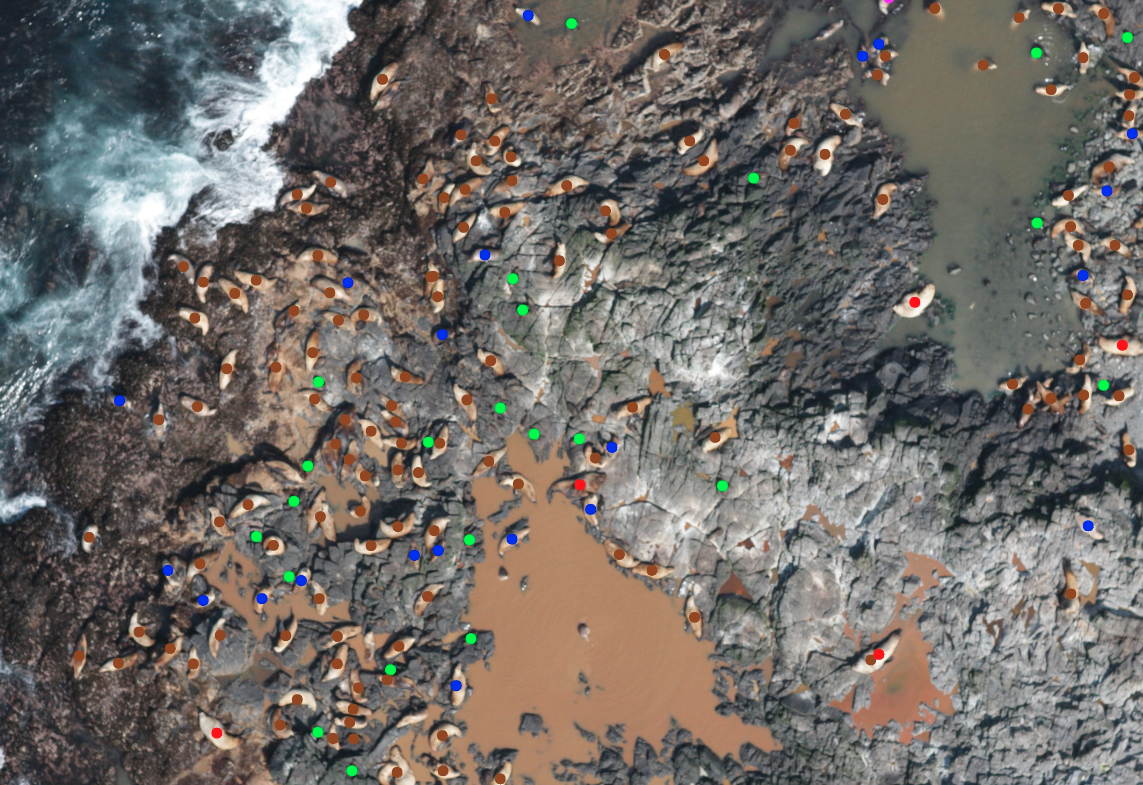
(image credits to bestfitting)
The most frequent sea lion classes are females ( ), teenagers ( ) and cubs ( ).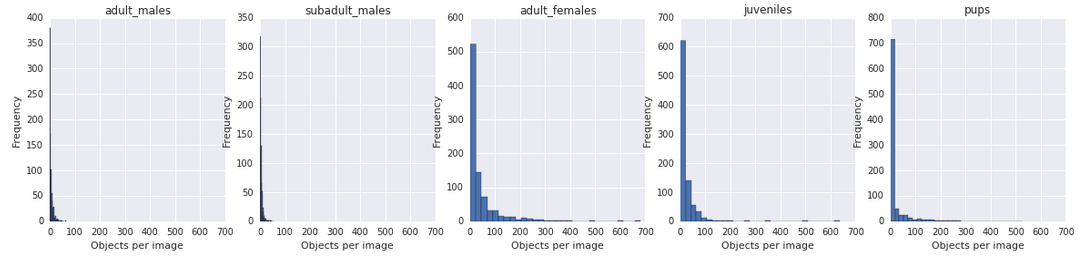
Problems
Here I will briefly list what were the problems with the data, and with the task as a whole.
- Noisy markup. Not all training pictures were marked up with all sea lions (often biologists missed those swimming in the water).
- There is no clear separation between pairs of classes adult_males and subadult_males , adult_females and juveniles . We do not always even with our eyes can understand where the female is and where the teenager is. The same problem with adults and young males. The biologist from NOAA answered the question “how did you mark them?” At the forum that classes were often distinguished only by behavioral signs. For example, adult males are surrounded by a multitude of females (Sivuchi live in harems), while young, not yet successful, are forced to huddle alone away from everyone.
- It is difficult to distinguish a cub from a wet stone. They are several times smaller than other individuals.
- No segmentation masks - only the rough position of the animals. Frontal approach to the segmentation of objects is not applicable.
- Different scales of images in general. Including, by eye, the scale on the training images is less than in the test images.
- The task of counting random objects (not people) is not very covered in scientific articles. Usually everyone counts people in the photos. About animals, and especially from several classes, no publications were found.
- A huge number of test images (18641) of high resolution. The prediction took from 10 to 30 hours on one Titan X.
Moreover, most of the test images are added solely in order to avoid that participants manually annotate the test. That is, the predictions on some of them did not affect the final score.
How we solved
In Germany, as in Russia, this year there was a big weekend for May 1. The free days from Saturday to Monday turned out to be more suitable than ever in order to begin to dive into the task. The competition has lasted for more than a month. It all started when Dima Kotovenko and I read the condition on Saturday.
The first impression was controversial. It is a lot of data, there is no settled way how to solve such problems. But it fueled interest. Well, not everything is “to pack xgboost .” The goal I set myself was rather modest - just get into the top 100 and get a bronze medal. Although then the goals changed.
The first 3 days were spent on data processing and writing the first version of the pipeline. One kind man, Radu Stoicescu , laid out a kernel that converted points on training images into coordinates and a sea lion class. It's great that you didn't have to waste your time on this. I made the first submit only one week after the start.
Obviously, this problem cannot be solved head-on with semantic segmentation, as there are no Ground Truth masks. It is necessary either to generate coarse masks by yourself or to train in the spirit of weak supervision. I wanted to start with something simpler.
The task of counting the number of objects / people is not new, and we began to look for similar articles. Several relevant works were found, but all about people counting CrowdNet , Fully Convolutional Crowd Counting , Cross-scene Crowd Counting via Deep Convolutional Neural Networks . They all had one common idea, based on Fully Convolutional Networks and regressions. I started with something similar.
The idea of crowd counting on the fingers
We want to learn how to predict hitmaps (2D matrices) for each class, but such that it would be possible to sum up the values in each of them and get the number of class objects.
To do this, generate the Grount Truth hitmaps as follows: in the center of each object, draw a Gaussian. This is convenient because the integral of the Gaussians is 1. We get 5 hitmaps (one for each of the 5 classes) for each picture from the training sample. It looks like this.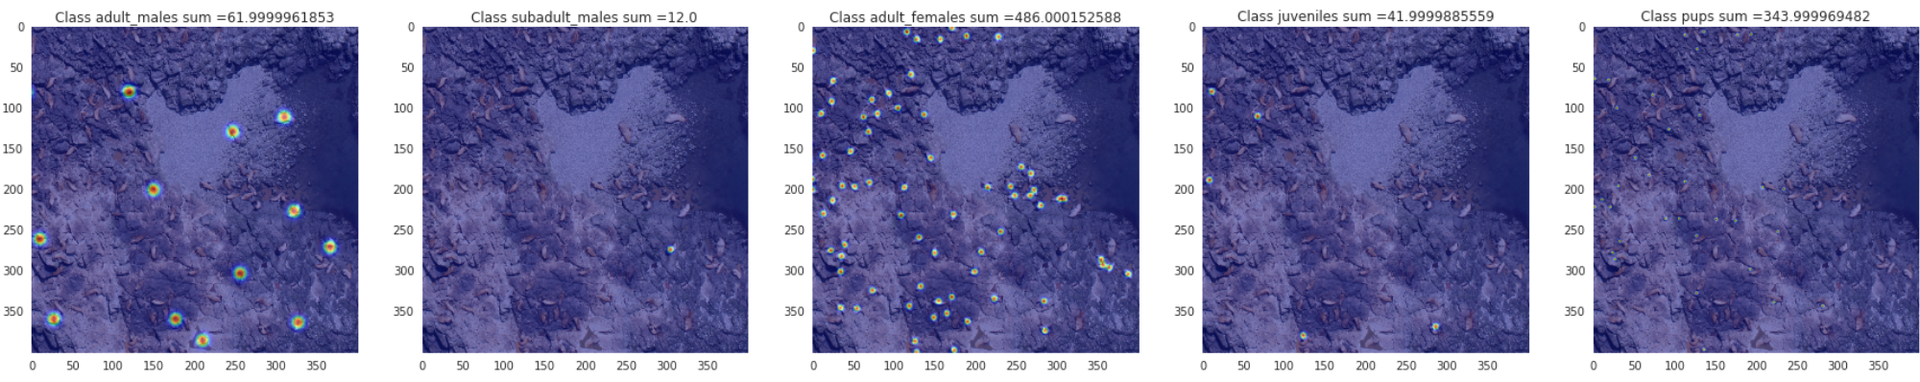
Zoom
The standard deviation of the Gaussians for different classes put it in the eye. For males - more, for young - less. The neural network (here and further in the text, I mean the convolutional neural network) takes the input images, cut into pieces (tiles) of 256x256 pixels, and spits out 5 hitmaps for each tile. The loss function is the Frobenius norm of the difference between the predicted hitmaps and the Ground Truth hitmaps, which is equivalent to the L2 norm of the vector obtained by vectoring the difference of the hitmaps. This approach is sometimes called Density Map Regression . To get the total number of individuals in each class, we summarize the values in each hitmap at the output.
| Method | Public Leaderboard RMSE |
|---|---|
| Baseline 1: predict everywhere 0 | 08.29704 |
| Baseline 2: predict the average for every train | 26.83658 |
| My Density Map Regression | 25.51889 |
My decision, based on Density Map Regression , was a little better than baseline and yielded 25.5. It turned out somehow not very.

In tasks on sight, it is very useful to look with the eyes on what your network has created, revelations happen. That's exactly what I did. I looked at the network predictions - they degenerate to zero in all but one class. The total number of animals was predicted all the way, but all the sea lions were nets of the same class.
The original problem that was solved in the articles is to count the number of people in a crowd, that is, there was only one class of objects. Probably, Density Map Regression is not a good choice for a multi-class task. And everything is aggravated by a huge variation in the density and scale of objects. I tried changing L2 to L1 loss function and weighing classes, all of which did not greatly affect the result.
There was a feeling that the L2 and L1 loss functions do something wrong in case of mutually exclusive classes, and that the pixel-by-pixel cross-entropy loss function may work better. This gave me the idea to train the network to segment individuals with a pixel-by-pixel cross-entropy loss function. As a Ground Truth mask, I drew squares centered on previously obtained object coordinates.
But then a new problem appeared. How to get the number of individuals from segmentation? In the ODS chatika, Konstantin Lopukhin admitted that he uses xgboost to regress the number of sea lions over a set of features, calculated by masks. We wanted to figure out how to make everything end-to-end using neural networks.
In the meantime, while I was doing crowd counting and segmentation, Dima earned a simple orange approach. He took the VGG-19 , trained on the Imagenet classification, and predicted the number of sea lions on the tile. He used the usual L2 loss function. It turned out as always - the simpler the method, the better the result .
So, it became clear that ordinary regression does its job and does well. The idea of segmentation was happily postponed until better times. I decided to train VGG-16 for regression. Prisobachil at the end of the output layer for regression on 5 classes of sea lions. Each output neuron predicted the number of individuals of the corresponding class.
I came out sharply in the top 20 with RMSE 20.5 on the public leaderboard.

By this time, goal-setting has undergone minor changes. It became clear that it makes sense to aim not at the top 100, but at least at the top 10. It did not seem to be something unattainable.
It turned out that on the test sample, many of the pictures were of a different scale; the sea lions looked larger on them than on the train. Kostya Lopukhin (thanks to him for this) wrote in the ODS slak that reducing the test images for each dimension by 2 times gave a significant increase in the public leaderboard.
But Dima, too, does not sew a hoop, he twirled something in his VGG-19 , reduced the pictures and came out on the 2nd place with ~ 16 soon.
Selection of network architecture and hyperparameters
(image credits to Konstantin Lopuhin)
With the loss function, we all understand. Time to start experimenting with deeper networks. VGG-19, ResnetV2-101, ResnetV2-121, ResnetV2-152 and heavy artillery - Inception-Resnet-V2 were used .
Inception-Resnet-V2 is an architecture invented by Google, which is a combination of tricks from Inception architectures (inception blocks) and from ResNet architectures (residual connections). This network is pretty much deeper than the previous ones and this monster looks like this.
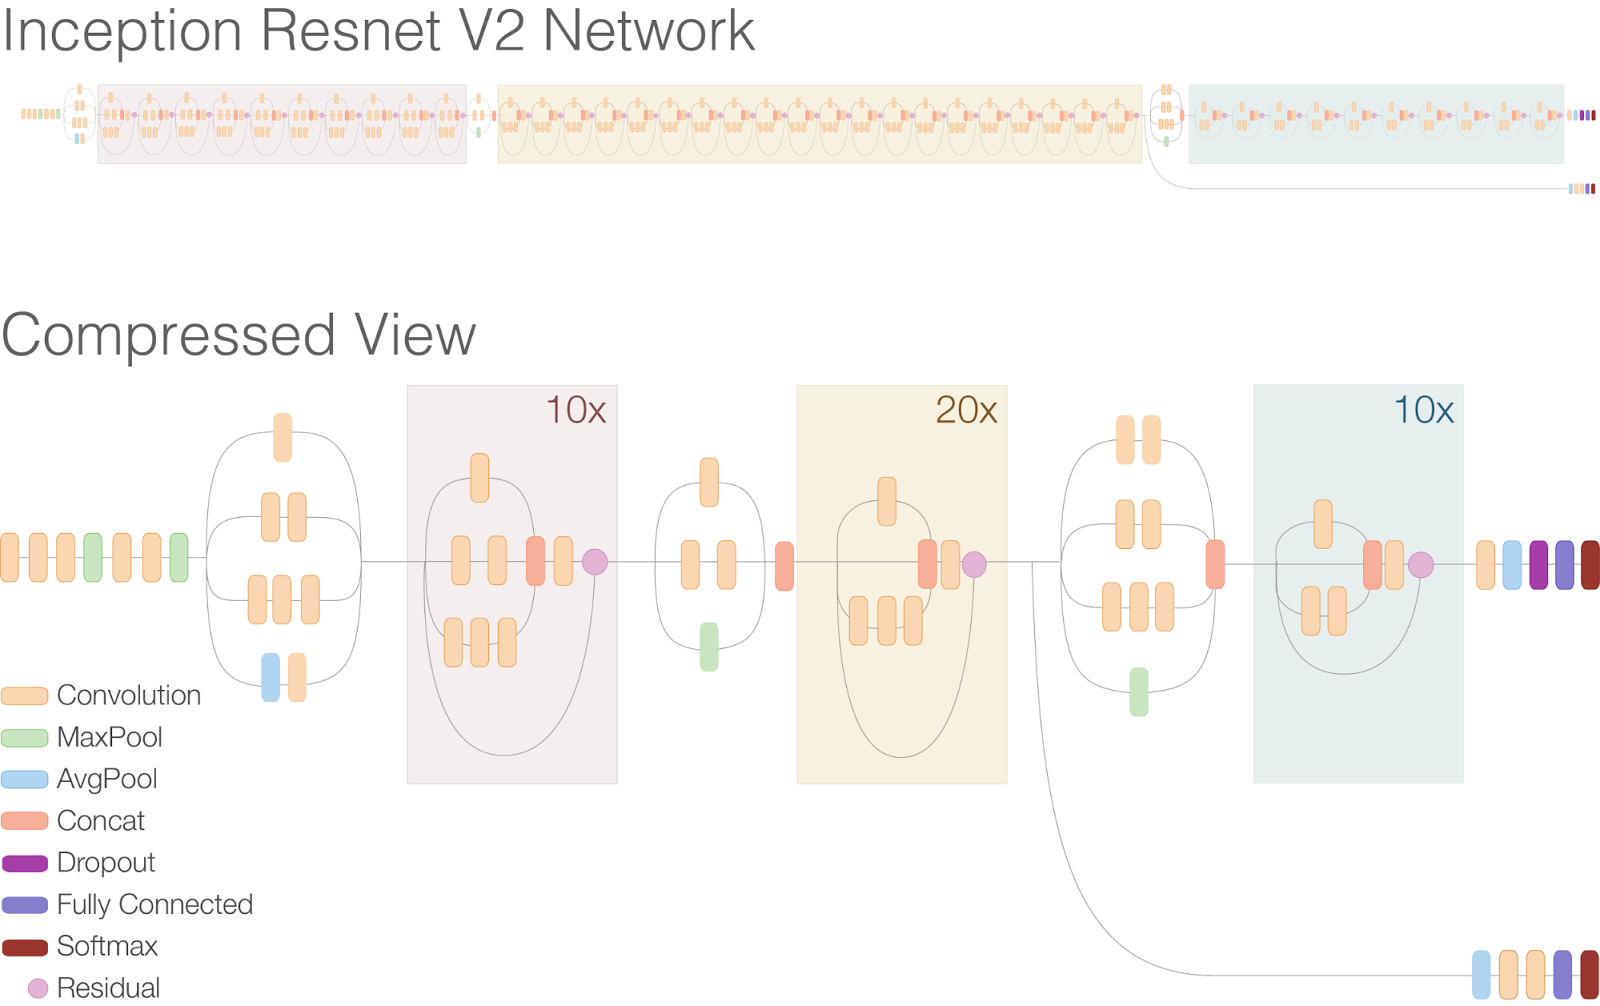
(image from research.googleblog.com)
In the article "Inception-v4, Inception-ResNet and the Impact of Residual Connections on Learning", the guys from Google show that this architecture gave at that time a state of the art on Imagenet without using ensembles.
In addition to the architecture itself, I had to sort out:
- various sizes of input tiles: from 224x224 to 512x512 pixels;
- type of pooling after convolutional layers: sum-pooling or average-pooling ;
- the number of additional FC -sheets before the final: 0, 1 or 2;
- number of neurons in additional FC layers: 128 or 256.
The best combination turned out to be: Inception-Resnet-V2-BASE + average-pooling + FC — layer for 256 neurons + Dropout + final FC — layer for 5 neurons. Inception-Resnet-V2-BASE denotes a portion of the original network from the first to the last convolutional layer.
The best size of the input tile was 299x299 pixels.
Image augmentation
For training pictures, we did a typical set of augmentations for CV tasks.
Each tile was applied:
- Random flips from left to right and top to bottom;
- random rotations at angles that are multiples of 90 degrees;
- random scaling 0.83 - 1.25 times.
We did not augment the color, as it is a rather slippery track. Frequently sea lions could only be distinguished from the landscape by color.
Test time augmentation we did not. Because the prediction on all test pictures and so took half a day.
Continuation of a story
At some point, while I went through the hyperparameters and network architectures, we teamed up with Dima Kotovenko . At that moment I was the 2nd place, Dima is on the 3rd. To challenge the Chinese in the wrong direction, the team was called "DL Sucks" .
We were united, because it would be unfair to take a medal from someone, because with Dima we actively discussed our decisions and exchanged ideas. Kostya was very happy about this event, we freed him a prize. From the 4th he got to the 3rd.
For the last 3-4 weeks of the competition, we kept tightly on the 2nd place on the public leaderboard, one-tenth each, improving one-thousandth quickly by going through hyperparameters and stacking models.
It seemed to us that a 2-fold reduction in all test images was rough and rough. I wanted to do everything beautifully so that the network would predict how to scale each of the images. Dima invested in this idea quite a lot of time. In short, he tried to predict the scale of sea lions according to the picture, which is equivalent to predicting the altitude of the drone during the shooting. Unfortunately, due to the lack of time and a number of problems that we encountered, this was not brought to an end. For example, many pictures contain only one sea lion, and most of the space is sea and stones. Therefore, not always, looking only at the rocks or the sea, it is possible to understand from what height the picture was taken.
A couple of days before the deadline, we collected all the best models and made an ensemble of 24 neural networks. All models had the best Inception-Resnet-V2 architecture, which I described earlier. The models differed only in how aggressively we augmented the pictures, on what scale of test images the predictions were made. Outputs from different networks were averaged.
The team "DL Sucks" finished the competition on the 2nd place on the public leaderboard, which could not but rejoice, since we were "in the money." We understood that everything can change on the private leaderboard and we can be thrown out of the top ten altogether. We had a decent gap with the 4th and 5th place, and this added to our confidence. This is how the position on the leaderboard looked:
1st place 10.98445 outrunner (Chinese 1)
2nd place 13.29065 We (DL Sucks)
3rd place 13.36938 Kostya Lopukhin
4th place 14.03458 bestfitting (Chinese 2)
5th place 14.47301 LeiLei-WeiWei (Team of two Chinese)
It remained to wait for the final results ...
And what would you think? The Chinese have bypassed us! We were moved from 2nd to 4th place. Well, nothing, but got a gold medal;)
The first place, as it turned out, was taken by another Chinese, alpha goose outrunner . And his decision was almost like ours. He trained VGG-16 with an additional fully connected layer for 1024 neurons to predict the number of individuals in classes. What brought him into the first place was the ad-hoc increase in the number of teenagers by 50% and the decrease in the number of females by the same number, multiplying the number of cubs by 1.2. Such a trick would lift us up several positions.
Final position of places:
1st place 10.85644 outrunner (Chinese 1)
2nd place 12.50888 Kostya Lopukhin
3rd place 13.03257 (Chinese 2)
4th place 13.18968 We (DL Sucks)
5th place 14.47301 Dmitro Poplavsky (also in ODS) in a team with 2 others
A few words about other solutions.
There is a reasonable question - is it possible to train the detector and then count the bouncing boxes of each class? The answer is - you can. Some guys did. Alexander Buslaev (13th place) trained SSD , and Vladimir Iglovikov (49th place) - Faster RCNN .
Example prediction of Vladimir :

(image credits to Vladimir Iglovikov)
The disadvantage of this approach is that he is greatly mistaken when the sea lions in the photo are very close to each other. And the presence of several different classes also aggravates the situation.
The decision based on segmentation with the help of UNet also has a place to be and brought Konstantin to the 2nd place. He predicted the small squares that he drew inside each sea lion. Next - dancing with a tambourine. According to the predicted hitmaps, Kostya calculated various features (areas above specified thresholds, the number and probabilities of blobs) and fed them to xgboost to predict the number of individuals.

(image credits to Konstantin Lopuhin)
More information about his decision can be viewed on youtube .
At the 3rd place ( bestfitting ), the decision is also based on UNet. I will describe it in a nutshell. The guy manually marked out the segmentation masks for 3 images, trained UNet and predicted the masks on another 100 images. I corrected the masks of these 100 images with my hands and re-trained the network on them. In his words, it gave a very good result. Here is an example of his prediction.

(image credits to bestfitting)
To obtain the number of individuals by masks, he used morphological operations and a blob detector.
Conclusion
So, the initial goal was to get at least in the top 100. We have fulfilled the goal and even exceeded it. Many different approaches, architectures and augmentations have been tried. It turned out that the simpler method is better. And for networks, oddly enough, deeper is better. Inception-Resnet-V2 after dopilivaniya, trained to predict the number of individuals by class, gave the best result.
In any case, it was a useful experience in creating a good solution to a new task in a short time.
In graduate school, I mainly research Unsupervised Learning and Similarity Learning . And to me, even though I do computer vision every day, it was interesting to work with some new task, not related to my main focus. Kaggle gives you the opportunity to better study different Deep Learning frameworks and try them in practice, as well as implement known algorithms, see how they work on other tasks. Does Kaggle interfere? It is unlikely that it interferes, rather it helps, broadens the mind. Although he takes enough time. I can say that I spent behind this competition 40 hours a week (just like the second job), doing every day in the evenings and on weekends. But it was worth it.
Who read, thank you for your attention and success in future competitions!
My profile on Kaggle: Artem.Sanakoev
A brief technical description of our Kaggle solution: link
Solution code on github: link
')
Source: https://habr.com/ru/post/337548/
All Articles