How does the video processor
[Approx. Lane: The original article is called GPU Performance for Game Artists, but as it seems to me, it will be useful for anyone who wants to have a general understanding of the video processor's work]
For the speed of the game are responsible for all team members, regardless of position. We, 3D programmers, have ample opportunities to control the performance of the video processor: we can optimize shaders, sacrifice picture quality for speed, use more cunning rendering techniques ... However, there is an aspect that we cannot fully control, and this is the graphic resources of the game.
We hope that artists will create resources that not only look good, but will also be effective in rendering. If artists know a little more about what is happening inside the video processor, this can have a big impact on the frame rate of the game. If you're an artist and want to understand why aspects such as draw calls, levels of detail (LOD) and MIP textures are important for performance, then read this article. To take into account the impact that your graphics resources have on game performance, you need to know how polygonal meshes come from the 3D editor on the game screen. This means that you need to understand the work of the video processor, the chip, the graphics card manager and the person responsible for the three-dimensional rendering in real time. Armed with this knowledge, we will look at the most frequent performance problems, analyze why they are a problem, and explain how to deal with them.
Before we begin, I would like to emphasize that I will intentionally simplify a lot for the sake of brevity and clarity. In many cases, I summarize, describe only the most typical case, or simply drop some concepts. In particular, for the sake of simplicity, the ideal version of the video processor described in the article is most similar to the previous generation (DX9 era). However, when it comes to performance, all the arguments below are fully applicable to modern PC hardware and consoles (but perhaps not to all mobile video processors). If you understand everything written in the article, it will be much easier for you to cope with variations and difficulties that you will encounter in the future if you want to understand more deeply.
')
Part 1: bird flight rendering pipeline
To display a polygonal mesh on the screen, it must pass through a video processor for processing and rendering. Conceptually, this path is very simple: the grid is loaded, the vertices are grouped into triangles, the triangles are converted into pixels, each pixel is assigned a color, and the final image is ready. Let's take a closer look at what happens at each stage.
After exporting the grid from the 3D editor (Maya, Max, etc.), the geometry is usually loaded into the game engine in two parts: a vertex buffer (Vertex Buffer, VB) containing a list of grid vertices with their associated properties (position, UV coordinates , normal, color, etc.), and an index buffer (Index Buffer, IB), which lists the vertices from VB, connected in triangles.
Together with these geometry buffers, the mesh is also assigned a material that determines its appearance and behavior in various lighting conditions. For a video processor, this material takes the form of specially written shaders — programs that define the way vertices are processed and the color of the final pixels. When choosing a material for the mesh, you need to adjust various parameters of the material (for example, the value of the base color or the choice of texture for different maps: albedo, roughness, normal maps, etc.). All of them are passed to shader programs as input.
The mesh and material data is processed by various stages of the video processor pipeline to create the pixels of the final target render (the image into which the video processor is writing). This target render can later be used as a texture in subsequent shaders and / or displayed on the screen as the final image of the frame.
For the purposes of this article, the important parts of the video processor pipeline are the following, from top to bottom:
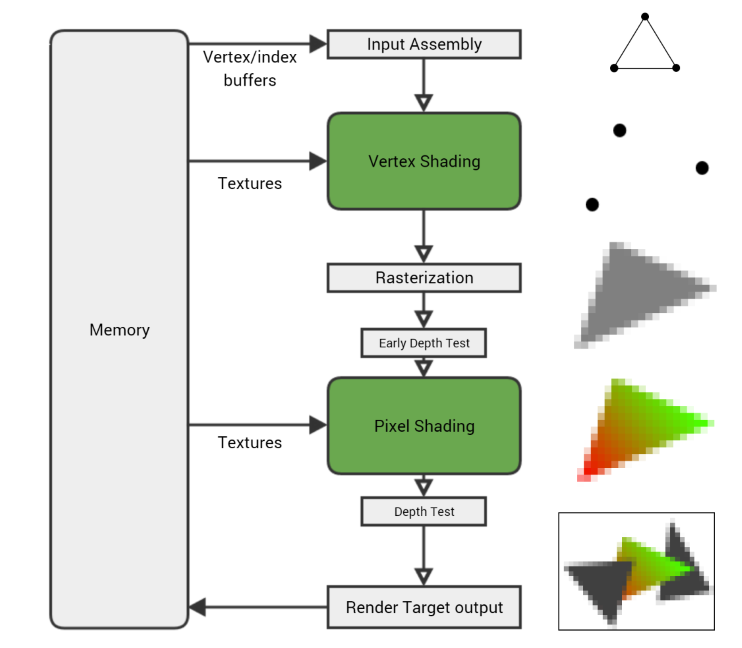
- Input Assembly. The video processor reads the vertex and index buffers from memory, determines how the triangle-forming vertices are connected, and transfers the rest to the pipeline.
- Vertex Shading (Vertex Shading). The vertex shader is executed for each of the grid vertices, processing on a separate vertex at a time. Its main task is to transform the vertex, get its position and use the current camera settings and the viewing area to calculate its location on the screen.
- Rasterization (Rasterization). After the vertex shader is executed for each vertex of the triangle and the video processor knows where it appears on the screen, the triangle is rasterized - converted to a set of individual pixels. The values of each vertex are UV coordinates, vertex color, normal, etc. - interpolated by the pixels of the triangle. Therefore, if one vertex of the triangle is black and the other is white, then the pixel rasterized in the middle between them will receive the interpolated gray color of the vertices.
- Pixel Shading. Then, for each rasterized pixel, a pixel shader is executed (although technically at this stage it is not a pixel, but a “fragment”, therefore sometimes a pixel shader is called fragmentary). This shader programmatically imparts a pixel color, combining material properties, textures, light sources, and other parameters to get a specific look. There are a lot of pixels (the target render with a resolution of 1080p contains more than two million), and each of them needs to be shaded at least once, so usually the video processor spends a lot of time on the pixel shader.
- Output target render (Render Target Output). Finally, the pixel is written to the target render, but before that it passes some checks to make sure it is correct. The depth test discards pixels that are deeper than the pixel already present in the target renderer. But if a pixel passes all checks (depth, alpha channel, stencil, etc.), it is recorded in the target render stored in memory.
There is much more action, but this is the main process: a vertex shader is executed for each vertex in the grid, each triangle vertex is rasterized into pixels, a pixel shader is executed for each rasterized pixel, and then the resulting colors are written into the target render.
Shader programs that specify the type of material are written in the shader programming language, for example, HLSL . These shaders are executed in the video processor in much the same way as normal programs are executed in the central processor — they receive data, execute a set of simple instructions for changing data, and output the result. But if CPU programs can work with any type of data, then shader programs are specifically designed to work with vertices and pixels. These programs are written in order to give the rendered object the appearance of the desired material - plastic, metal, velvet, leather, etc.
Let me give you a concrete example: here is a simple pixel shader that performs the calculation of the Lambert illumination (i.e., only simple diffusion, without reflections) for the color of the material and texture. This is one of the simplest shaders, but you do not need to understand it, just see what the shaders look like in general.
float3 MaterialColor; Texture2D MaterialTexture; SamplerState TexSampler; float3 LightDirection; float3 LightColor; float4 MyPixelShader( float2 vUV : TEXCOORD0, float3 vNorm : NORMAL0 ) : SV_Target { float3 vertexNormal = normalize(vNorm); float3 lighting = LightColor * dot( vertexNormal, LightDirection ); float3 material = MaterialColor * MaterialTexture.Sample( TexSampler, vUV ).rgb; float3 color = material * lighting; float alpha = 1; return float4(color, alpha); } A simple pixel shader that performs basic lighting calculations. Input data, such as MaterialTexture and LightColor, are transmitted by the central processor, and vUV and vNorm are vertex properties that are interpolated by a triangle during rasterization.
Here are the generated shader instructions:
dp3 r0.x, v1.xyzx, v1.xyzx rsq r0.x, r0.x mul r0.xyz, r0.xxxx, v1.xyzx dp3 r0.x, r0.xyzx, cb0[1].xyzx mul r0.xyz, r0.xxxx, cb0[2].xyzx sample_indexable(texture2d)(float,float,float,float) r1.xyz, v0.xyxx, t0.xyzw, s0 mul r1.xyz, r1.xyzx, cb0[0].xyzx mul o0.xyz, r0.xyzx, r1.xyzx mov o0.w, l(1.000000) ret The shader compiler gets the program shown above and generates such instructions that are executed in the video processor. The longer the program, the more instructions, that is, more work for the video processor.
Along the way, I’ll notice - you can see how the shader stages are isolated - each shader works with a separate vertex or pixel and does not need to know anything about the surrounding vertices / pixels. This is done intentionally, because it allows the video processor to process in parallel huge numbers of independent vertices and pixels, and this is one of the reasons why video processors process graphics so much faster than central processors.
Soon we will return to the pipeline to see why the work may slow down, but first we need to take a step back and see how the net and material get into the video processor. Here we will also meet the first performance barrier - the draw call.
CPU and draw calls
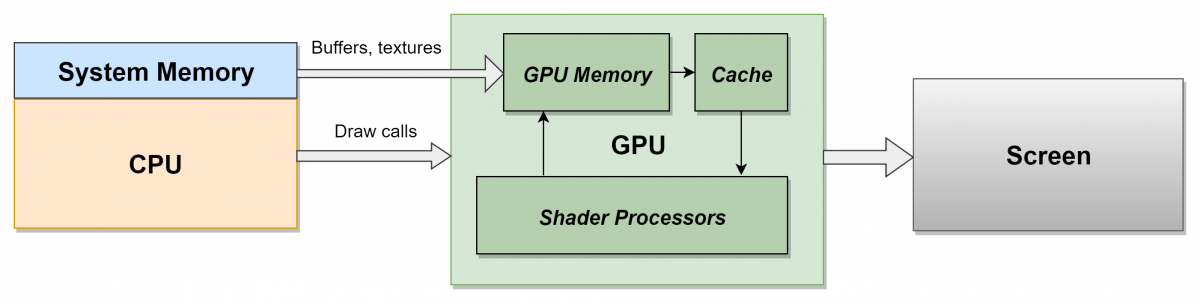
The video processor cannot work alone: it depends on the code of the game running in the main processor of the computer, the CPU, which tells it what to render and how. The central processing unit and the video processor are (usually) separate microcircuits operating independently and in parallel. To get the required frame rate - usually 30 frames per second - both the CPU and the video processor must do all the work of creating one frame in the allowed time (at 30fps it is only 33 milliseconds per frame).
To achieve this, the frames are often lined up : the CPU takes the entire frame for its work (processes AI, physics, user input, animation, etc.), and then sends instructions to the video processor at the end of the frame so that it can start working in next frame. This gives each of the processors a full 33 milliseconds to do the job, but the price is the addition of latency (delay) of a frame length. This can be a problem for very time-sensitive games, say, for first-person shooters — the Call of Duty series, for example, runs at 60fps to reduce the delay between player input and rendering — but usually the player doesn’t notice an extra frame.
Every 33 ms the final target render is copied and displayed on the screen in VSync - the interval during which it searches for a new frame to be displayed. But if the video processor is required to render a frame longer than 33 ms, then it skips this window of opportunity and the monitor does not get a new frame to display. This leads to flickering or pauses on the screen and a reduction in the frame rate, which must be avoided. The same result is obtained if the work of the CPU takes too much time - this leads to the skip effect, because the video processor does not receive commands quickly enough to perform its work in the allowed time. In short, a stable frame rate depends on the good performance of both processors: the central processor and the video processor.
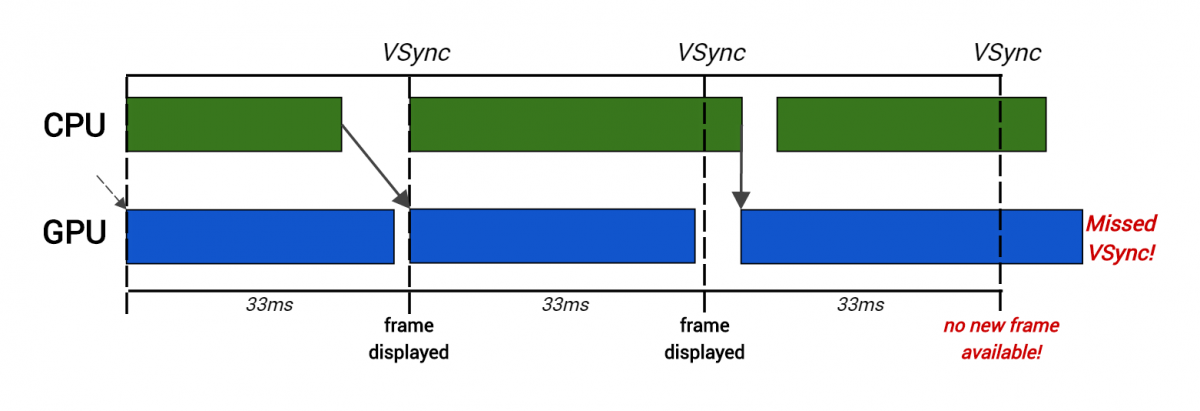
Here, creating rendering commands for the CPU took too much time for the second frame, so the video processor starts rendering later and skips VSync.
To display the grid, the CPU creates a draw call , which is a simple sequence of commands telling the video processor what to draw. In the process of passing the draw call through the video processor pipeline, it uses various configurable settings specified in the draw call (mainly specified by the material and the mesh parameters) to determine how the mesh is rendered. These settings, called the state of the video processor (GPU state) , affect all aspects of rendering and consist of everything that a video processor needs to know to render an object. Most important for us is that the video processor contains the current vertex / index buffers, the current vertex / pixel shader programs, and all shader input data (for example, MaterialTexture or LightColor from the shader code sample above).
This means that to change the state element of the video processor (for example, to replace the texture or switch shaders), you need to create a new draw call. This is important because these rendering calls are expensive for a video processor. It takes time to set the desired state changes of the video processor, and then to create a draw call. In addition to the work that the game engine needs to perform at each draw call, there are also costs for additional error checking and storing intermediate results. added by the graphics driver . This is an intermediate code layer. written by the manufacturer of the video processor (NVIDIA, AMD, etc.), which converts the draw call to low-level hardware instructions. Too many draw calls place a heavy burden on the CPU and lead to serious performance problems.
Because of this load, it is usually necessary to set the upper limit of the allowed number of draw calls per frame. If during the testing of gameplay this limit is exceeded, then it is necessary to take steps to reduce the number of objects, reduce the depth of rendering, etc. In games for consoles, the number of draw calls is usually limited to an interval of 2000-3000 (for example, for Far Cry Primal we aimed to have no more than 2500 frames per frame). This seems like a large number, but it also includes special rendering techniques — cascading shadows , for example, can easily double the number of draw calls in a frame.
As mentioned above, the state of the video processor can only be changed by creating a new draw call. This means that even if you created a single grid in the 3D editor, but in one half of the grid, one texture is used for the albedo map, and in the other half - the other texture, the grid will be rendered as two separate draw calls. The same is true when the grid consists of several materials: it is necessary to use different shaders, that is, to create several draw calls.
In practice, a very frequent source of state change, that is, additional draw calls, is the switching of texture maps. Usually the same material is used for the entire grid (and therefore the same shaders), but different parts of the grid have different sets of albedo / normal / roughness maps. In a scene with hundreds or even thousands of objects, it takes a lot of CPU time to use multiple draw calls for each object, and this greatly affects the frame rate in the game.
To avoid this, the following solution is often used — they combine all the texture maps used by the grid into one large texture, often called an atlas . Then the UV coordinates of the grid are adjusted in such a way that they search for the desired parts of the atlas, while the entire grid (or even several grids) can be rendered in one draw call. When creating an atlas, you need to be careful so that at low MIP levels the adjacent textures do not overlap, but these problems are less serious than the advantages of this approach for ensuring speed.
Texture Atlas from the Unreal Engine Infiltrator demo
Many engines support instancing , also known as batching or clustering. This is the ability to use a single draw call to render several objects that are almost the same in terms of shaders and states, and the differences in which are limited (usually their position and rotation in the world). Usually, the engine understands when you can render several identical objects using cloning, so if possible you should always try to use one object several times in the scene, rather than several different objects that you have to render in separate draw calls.
Another popular technique for reducing the number of draw calls is manual merging of several different objects with the same material in the same grid. It can be effective, but over-combining should be avoided, which can degrade performance by increasing the amount of work for the video processor. Even before creating draw calls, the engine's visibility system can determine if the object is on the screen at all. If not, then it is much less expensive just to skip it at this initial stage and not to spend on it drawing calls and video processor time (this technique is also known as visibility culling ). This method is usually implemented by checking the visibility of the object bounding the object from the point of view of the camera and checking whether it is blocked completely ( occluded ) in the field of visibility by other objects.
However, when several grids are combined into one object, their individual bounding volumes are joined into one large volume, which is large enough to hold each of the grids. This increases the likelihood that the visibility system will be able to see part of the volume, and therefore, consider the entire set of grids visible. This means that a draw call will be created, and therefore a vertex shader must be executed for each vertex of the object, even if only a few vertices are visible on the screen. This can lead to a waste of a large part of the video processor time, because most of the vertices as a result do not affect the final image. For these reasons, grid integration is most effective for groups of small objects that are close to each other, because, most likely, they are anyway will be visible on one screen.
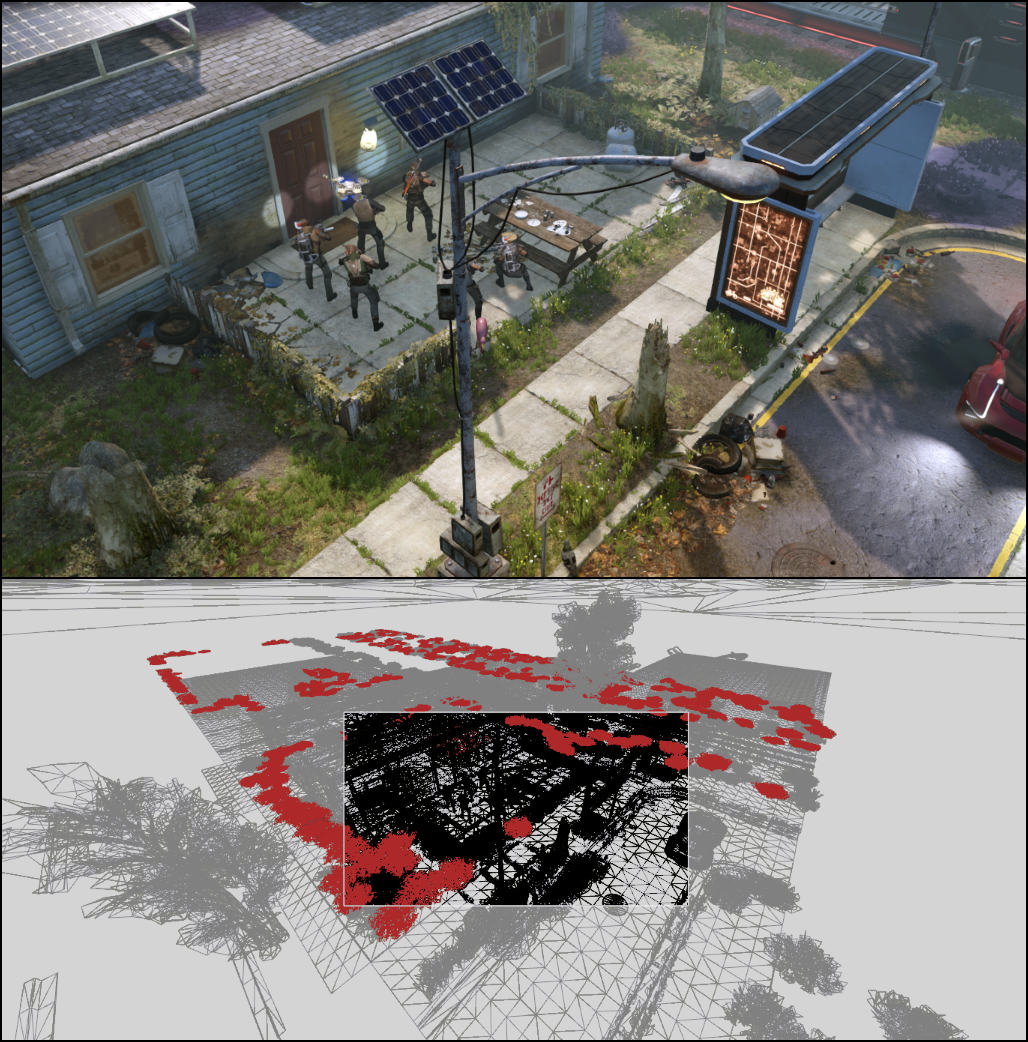
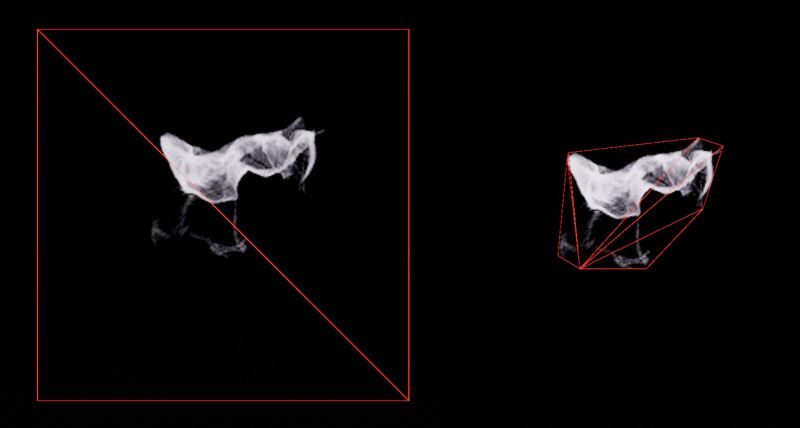
Frame from XCOM 2 made in RenderDoc. The skeleton view (below) shows in gray all the excess geometry transmitted to the video processor and located outside the scope of the game camera.
As a good example, let's take a frame from XCOM 2, one of my favorite games for the last couple of years. In the frame view, the entire scene is shown, transmitted by the engine to the video processor, and the black area in the middle is the geometry seen from the game camera. All surrounding geometry (gray) is invisible and will be clipped after the vertex shader is executed, that is, it will waste time on the video processor. In particular, look at the highlighted red geometry. These are several bushes grids connected and rendered in just a few render calls. The system of visibility has determined that at least some of the bushes are visible on the screen, so all of them are rendered and their vertex shader is executed, after which they are recognized that can be cut off (it turns out that most of them).
Understand correctly, I am not blaming XCOM 2 for this, I just played a lot of it while writing this article! In all games there is this problem, and there is always a struggle for a balance between the time spent by the video processor on more accurate checks of visibility, the cost of cutting off invisible geometry and the cost of a greater number of draw calls.
However, everything changes when it comes to the costs of drawing calls. As stated above, an important reason for these costs is the additional load created by the driver during conversion and error checking. This has been a problem for a very long time, but with most modern graphics APIs (for example, Direct3D 12 and Vulkan), the structure has been modified so as to avoid unnecessary work. Although this adds complexity to the game's rendering engine, it leads to less expensive rendering calls, which allows us to render far more objects than was possible before. Some engines (the most notable of them - the latest version of the Assassin's Creed engine) even went in a completely different direction and use the capabilities of modern video processors to control the rendering and effectively get rid of draw calls.
A large number of draw calls basically reduces the performance of the CPU. And almost all performance issues related to graphics are related to the video processor. Now we will find out what the “bottlenecks” are, where they arise and how to cope with them.
Part 2: the usual "bottlenecks" video processor
The first step in optimization is to search for an existing bottleneck , so that you can then reduce its impact or completely get rid of it. "Bottle neck" is the part of the conveyor that slows down all the work. In the example above, where there were too many expensive draw calls, the bottleneck was the central processing unit. Even if we performed optimizations that speed up the video processor, it would not affect the frame rate, because the CPU would still work too slowly and would not have time to create a frame in the required time.
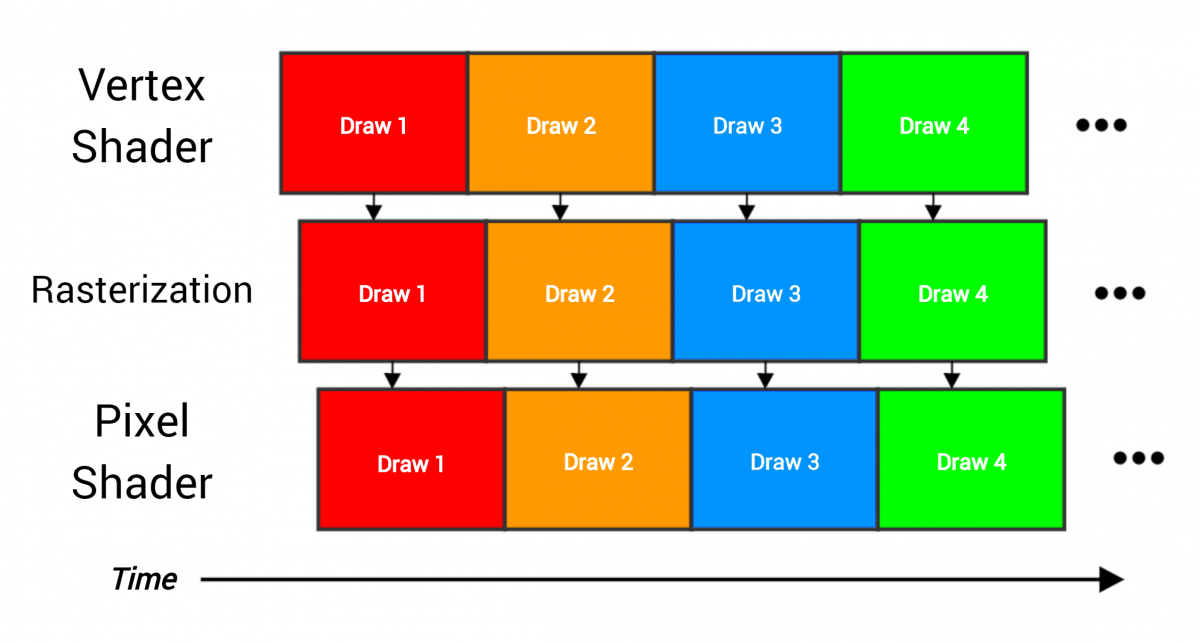
The pipeline passes four draw calls, each of which renders the entire grid containing many triangles. The stages overlap, because as soon as one part of the work ends, it can be immediately transferred to the next stage (for example, when three vertices are processed by the vertex shader, then the triangle can be passed for rasterization).
As an analogy of the video processor conveyor, an assembly line can be made. As soon as each stage finishes with its data, it transfers the results to the next stage and starts to perform the next part of the work. Ideally, each stage is busy working all the time, and the equipment is used fully and efficiently, as shown in the figure above — the vertex shader constantly processes the vertices, the rasterizer constantly rasterizes the pixels, and so on. But imagine if one stage takes much longer than the others:
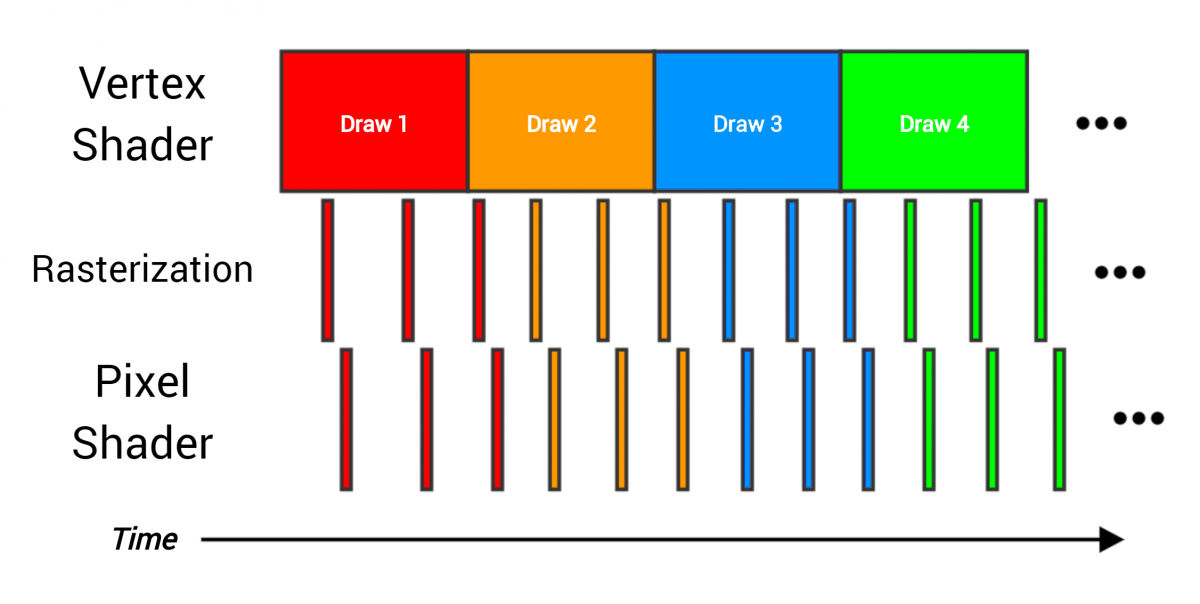
Here, a costly vertex shader cannot transfer data to the next stages quickly enough, and therefore becomes a bottleneck. If you have such a draw call, the acceleration of the pixel shader does not greatly change the total render time of the whole draw call. The only way to speed up the work is to reduce the time spent in the vertex shader. The solution depends on the fact that at the vertex shader stage it creates a “mash”.
Do not forget that some “bottlenecks” will almost always exist - if you get rid of one, its place will just take another. The trick is to understand when you can deal with it, and when you just have to accept it, because this is the price of the render work. When optimizing, we strive to get rid of the optional "bottlenecks". But how to determine what is the "bottleneck"?
Profiling
To determine what is spent all the time video processor, profiling tools are absolutely necessary. The best of them can even point out what needs to be changed to speed things up. They do it differently - some just explicitly show the list of “bottlenecks”, others allow you to “experiment” and observe the consequences (for example, “how the rendering time changes if you make all the textures small”, which helps you to understand whether bandwidth memory or cache usage).
Unfortunately, everything becomes more complicated here, because some of the best profiling tools are available only for consoles, and therefore fall under the NDA. If you are developing an Xbox or Playstation game, contact a graphics programmer to show you these tools. We, programmers, love when artists want to influence performance, and are happy to answer questions or even write instructions for the effective use of tools.
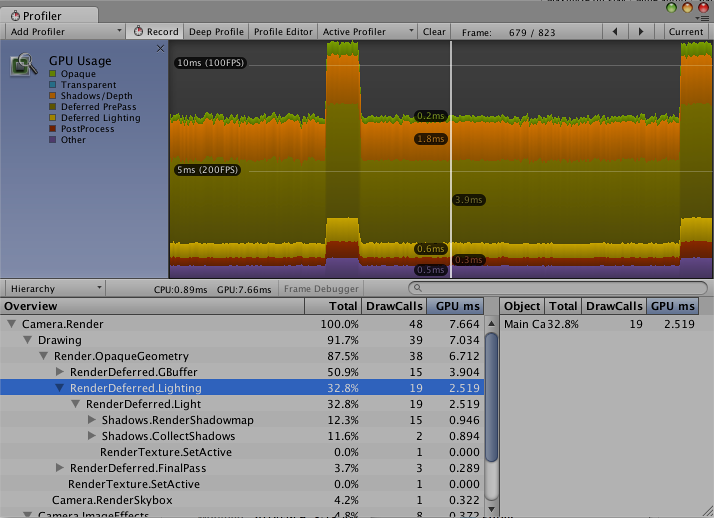
Basic embedded video profiler of Unity engine
For the PC, there are pretty good (albeit hardware-specific) profiling tools that can be obtained from video processor manufacturers, such as Nsight from NVIDIA, GPU PerfStudio from AMD and GPA from Intel. In addition, there is RenderDoc - the best tool for debugging graphics on a PC, but it does not have advanced profiling features. Microsoft is launching its awesome profiling tool for Xbox PIX and for Windows, at least for D3D12 applications. If we assume that the company wants to create the same analysis tools for bottlenecks as in the Xbox version (and this is difficult, given the huge variety of equipment), then this will be an excellent resource for PC developers.
These tools can give you all the information about the speed of your graphics. Also, they will give a lot of tips on how to make a frame in your engine and allow you to perform debugging.
It is important to master the work with them, because artists should be responsible for the speed of their graphics. , — , , , . , , , . , — , !
, , bottleneck, . « », , , .
, « ». « » — , , .
, . , , , - . , .
, « » — ! , , , . , , LOD (Level Of Detail, — , , ).
However, sometimes “jams” in shader instructions simply indicate problems in another area. Problems like too much redrawing, poor LOD performance, and many others can force the video processor to do much more work than necessary. These problems can arise from both the engine and the content side. Careful profiling, careful study and experience will help figure out what is happening.
One of the most common problems is redrawing (overdraw).. The same pixel on the screen has to be shaded several times, because it affects many draw calls. Redrawing is a problem because it reduces the total time that a video processor can spend on rendering. If each pixel of the screen needs to be shaded twice, the video processor can spend only half the time for each pixel to save the same frame rate.

PIX game frame with redraw visualization mode
, , , : , . , , , , . .
. (early depth test) ( — . ) , , . (depth buffer) — , , . , , . , .
(.. ), , , . , . , , «» . , , , .
, (depth prepass) . , , ( , , ..), , , , . «» , . , ( , ) , , , , . , .

Prototype 2
, , . . , . , . , , FumeFX Houdini , .
. , — , (particle trimming) : , .
«» Unreal Engine 4
, , . , , , - (alpha testing) . - , . , - , ( , ), . ( ) , .
(overshading) , . , . — , : , «» (quads) . , 2x2. , , UV MIP-.
, ( ), , 75% . (.. ) , . LOD; , , .
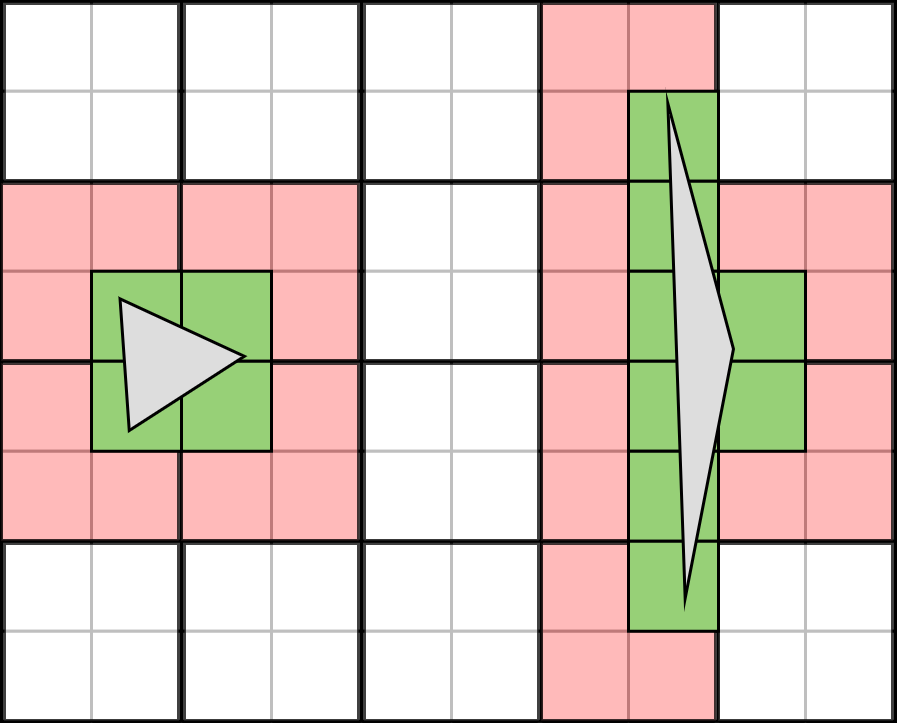
10x8 5x4. — , . 10 , , , 12 . 70% .
( : , , . , , , , .)
, : , , . , , , , .
- : , . , , « » . , . , .
, , . , - , , , .
. - , (bandwidth) - — , . — 6/, 3/ .
: / , . , , - — PS4 176/ — . , , , .
. , , , , (, ), , , , . - , , ( ), , . « » : no matter how fast the shader works, if it has to stop and wait for data from the memory to be received. The only way to optimize is to reduce the memory bandwidth used or the amount of data transferred, or both.
Memory bandwidth even has to be shared with a central processor or asynchronous computational work that the video processor performs at the same time. This is a very valuable resource. Most of the memory bandwidth usually takes the transfer of textures, because they contain a lot of data. Therefore, there are different mechanisms for reducing the amount of texture data to be transferred.
The first and most important is the cache. . , . , . -, — , .
, , , . , . — , , . , , , . « ». filtering ( bilinear, trilinear and anisotropic filtering with each search requires several pixels, additionally loading the bandwidth. High bandwidth anisotropic filtering uses bandwidth especially well.
, , (, 2048x2048) , . , , , . , ( « » (cache miss)), , : . , . , ( ) , , , . , — , .
This is where MIPmapping comes to the rescue. . , , , . « » MIP-, . , « ». MIP- , . , MIP- , . MIP- — .
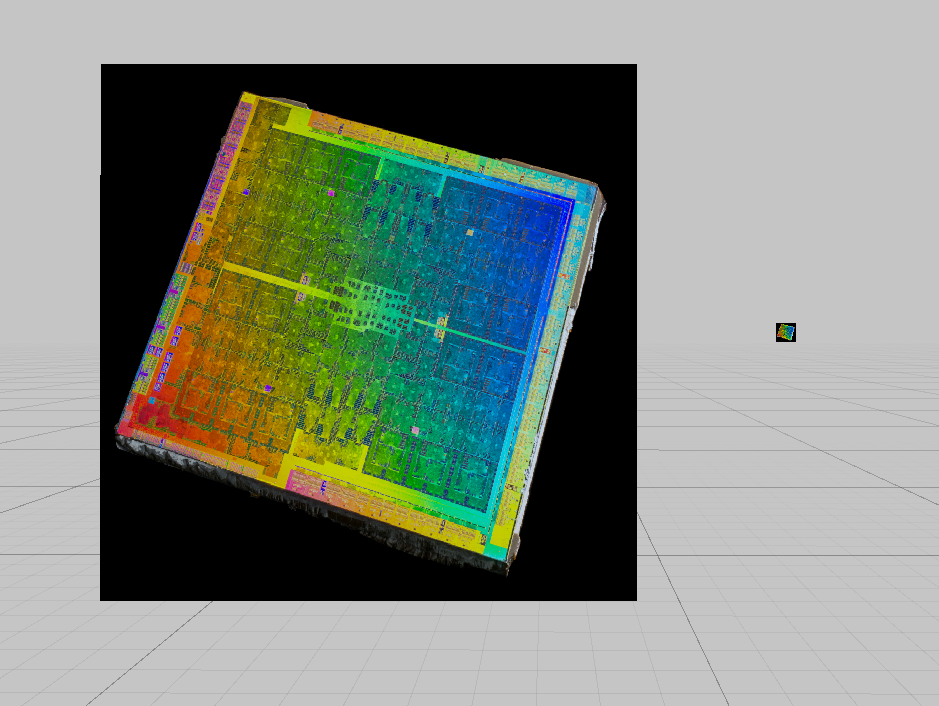
, ,
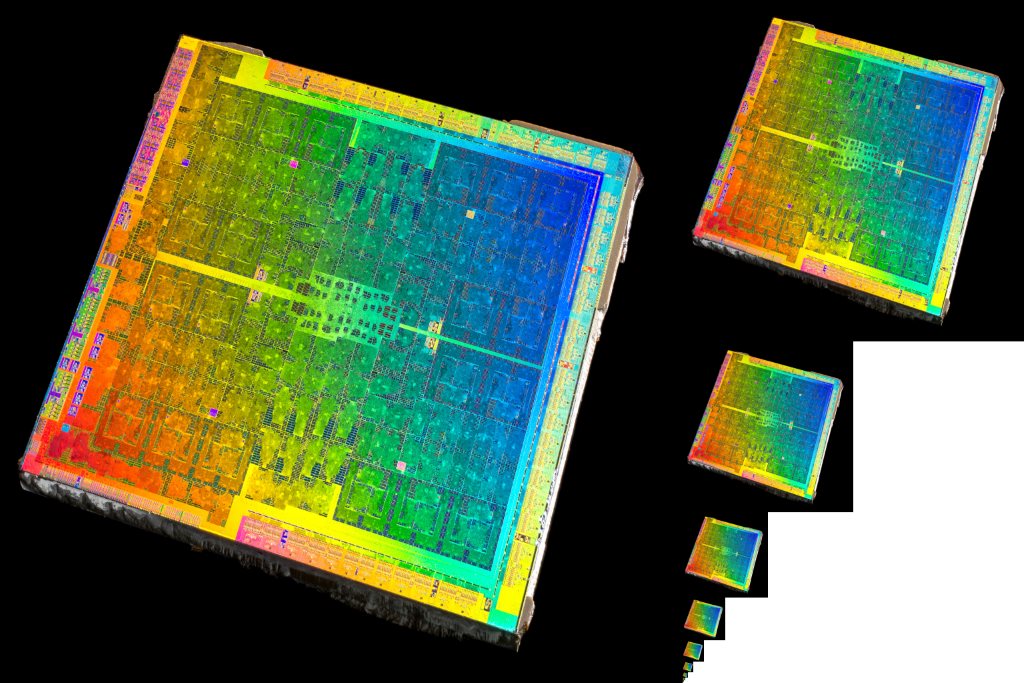
MIP-,
— — (compression) ( , , ). BC (Block Compression, DXT-) . , , .
- «» . , MIP . «» 8x 16x, 2x, / . , MIP- . , . , — RGBA, , , 75% .
Textures are the main, but not the only "users" of memory bandwidth. Data grids (index and vertex buffers) also need to be loaded from memory. In the first scheme of the video processor pipeline, you can see that the output of the final target render is written to memory. All of these transmissions usually occupy one common memory bandwidth.
With standard rendering, all these costs are usually invisible, because compared to the texture data, this amount of data is relatively small, but this is not always the case. Unlike conventional draw calls, the behavior of shadow passes is quite different, and they are much more likely to limit the bandwidth.
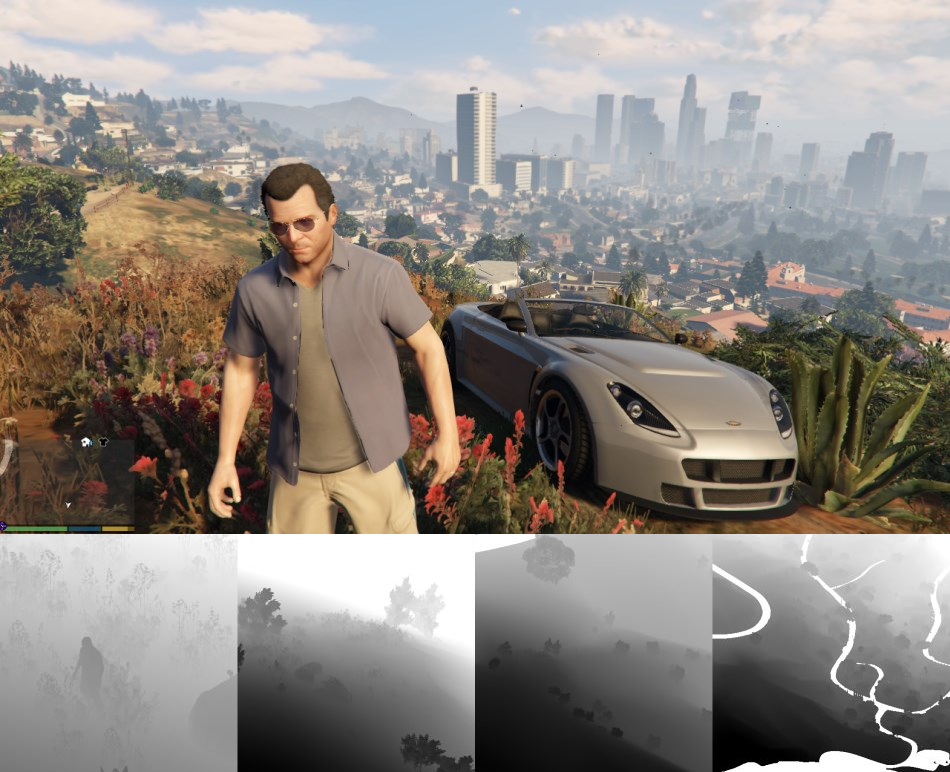
Frame from GTA V with shadow maps, illustration taken from excellent frame analysis. ( )
, — , , : /, , . , . / , .
, — — Xbox. Xbox 360, Xbox One , , 360 EDRAM , XB1 ESRAM . (10 360 32 XB1), , , . , (DRAM). , , , DRAM. , . , EDRAM/ESRAM, , . 3D-.
And much more...
, — . . , , .
, . , , , , … .
You can learn a lot from the article, but do not forget that your team’s 3D programmers are always ready to meet with you and discuss everything that requires a deep explanation.
Other technical articles
- Render Hell - Simon Trumpler
- Texture filtering: mipmaps - Shawn Hargreaves
- Graphics Gems for Games - Findings from Avalanche Studios - Emil Persson
- Triangulation - Emil Persson
- How bad are small triangles on GPU and why? - Christophe Riccio
- Game Art Tricks - Simon Trumpler
- Optimizing the particle system - Christer Ericson
- Practical Texture Atlases - Ivan-Assen Ivanov
- How GPUs Work - David Luebke & Greg Humphreys
- Casual Stepsie Hurlburt
- Counting Quads - Stephen Hill
- Overdraw in Overdrive - Stephen Hill
- Life of a triangle - NVIDIA's logical pipeline - NVIDIA
- From Shader Code to Teraflop: How Shader Cores Work - Kayvon Fatahalian
- A Trip Through the Graphics Pipeline (2011) - Fabian Giesen
Note: This article was originally published on fragmentbuffer.com by its author Keith O'Conor. Keith's other notes can be read on his twitter (@keithoconor) .
Source: https://habr.com/ru/post/337484/
All Articles