Mathematical modeling of traffic flows
Introduction
- Modeling traffic flows has become one of the leading problems in science, almost from the appearance of the first cars. It is believed that the founder of this industry is a scientist from tsarist Russia Dubelir with his book "City streets and bridges" (1912). Over 100 years of continuous research, many good models have been developed that help build high-quality and fast roads today. But if you think that there are no unsolved questions left, you are greatly mistaken, because until now the bright minds of our planet are puzzled over solving problems that even children sometimes ask. For example, how to set up a traffic light so that there is no traffic jam around it?
Shortest way
- As you might guess, the road network is usually represented as a graph .
Despite the fact that most of the roads are two-sided, there are unilateral areas, it means that the graph is oriented .
For ease of understanding, we will assume that the graph is related , namely, that from any vertex of the graph you can always get into any other.
Imagine such a situation, from city A to city B leads two empty roads with the same coverage, which one is better to choose? The correct answer is: which is shorter.
')
This means that the graph is weighted , since each edge can be assigned a number, for example, which is the length of the corresponding road. Such a system would look something like this ...
- But if everything was so simple, companies would not spend huge sums on the development of advanced navigators. And all because of the fact that there are high-speed highways, and there are rural primers, there are narrow urban streets, and sometimes MKAD. Well, respectively, the main problem of choosing the right track is traffic jams.
Instead of writing a bunch of characteristics over the edges, they usually write a function, namely, the dependence of the travel time of a section of a road on the number of cars.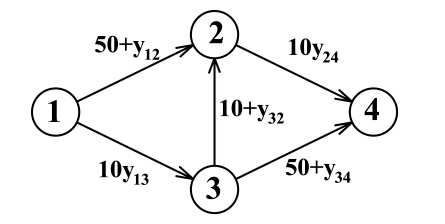
In this diagram - is the number of cars passing through the selected cross-section per unit of time for the interval between cities 1-2
Maximum Flow
- And now, let's switch to the role of the general plan of a city. You want to know how good your road network is. Most often you need to find out how many cars can simultaneously go on a particular highway. During the Second World War, the United States Air Force was very interested in how quickly and how much of the military could be redirected to critical points of combat. The solution was found by Mathematician George Bernard Danzig.
Let the edge capacity is the maximum intensity of the flow passing through the edge.
A saturated edge is an edge along which the maximum flow passes.
Assign a pair of numbers to each plot ( , ). - the flow along the edge achieved so far, at first it is zero, then this number will only increase until it reaches ribs capacity.
So far on at least one route from all edges are unsaturated (i.e. on all edges < ), the cycle continues.
1. We are looking for any part of the route that contains only unsaturated edges from at . If we cannot find such a section, then the cycle is terminated, the maximum flow we are trying to find is the sum of the flows of ribs coming into .
2. We found a complementary route. Determine the value of the maximum flow which we can skip this route. It is defined as the minimum of all possible differences in capacity. and the existing flow c along all edges of the route.
3. Each on the edge we fold with so at least one edge is converted to saturated.
4. Return to (1.)
Microscopic Model
- In the first two paragraphs, a macroscopic model was described, but since the 1950s, scientists began to consider a microscopic model. The main difference lies in the fact that the flow is not considered as a whole, but as each car separately.
- In microscopic models of traffic flow, it is assumed that the acceleration of a particular vehicle depends on neighboring vehicles. The machine that drives ahead (the leader) has the greatest influence on the driver's behavior.
- This model is complex and ambiguous, so scientists are still writing articles that offer more and more advanced functions describing the movement of machines, but the more perfect the formula, the more it gets bigger and more complex.
Passenger preferences
- Imagine that you own a large taxis and you are trying to understand how many cars are optimal to have, which policy to take orders and who exactly to send by call?
- The simplest redistribution algorithm is to do nothing, and when a potential client comes to a halt, send the nearest free car to it. But what if we have a car with a passenger already approaching this place, who needs to get out there? So we sent the taxi driver for nothing. Therefore, we must take into account the cars that are already heading for our station.
- The next important question is how to build a so-called heuristic algorithm? Heuristic is an algorithm that somehow uses some probabilities from the future. For example, we know that the train will soon arrive at the station and many passengers will leave it who want to take a taxi. Maybe you should send cars there in advance? If so, how much in advance and how many cars?
One of the algorithms for each station sets a certain index, depending on the passengers already standing, on some statistics on future arrivals and on the location of cars in the system.
Crossroads
- Let us be given a crossroads of the following form:
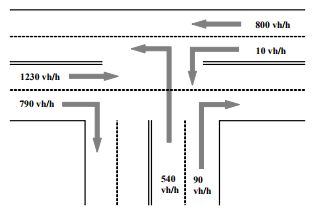
The figures show the intensity of the flow during rush hour and the scheme of the intersection.
What is the duration of the phases of the traffic light optimal (so that the number of cars at the intersection was minimal)? - I think many people noticed that most of the intersections do not use information about the traffic of cars and the duration of the traffic light phases set on them are close to random. Many will propose to make the duration of the phases proportional to the flow in each direction. But this can lead to a long traffic jam in one of the directions. An effective solution, fairly obvious ...
- Let the stream of cars moving along a six-lane road reach a T-junction. And let the goal of a third of drivers is turning left, and the goal of the rest is to continue driving. It is impossible to turn and move straight at the same time (see figure). In this case, the two left lanes will take drivers who want to turn left. Why exactly two lanes will occupy the drivers will answer a complex mathematical model. The flow of vehicles through the traffic light when turning on the green signal for direct traffic will not be theoretical, the maximum possible for a given number of lanes (6,000 cars / hour), but only 4,000 vehicles / hour. So in this area you need not 6 lanes, but only 4.
Source: https://habr.com/ru/post/337310/
All Articles