Data Ensemble Workflow Visualization with InterSystems DeepSee
When automating business processes in an enterprise, a person still has to do some of the tasks: coordination of various information, enrichment of data from analog sources and much more. The InterSystems Ensemble integration bus for solving this class of problems has an Ensemble Workflow subsystem that allows people to participate in automated business processes. As a result of the work of the Ensemble Workflow subsystem, a large amount of information is accumulated about who performed the tasks and how many. In this article, using the BI-technology InterSystems DeepSee, about which I recently wrote on Habré, we will analyze and visualize this information.
Analytics
By default, Ensemble provides business metrics and the Workflow Tasks Workflow Portal page (Management Portal → Ensemble → Manage → Workflow → Workflow Tasks or SMP → Ensemble → Management → Work Flow → Work Flow Tasks) for high-level task management:
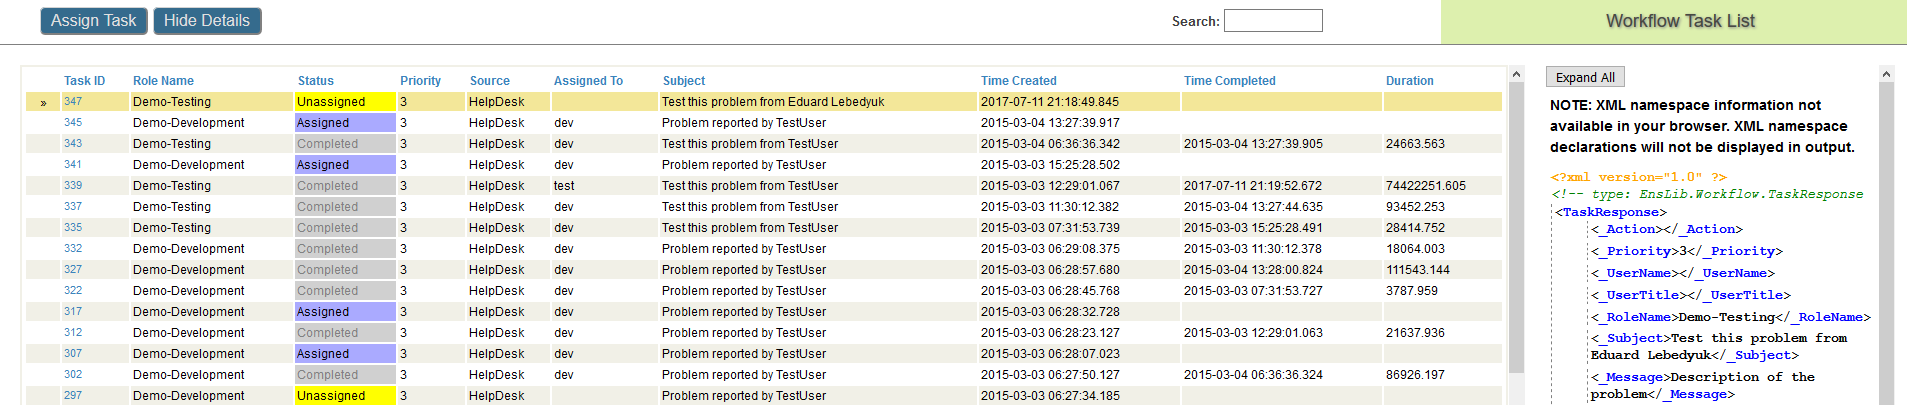
Doesn't this look like a fact table for a DeepSee cube? This is true, so I decided to build a DeepSee cube based on the EnsLib.Workflow.TaskResponse class:
')
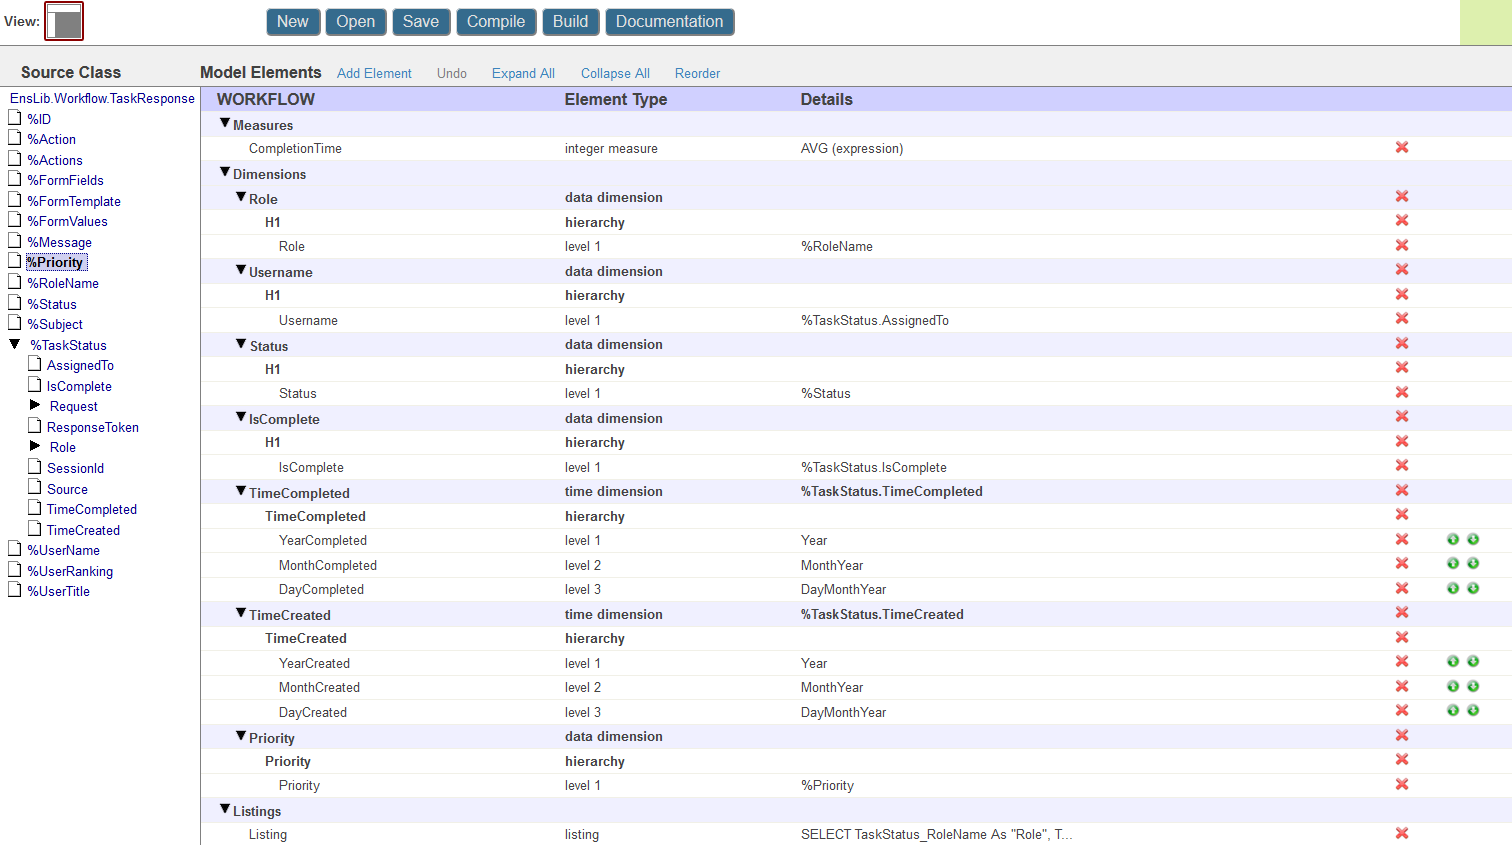
In this cube, I store information about each task, namely:
- The user who completed the task
- Role of task
- When it was created and completed
- A priority
- Current status
- Completed the task
- Time spent on the task
Most of the elements of the cube are created by simply dragging the class property onto the cube area, but here are the most interesting ones:
CompletionTime - task execution time in minutes. It is calculated as follows: $System.SQL.DATEDIFF("minute",%source.%TaskStatus.TimeCreated,%source.%TaskStatus.TimeCompleted)
The SQL listing is defined as follows ( $$$SOURCE is the fact table, and $$$RESTRICT is the filter used by DeepSee):
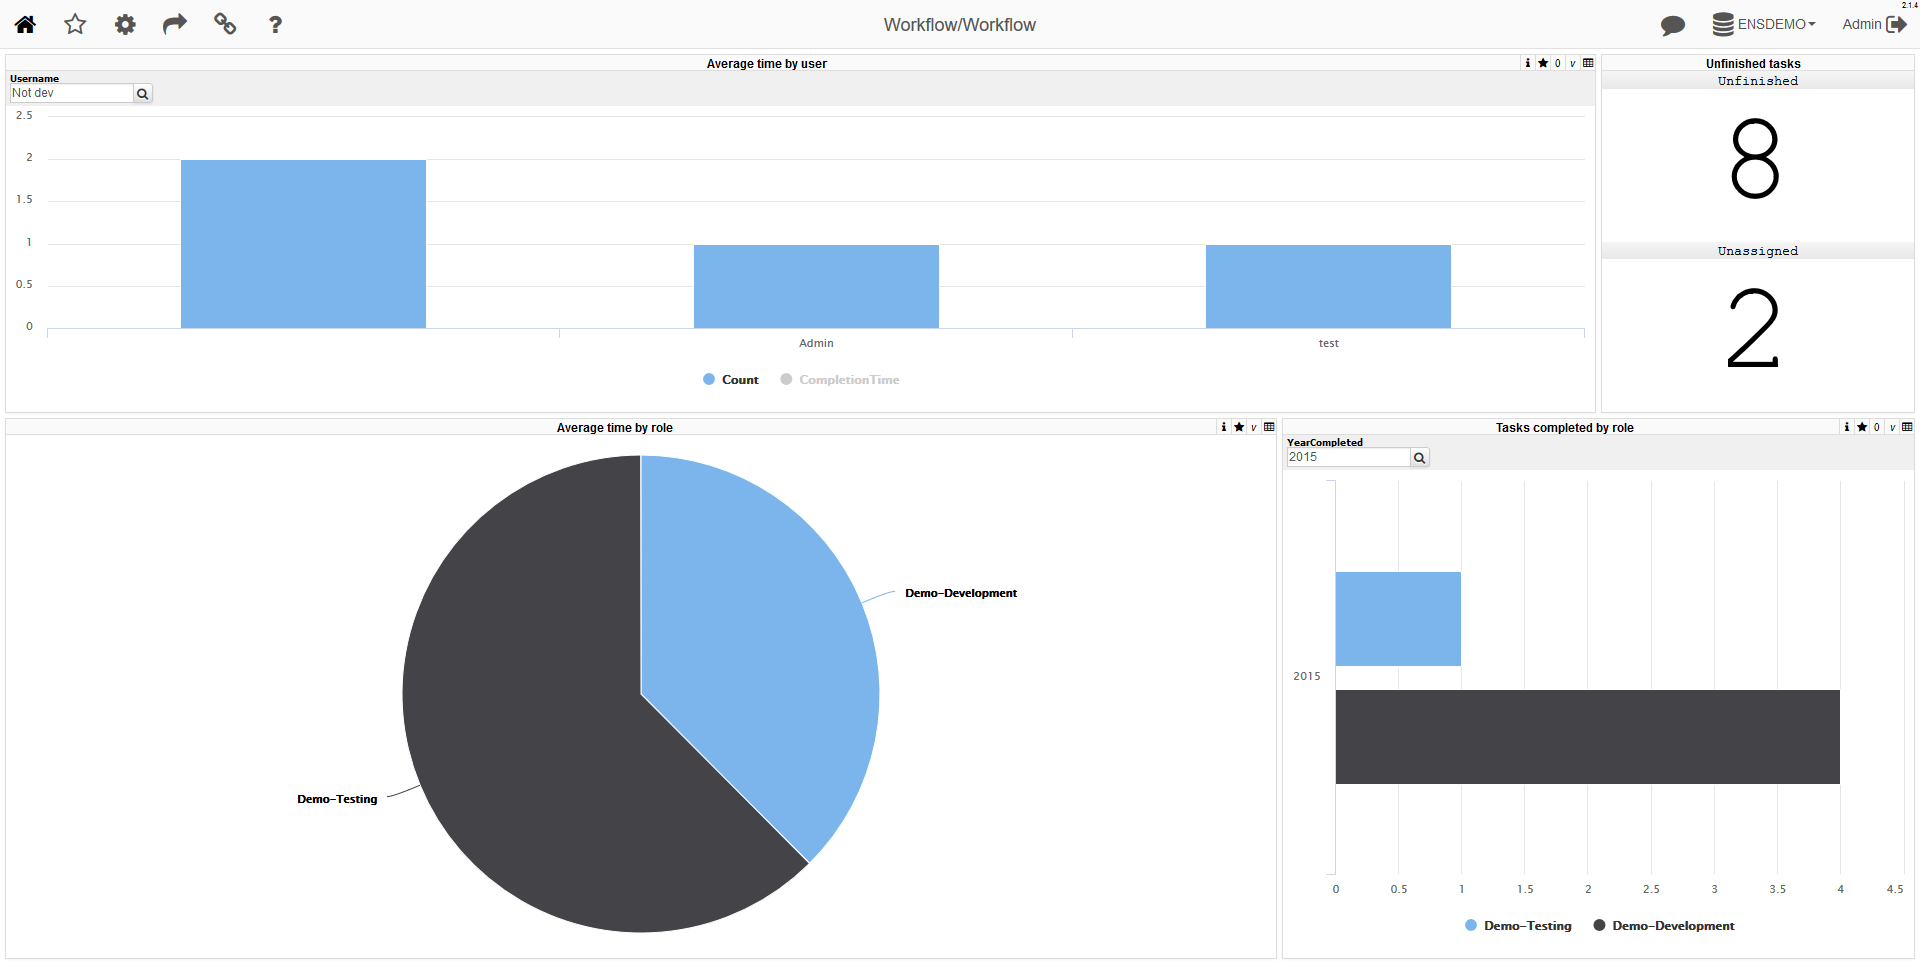
SELECT TaskStatus_RoleName AS "Role", TaskStatus_IsComplete AS IsCompleted, %Status AS "Status", TaskStatus_Source AS BusinessProcess, TaskStatus_AssignedTo AS "User", %Subject AS "Subject", %Message AS "Message", TaskStatus_TimeCreated AS "TimeCreated", TaskStatus_TimeCompleted AS "TimeCompleted", DATEDIFF('minute', TaskStatus_TimeCreated, TaskStatus_TimeCompleted) AS "CompletionTime" FROM $$$SOURCE WHERE $$$RESTRICT Now let's build a cube and some widgets. I decided to build one dashboard showing the main indicators:
- Average time spent by the user and role to complete the task
- The number of tasks that are currently not working or not completed
- The number of tasks completed during the period
Here is a demo dashboard (Login: dev / Password: 123). It is displayed using DeepSeeWeb (web application on AngularJS and Highcharts for rendering DeepSee dashboards in the browser.
Data drill down and drill down are also available: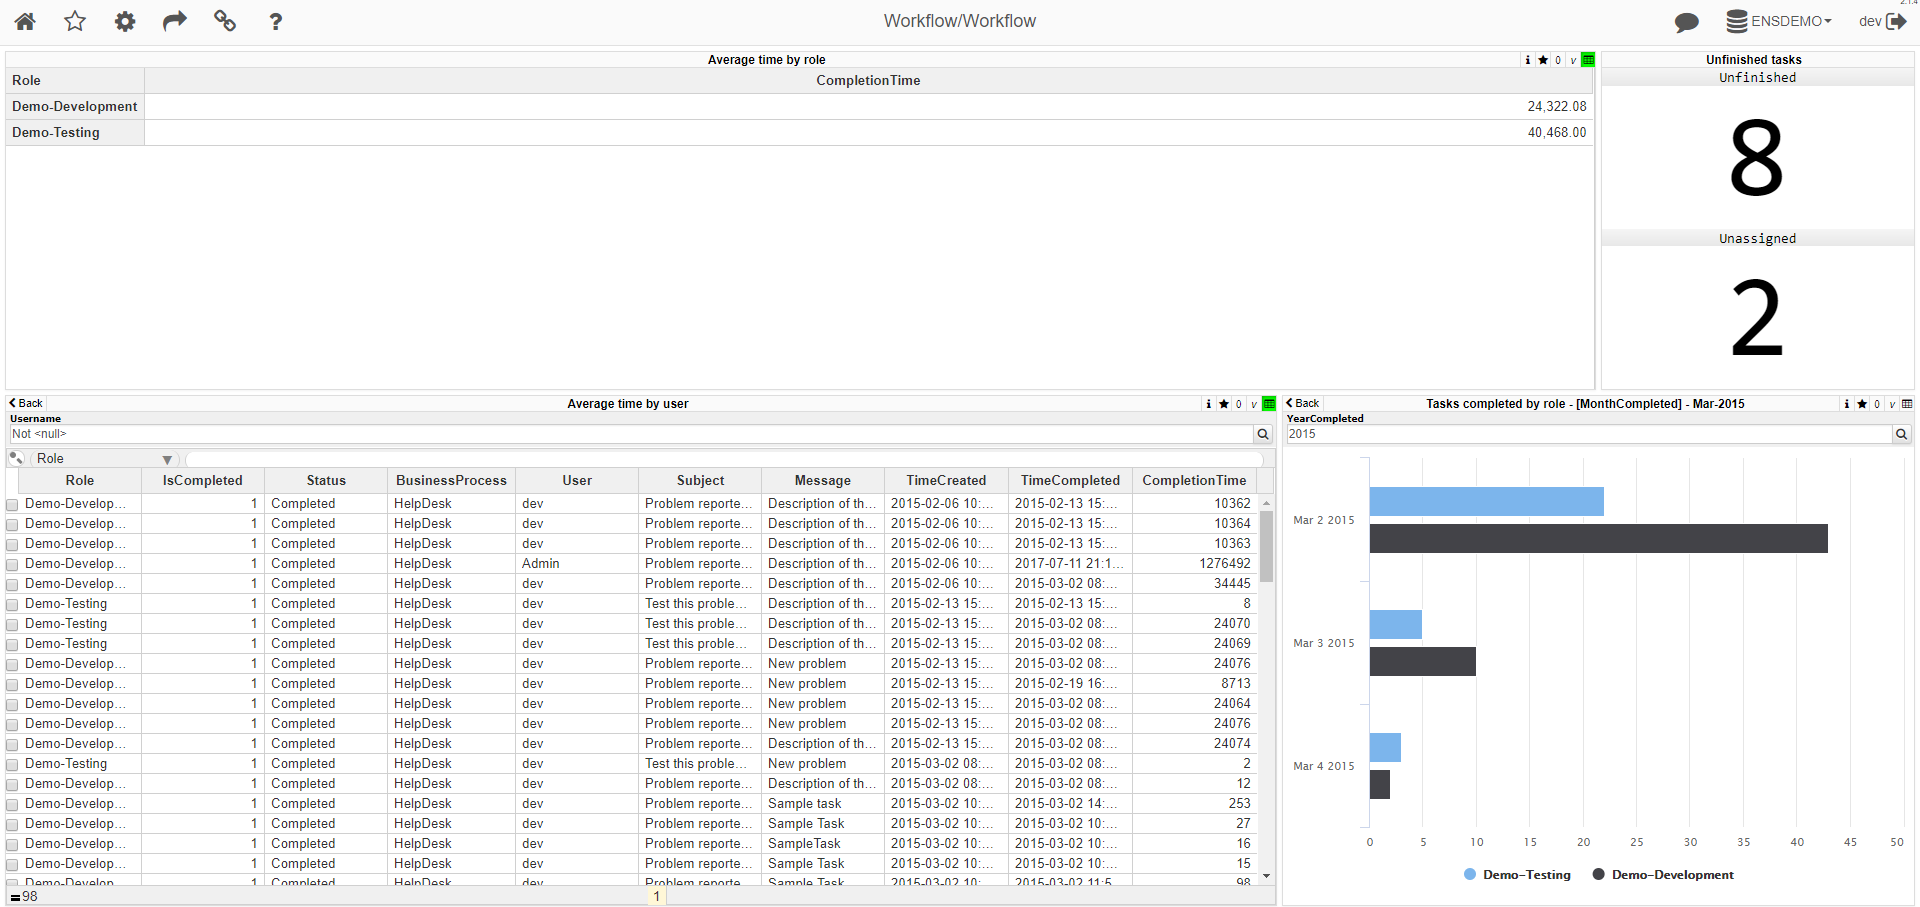
You can perform workflow tasks on the test server using the HelpDesk application and see the changes on the dashboard (the cube is built once per hour).
Login: dev / Password: 123
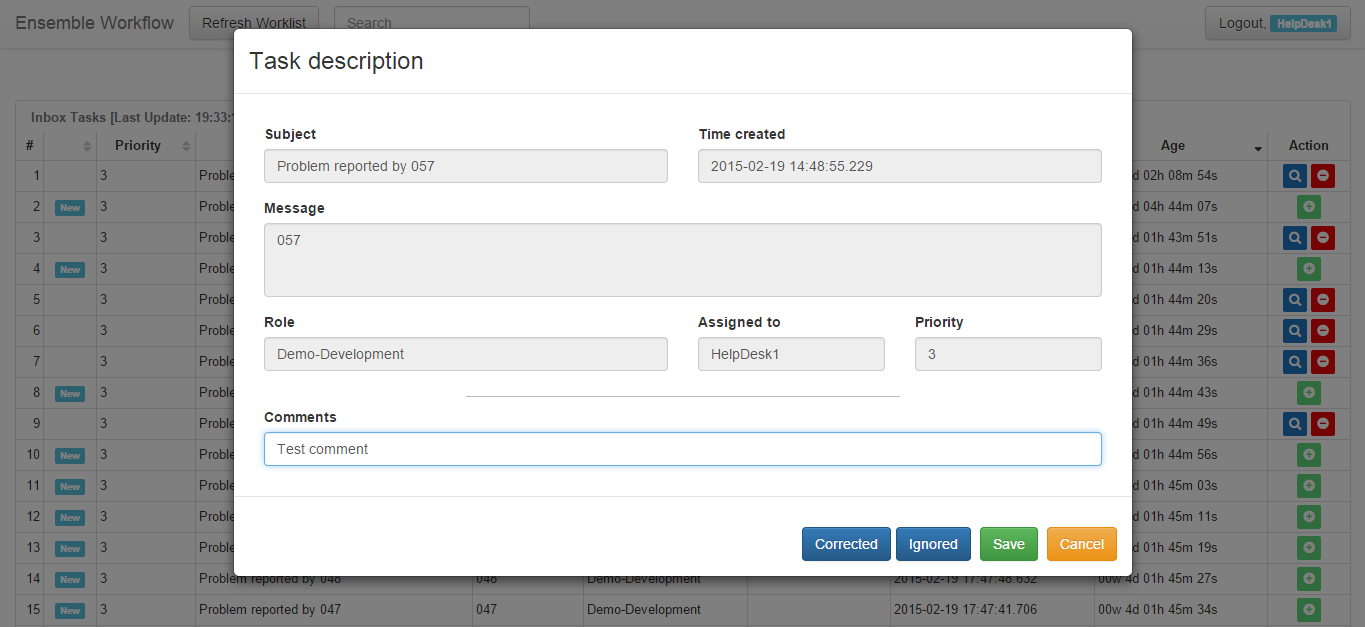
Here’s what Ensemble Workflow looks like when using EnsembleWorkflowUI :
Conclusion
Ensemble Workflow data can be visualized and analyzed using InterSystems DeepSee BI technology. This is a basic OLAP solution project, and can be easily extended as needed.
Links
Source: https://habr.com/ru/post/337262/
All Articles