The practice of forming requirements in IT projects from A to Z. Part 4. Business processes automated by the system
All parts
Part 1. Introduction
Part 2. Goals and Needs
Part 3. System Functions and Project Boundaries
Part 4. Business processes automated by the system.
Part 5. Essence of the subject area and a little about strategies
Part 6. Behavior of the system. Excellence requirements
Part 7. The transfer of requirements in production. Conclusion
VII Detail the processes included in the project
It is necessary to complicate things so that as a result everything becomes simpler.
and not to simplify, so that as a result everything becomes more complicated.
Wieslav Brudziński
Having determined the main functions and scope of the project, one can proceed to a detailed description of the functioning algorithms created by the system. In this block of work, we use a technique that allows us to “simultaneously” determine the connections between processes and storages. This will help us smoothly move from process models to data models.
The purpose of this group of works: on the basis of the identified functions, to determine the use cases, the target product being developed.
For such purposes, it is convenient to use graphic images of business processes using algorithmic diagrams (business modeling). Algorithmization is another method of the System Analysis discipline.
An added bonus of using business process diagrams is that they are extremely useful in developing acceptance tests. Well, more on that later.
')
Figure 7.1 shows the process of formalizing the requirements for the target system, supplemented by a subprocess of determining its use scenarios.
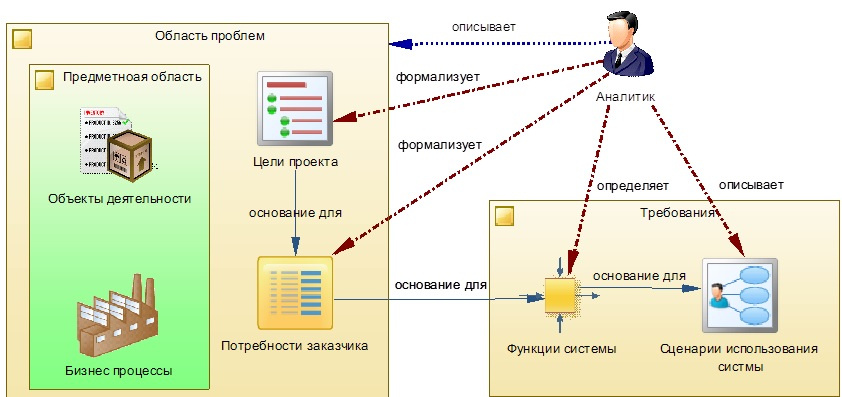
Figure 7.1 - Process Model for Defining System Use Cases
The algorithmic diagrams describing the processes impose the following requirements:
- they must describe the process logic in sufficient detail. As detailed and accurate as necessary in each case.
- they should be equally understood by the various groups of stakeholders of the project. These are, first of all, business people, whose work they describe, as well as executives: business analysts, developers, etc.
Business process diagrams are based on the canonical notations of the Activity (activity diagrams), but have additional features that I will cover in this chapter.
1. We use business process diagrams
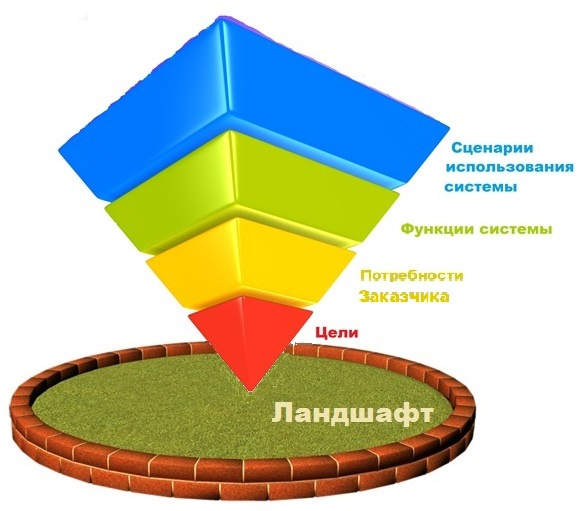
I want to clarify that in this section we take a look at the subject area from a different angle and we will consider not a description of any processes, namely, processes of “business level”, which are:
- well understood by the customer (end users of the target product being developed);
- operate with customer's domain concepts (“document”, “task”, “plan”, etc.);
Processes on the diagrams are desirable to break into business transactions (business transaction), see Fig.7.2, which will provide a list of the main scenarios - the capabilities that the target product must have to agree with the customer, as well as to discuss the completeness and logic of the processes. That is, each business transaction in the diagram should correspond to a single final operation, presented in the form of a system usage scenario by the user.
Figure 7.2 shows an example of a chart container grouping process diagrams broken down by business transactions.

Figure 7.2 - Dividing processes into business transactions
As in any activity diagram, the beginning of the process and its end (options for completion) must be indicated. For example in fig. 7.4, there are two options for completing the “Demand is fixed” or “Demand is rejected” process. But unlike the canonical diagram, in the diagrams of this type, the process can begin with several events, see fig.7.3

Figure 7.3 - Fragment of a diagram with 2_a points of entry into the process
As an example, we will describe in more detail the process “A1.1 Collecting the needs of the customer” that we identified at the previous stage. Please note that at each subsequent step, we use the result (product) of the previous step. Figure 7.4 shows a diagram describing the business process of collecting customer needs. Unlike IDEFO diagrams, a business process diagram allows you to model conditional transitions, which is critical for describing the functioning algorithms: “If the condition is fulfilled, we do this, otherwise the following”. On the diagrams of this type you can specify the performers, as well as resources used by the system. For example - storage.
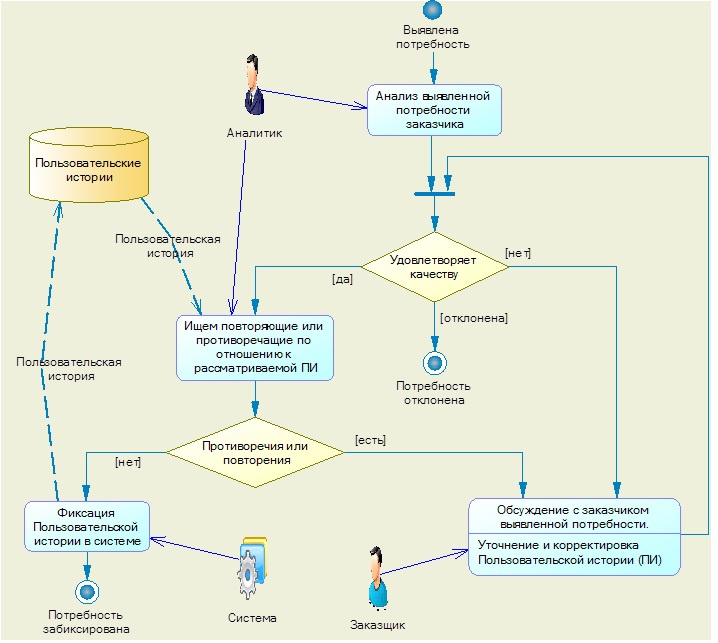
Fig. 7.4 - Business Process Chart Collect Customer Needs
Despite the fact that we consider the processes associated with the business component of the developed software product, the system elements can also be distinguished in the diagram. For example, in Fig. 7.4, the “User stories” storage is noted, which is used for:
- data sampling, in order to analyze the correctness recorded in the User History system;
- directly for registration in the system of a new verified User History.
Arrows (in Fig. 7.4, they are shown by dashed lines) you can display the transfer of data to the storage during the process, specifying what types of data are transmitted, as well as the types of data read from the storage as a result of other processes. Thus, we fix: in what processes, what storage is used and what is the business data that the system exchanges with the user.
2. An example of using a business process diagram to define roles and data warehouses.
Let's look at another, more complex example of a business process description. Figure 7.5 shows a diagram that simulates the process of processing requests from interested parties.

Fig. 7.5 - Business Process Flow Diagram
Another advantage of this type of diagrams is the ability to identify consumers, initiators, and process implementers, which allows to distinguish the user roles of the target product in the early design stages and outline a set of functions for them. To do this, each process is associated (arrow) with the performer: the user (role) or the system.
And that is not all. In the diagram, as we noted earlier, it can be seen (in the direction of the arrows) how some processes write to the repositories, while others select data from them. And this, another useful function of using diagrams of this type is the definition of all the “points” of accessing the repositories for sampling and recording data. The analysis of these processes allows you to optimize them, to minimize the occurrence of interlocking records in the database.
For example, in fig. 7.6 The Architecture Elements repository, can be used in several business transactions and in several processes.
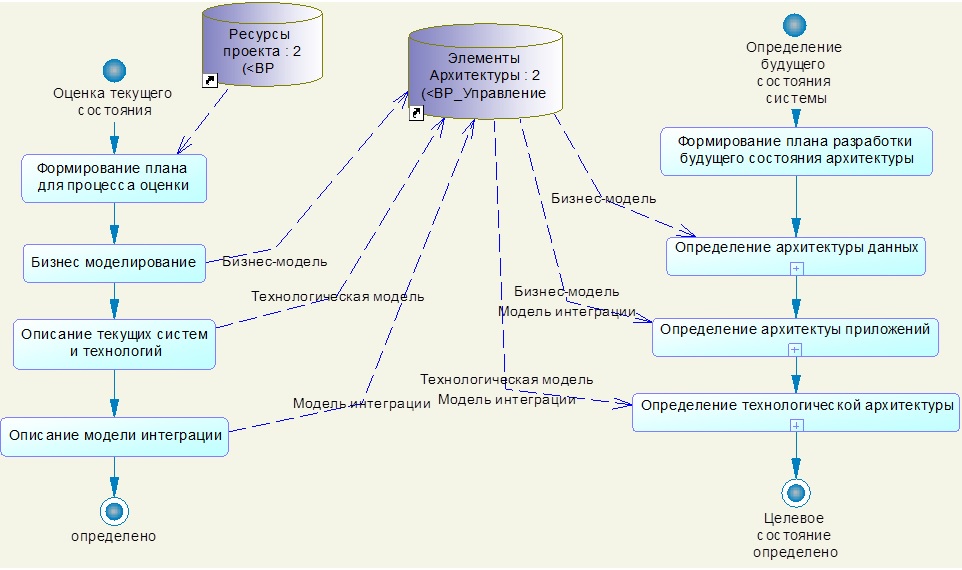
Fig. 7.6 - Using a chart to formalize repositories
As a result, we can get a dependency table of the repository, collected across all diagrams, where it is used, see Fig.7.7.
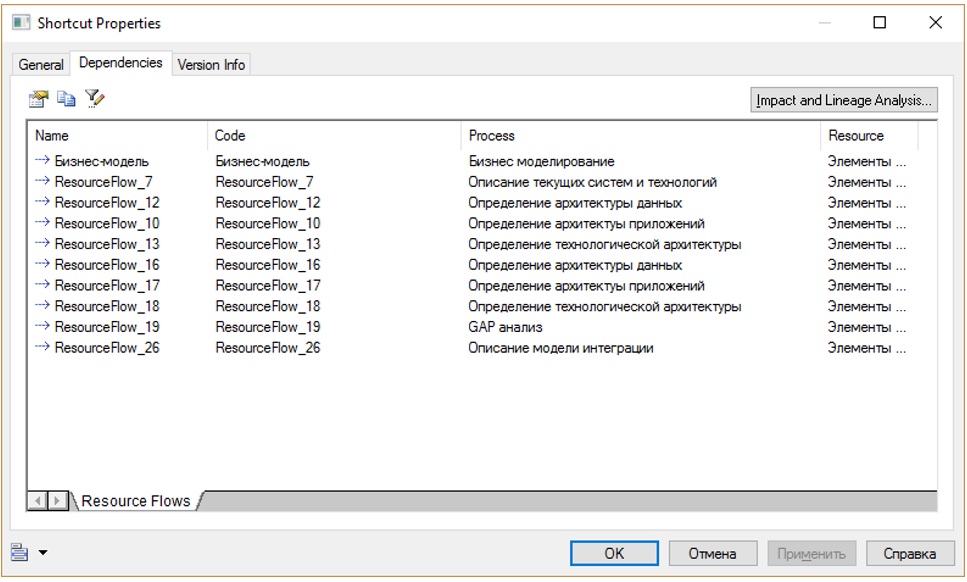
Fig. 7.7 - Resource dependency table
Business process diagrams will also help us to identify inconsistencies in functions that modify data in the repositories. Other owls: checking the consistency of requirements. Thus, there is a consistent detailed description of all the processes that implement the functions identified at the previous stage of modeling, and the definition of their relationship with the data warehouse structure model. Something similar is used in the ICONIX methodology, only there the sequence diagrams are taken as the basis.
3. We use business process diagrams for reengineering.
When modeling business processes existing at a customer using diagrams, you can often come across the following problems:
- duplication of functions by different departments;
- inefficient distribution of responsibilities between performers;
- processes that produce unclaimed products;
- "Sagging" areas of responsibility at the junction of processes;
- intersection of powers in processes, etc.
In such cases, the diagrams can be the starting point in the discussion with the representatives of the customer on the issues of optimization or reengineering of business processes. It is extremely important to be able to convince the customer side not to automate those processes that exist, but to develop and automate new “correct” processes. But at the same time, you should not conceal the problems associated with this, at least such as: “breaking up” the foundations of the enterprise and the need for some time when introducing the system, to support both old and new business processes. Perhaps you will accept some third, temporary option that will soften the transition and minimize inconvenience.
To visually convince the customer of the need to change the processes, you can develop a system of key indicators of these processes, allowing you to quantify the effect of their replacement. You can measure both the efficiency of the process itself and the product produced by the process.
It is better to present such studies in the form of comparative tables. We denote processes as columns: current and target or several variants of the target. As lines - the approved indicators. At the intersection, the indicator values for the process are filled.
For example, a benchmarking table might look like this:

The formation of such indicators and the determination of their values should be carried out with the direct participation of representatives of the customer. The number of indicators should not exceed 20.
4. Calculate the preliminary capacity of the project
The type of diagrams we are considering in this chapter has another very significant advantage. On the basis of these, it is possible to fairly accurately estimate the preliminary laboriousness of the process of developing the target product. If a stereotype is signed on each element of the diagram, for example: “List Form”, “Card Form”, “Function”, “Report”, etc., then it is easy to count the number of elements that need to be implemented. The complexity of the implementation of each type of element, when using established technologies in a team, is generally known. To increase the accuracy, you can use the complexity factor.
For example, the table of preliminary calculation of labor intensity may look like this:

For convenience, the coefficients can be used of three types of “complex”, “medium” and “simple” and for each type of elements have their own values. For example:
- For Entities: 0.3 - simple; 0.7 — medium; 1 - difficult;
- For Sampling: 1 - simple; 1.5 - medium; 2 - difficult;
- For Forms: 0.7 - simple; 1.5 - medium; 2 - difficult;
- For Procedures: 1 - simple; 3 - medium; 6 - difficult;
- For Reports: 0.5 - simple; 1 - medium; 3 - difficult;
Having developed a similar table at the initial stage, it can be used in the future throughout the design, making changes to it when refining and refining the requirements. This is very effective when the analyst provides the project manager with a “flick of the wrist” providing the project manager with updated and refined resource cost projections for fresh, newly developed requirements.
5. We revise the boundaries of the project (if necessary)
In the previous chapter, we talked about the boundaries of the project and that they can change. For example, in the project we are considering, after clarifying the list of processes, we see that we have missed one of the most important functions, namely communication in a team. To collect and discuss customer needs, it is necessary to organize meetings, rallies, discussions, etc. Therefore, we must design a set of functions that support communication management with stakeholders.
In the diagram of the functional model of the system discussed in the last chapter, we added a new process: “Management of meetings”, see Figure 7.8, it is highlighted in purple.
The input to the process receives information on the implementation of the previously formulated requirements, and the result of the performance of functions may be plans for meetings, iterations, etc. For example, this module can send letters to invited participants with information about meetings.
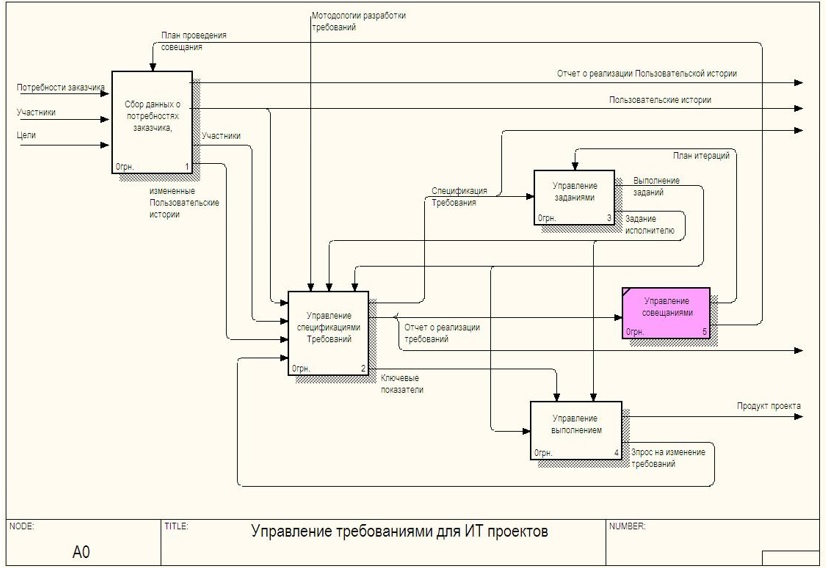
Fig. 7.8 - Changes in the functional model of the requirements management system
6. Let's summarize the use of process models.
At the stage of detailed refinement of the system functions and scenarios of its use, there is often a feeling of losing the thread of understanding how the system should work. Do not be afraid of this and despair. Continue to clarify the requirements and rethink the initial understanding of the system - this is normal. Gradually, everything will fall into place by itself.
So, after we get a complete set of descriptions of business scenarios for automation and a preliminary structure of data warehouses, we can proceed to the development of a data model. In fact, diagrams of this type can be started before, in parallel with the description of processes, but still, most of these works should be done after the identification of all business functions.
In my practice, there was a project in which, with the help of top management, business modeling diagrams were popularized among middle management. People were involved and already actively competed with each other in the ability to use them. This has become not only fashionable, but also very useful when discussing current business processes, as well as modeling new ones.
For a better understanding of the need to use business process diagrams, you can draw an analogy with geographical maps. All the same benefits that we get from using terrain maps in order to choose the best path between destinations can be obtained from business process diagrams, which serve as process advancement maps and convert its resources into a planned result (product).
This analogy is desirable to convey to all project participants. The ideal variant, which testifies to the quality of the prepared diagrams and their competent presentation to all interested persons, looks like a rally of team members who have crowded over the diagrams and pointers leading along them, like generals leaning over strategic offensive maps. Developing analogies further, the aforementioned IDEFO diagrams can be compared with Atlas maps, grouping them into regions (in this case, subject).
In the next part, we will identify the entities of the subject domain link .
Bibliography
1. Jacobson A., Butch G., Rambo J. - “Unified Software Development Process” (2004)
2. David A. Mark and Clement McGowan - “SADT Structural Analysis and Design Methodology”
3. Coburn - "Modern methods for describing functional requirements" (2002)
4. Leffingwell Dean, Widrich Don - “Principles of working with software requirements” (2002)
5. Karl I. Wigers - “Developing Software Requirements” (2002)
6. Elizabeth Hull, Ken Jackson, Jeremy Dick - “Developing and Managing Requirements A Practical User Guide” (2005)
7. Scott Ambler - “Flexible Technologies: Extreme Programming and a Unified Development Process” (2005)
8. Greenfield Jack, Kane Short - "Software Development Factories" (2007)
9. Alistair Cowburn - “Each project has its own methodology”
10. Wolfson Boris - “Flexible development methodologies”
11. Leszek A. - “Requirements Analysis and System Design”
12. Freeman Eric, Freeman Elizabeth - “Design Patterns” (2011)
13. Evans Erik - “Subject-Oriented Design” (2011)
14. GOST 34.602-89 “Information technology. Set of standards for automated systems. Terms of Reference for the creation of an automated system "
Source: https://habr.com/ru/post/337228/
All Articles