Overview of all Chrome DevTools developer tools
Novice JS developers often do not understand the purpose of all the tools that it provides the browser. Yes, and a relatively experienced developer, if he basically solves similar tasks, he can hardly boast that he regularly uses all the features that the browser’s developer tools provide. However, it would be extremely useful to get acquainted with them at least so that when solving some new problems you immediately know where to look for the answer, and having studied the subtleties of each of them in more detail, you can raise your productivity to a new level.
Separately, I would like to note that DevTools is in constant active development, so the name of the tools / panels / tabs, as well as their presence in general, or the way to access them, can be changed over time. Therefore, do not be afraid if, at the time you read this article, DevTools will be slightly different from what is indicated in the description or in the screenshots in this article.
Used to select and edit any HTML elements on the page. Allows you to freely manipulate DOM and CSS.
')
The tab contains two buttons: Selecting an element using the cursor and Switching to the device selection mode, it is useful when developing adaptive interfaces, mobile versions of sites or for testing pages with different monitor resolutions. When choosing any DOM element on the Styles tab, all CSS rules applied to it, including inactive ones, will be displayed. All rules are divided into blocks and ordered by decreasing the specificity of the selector. You can change values on the fly, deactivate and append new rules and see how this affects the display. Also, several more tabs are available for the selected DOM element: Event Listeners - contains all events related to this element, DOM Breakpoints - breakpoints for the element and Properties - a list of all properties for the element. There may also be additional tabs added by Chrome extensions.
Key features :

Required for logging diagnostic information during development or interacting with JavaScript on the page. Also, all errors in the JavaScript code will be displayed here with an indication of the file and the specific location in it where the error occurred. XHR requests can also be output to the console. It is possible to save logs in a separate file.
The console contains a number of tools and settings for filtering the displayed messages, clearing the console and prohibiting the clearing of logs when the page is reloaded - Preserve log.
Also, the console can display / hide as a separate tab from any other tab and without leaving it by pressing the Esc key.
In this article we will not touch upon the big topic of the capabilities of the API console and its other more advanced features; they can be found in the next article or in the official documentation .
Key features :

Sources tool is a kind of IDE, where we can view all the files included on our page. We can view their contents, edit the code, copy it, or save the modified file as a new file. This tab can also be used as a full-featured code editor by connecting to local files via Workspaces .
Sources is also used to debug JavaScript using breakpoints. To work with breakpoints there are a large number of special buttons and add. Opportunities about which more can be found in the official documentation .
Key features :
Allows you to monitor the process of loading the page and all files that are loaded at boot time. It is convenient to use to optimize the loading of pages and monitor requests.
The panel displays a table of all requests for data and files, above it there are buttons for filtering the requests you need, clearing the table or enabling / disabling recording of requests, and controls for displaying the table. There are also additional switches: Preserve log - do not clear the table when reloading the page, Disable cache - disable the browser cache (will work only when Dev Tools is open), Offline - emulates the absence of the Internet, also a neighboring switch allows you to emulate the download / download speed of data and ping for different types of networks.
Under the table, the number of all queries, the total amount of data loaded, the total download time of all data, the load time and DOM tree construction, and the load time of all resources affecting the display of this page are indicated.
Key features :
The panel displays the timeline of network usage, execution of javascript code and memory load. After the initial construction of timeline graphs, detailed data on the execution of the code and the entire life cycle of the page will be available. It will be possible to get acquainted with the time of execution of individual parts of the code, it will be possible to select a separate interval on the timeline and get acquainted with the processes that occurred at that moment.
The tool is used to improve the performance of your page as a whole.
Key features :
It contains several different profilers to track the load that code execution has on the system:
JavaScript CPU Profiler (was moved to a separate JavaScript Profiler panel) - allows you to find out how much CPU time it takes to execute various parts of your JS code.
Take Heap Snapshot - shows the memory allocation among JS objects and the associated DOM elements.
Record Allocation Timeline - records and displays the memory allocation between variables in the code. Effective to eliminate memory leaks.
Record Allocation Profile - records and displays the memory allocation for the execution of individual JS functions.
Key features :
A tab for inspecting and cleaning up all downloaded resources, including IndexedDB or Web SQL databases, local and session storage, cookies, application caches, images, fonts, and style sheets.
Key features :

On the tab, you can read the security protocol, if available, and view the details of the security certificate, if any.
The tool is used to debug mixed content problems, certificate issues, and more.
Key features :
After selecting the desired settings and clicking the Run button, the audit panel analyzes how the page loads and then provides optimization suggestions to reduce page load times and increase its responsiveness.
The following parameters are analyzed: resource caching, gzip compression, the presence of unused parts of JS code and CSS rules, and many other parameters. Further, the user is shown a grouped list of recommendations due to which you can significantly optimize the page loading speed and responsiveness.
Separately, I would like to note that DevTools is in constant active development, so the name of the tools / panels / tabs, as well as their presence in general, or the way to access them, can be changed over time. Therefore, do not be afraid if, at the time you read this article, DevTools will be slightly different from what is indicated in the description or in the screenshots in this article.
Elements Panel
Used to select and edit any HTML elements on the page. Allows you to freely manipulate DOM and CSS.
')
The tab contains two buttons: Selecting an element using the cursor and Switching to the device selection mode, it is useful when developing adaptive interfaces, mobile versions of sites or for testing pages with different monitor resolutions. When choosing any DOM element on the Styles tab, all CSS rules applied to it, including inactive ones, will be displayed. All rules are divided into blocks and ordered by decreasing the specificity of the selector. You can change values on the fly, deactivate and append new rules and see how this affects the display. Also, several more tabs are available for the selected DOM element: Event Listeners - contains all events related to this element, DOM Breakpoints - breakpoints for the element and Properties - a list of all properties for the element. There may also be additional tabs added by Chrome extensions.
Key features :
- View and edit in live mode any DOM element.
- View and modify CSS rules applied to any selected item in the Styles panel.
- View the entire list of events and properties for the item on the appropriate tabs.
Console panel
Required for logging diagnostic information during development or interacting with JavaScript on the page. Also, all errors in the JavaScript code will be displayed here with an indication of the file and the specific location in it where the error occurred. XHR requests can also be output to the console. It is possible to save logs in a separate file.
The console contains a number of tools and settings for filtering the displayed messages, clearing the console and prohibiting the clearing of logs when the page is reloaded - Preserve log.
Also, the console can display / hide as a separate tab from any other tab and without leaving it by pressing the Esc key.
In this article we will not touch upon the big topic of the capabilities of the API console and its other more advanced features; they can be found in the next article or in the official documentation .
Key features :
- Use the console as a separate panel or as a window next to any other panel.
- Ability to group a large number of messages or output them on separate lines.
- Clearing all logs or saving them between page reloads, saving logs to a separate file.
- Filter by message type or by regular expression.
- Logging XHR requests.
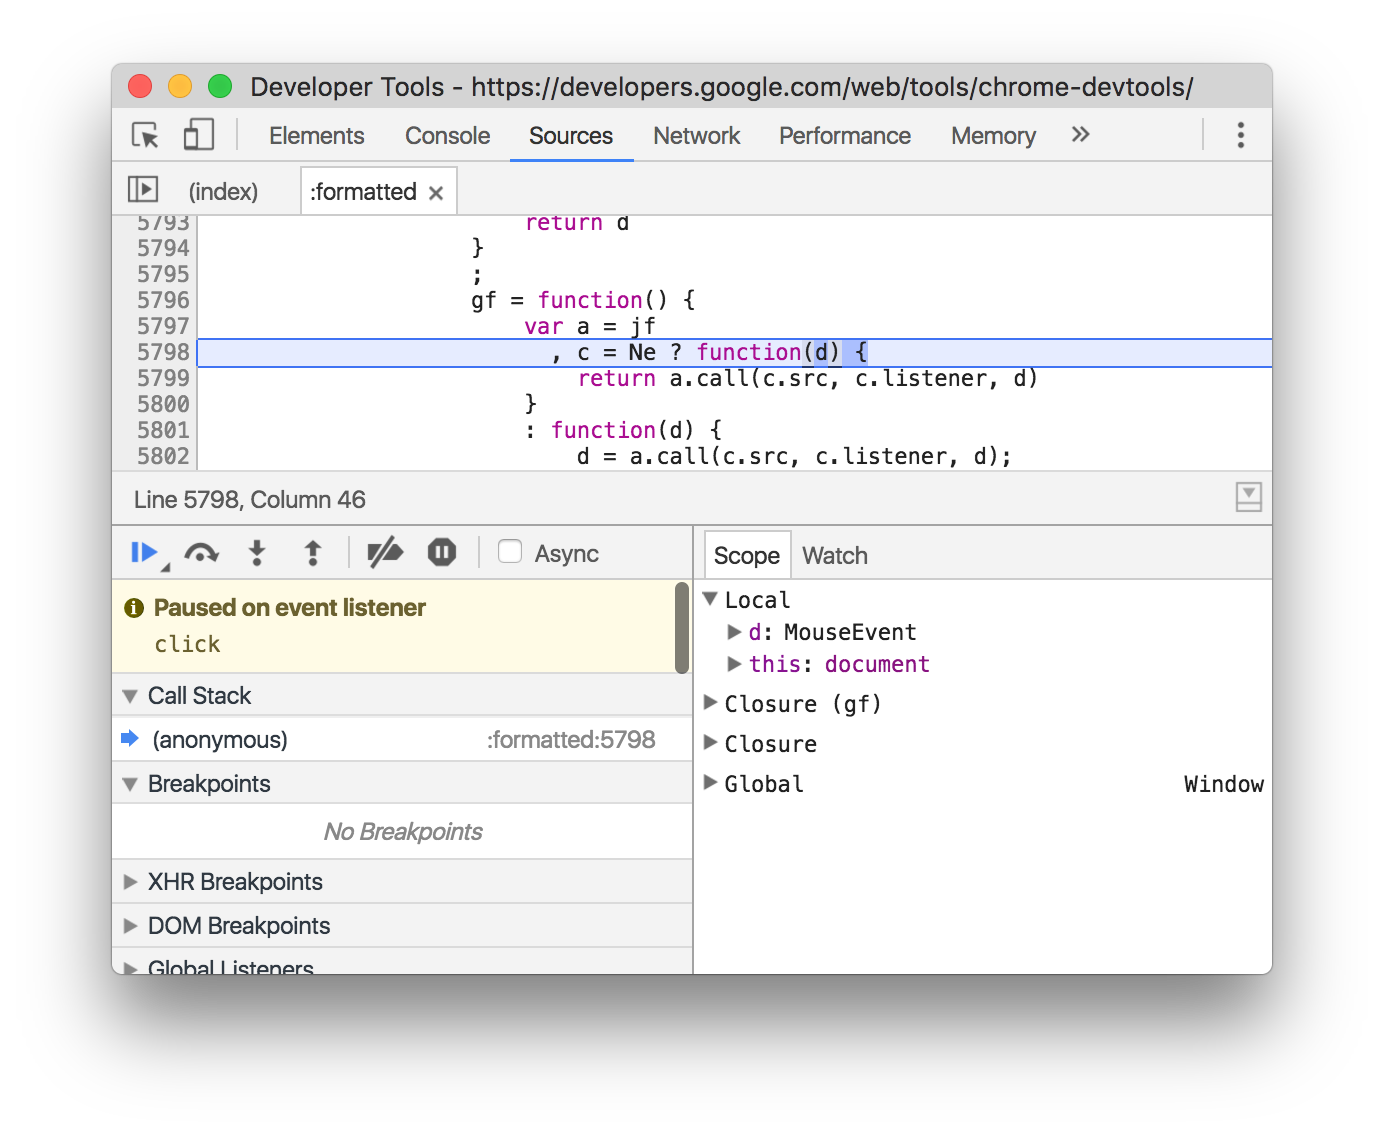
Sources panel
Sources tool is a kind of IDE, where we can view all the files included on our page. We can view their contents, edit the code, copy it, or save the modified file as a new file. This tab can also be used as a full-featured code editor by connecting to local files via Workspaces .
Sources is also used to debug JavaScript using breakpoints. To work with breakpoints there are a large number of special buttons and add. Opportunities about which more can be found in the official documentation .
Key features :
- Debug your code with breakpoints.
- Use the browser as an IDE using Workspaces.
- Run snippets from any page.
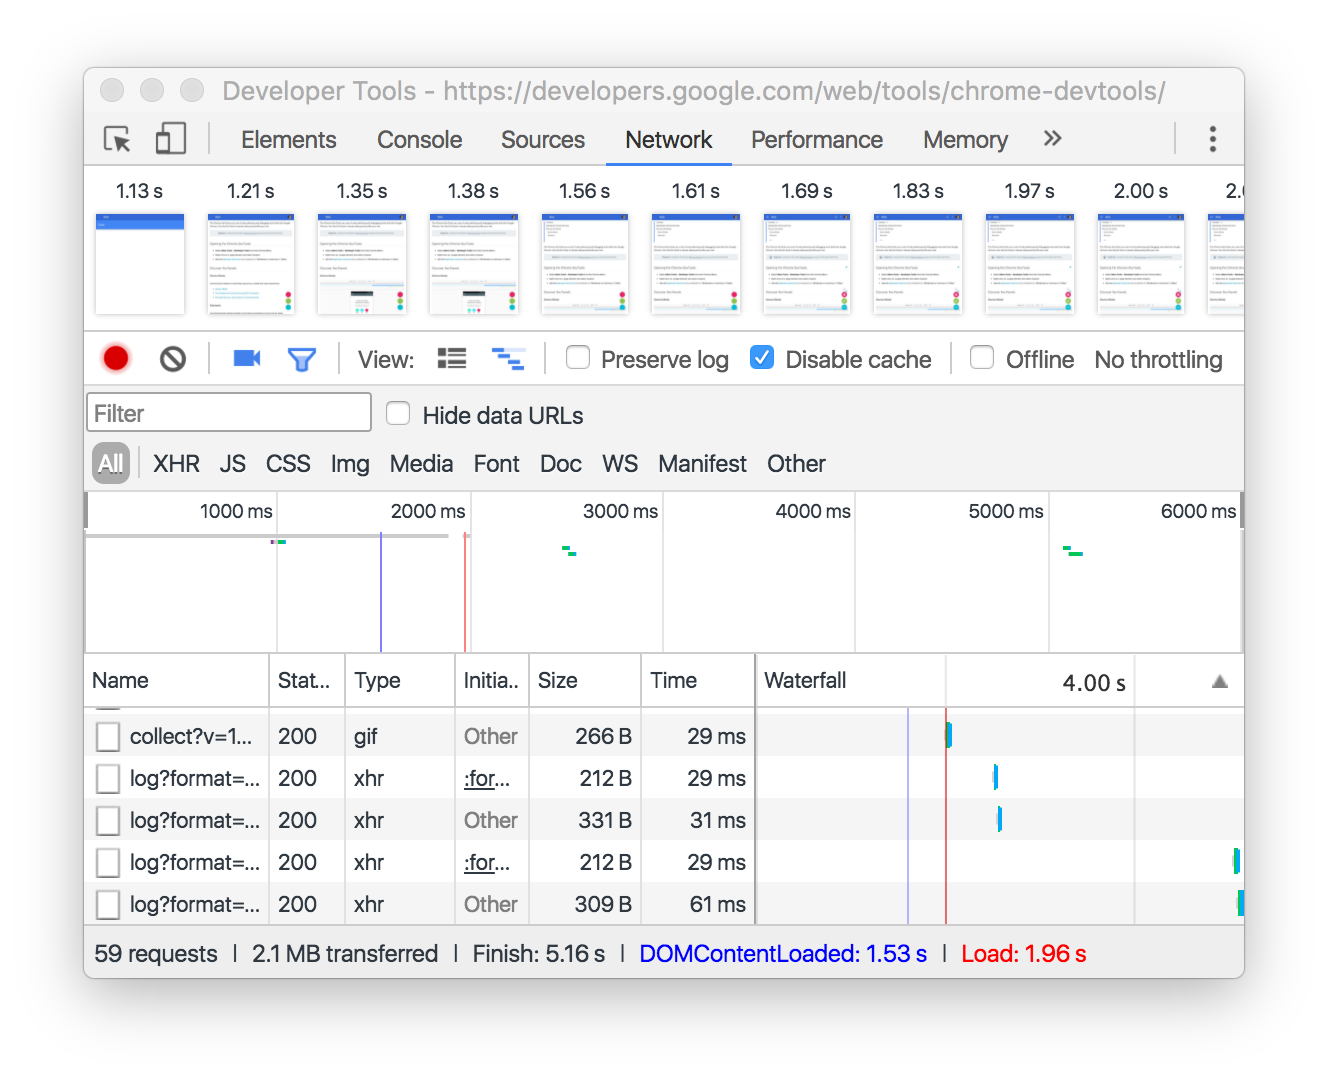
Network Panel
Allows you to monitor the process of loading the page and all files that are loaded at boot time. It is convenient to use to optimize the loading of pages and monitor requests.
The panel displays a table of all requests for data and files, above it there are buttons for filtering the requests you need, clearing the table or enabling / disabling recording of requests, and controls for displaying the table. There are also additional switches: Preserve log - do not clear the table when reloading the page, Disable cache - disable the browser cache (will work only when Dev Tools is open), Offline - emulates the absence of the Internet, also a neighboring switch allows you to emulate the download / download speed of data and ping for different types of networks.
Under the table, the number of all queries, the total amount of data loaded, the total download time of all data, the load time and DOM tree construction, and the load time of all resources affecting the display of this page are indicated.
Key features :
- Ability to disable caching or setting bandwidth limits.
- Getting a detailed table with information about each request.
- Filter and search the entire list of requests.
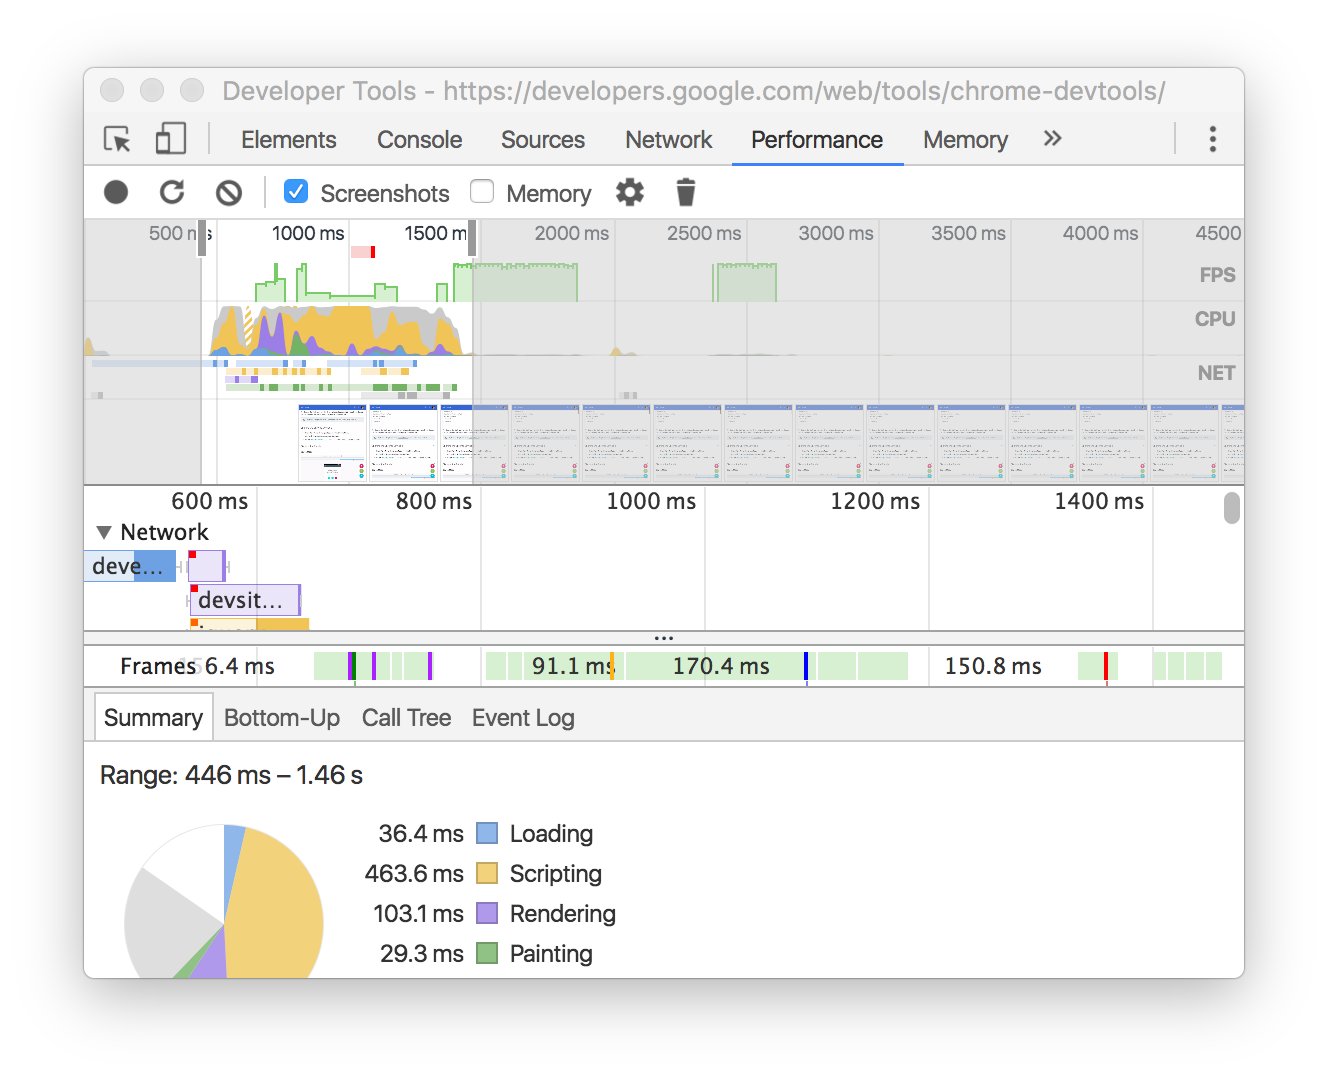
Performance Panel
The panel displays the timeline of network usage, execution of javascript code and memory load. After the initial construction of timeline graphs, detailed data on the execution of the code and the entire life cycle of the page will be available. It will be possible to get acquainted with the time of execution of individual parts of the code, it will be possible to select a separate interval on the timeline and get acquainted with the processes that occurred at that moment.
The tool is used to improve the performance of your page as a whole.
Key features :
- The ability to make a record to analyze every event that occurred after loading the page or user interaction.
- Ability to view FPS, CPU load and network queries in the Overview area.
- Click on an event in the diagram to see details about it.
- Ability to change the timeline scale to make analysis easier.
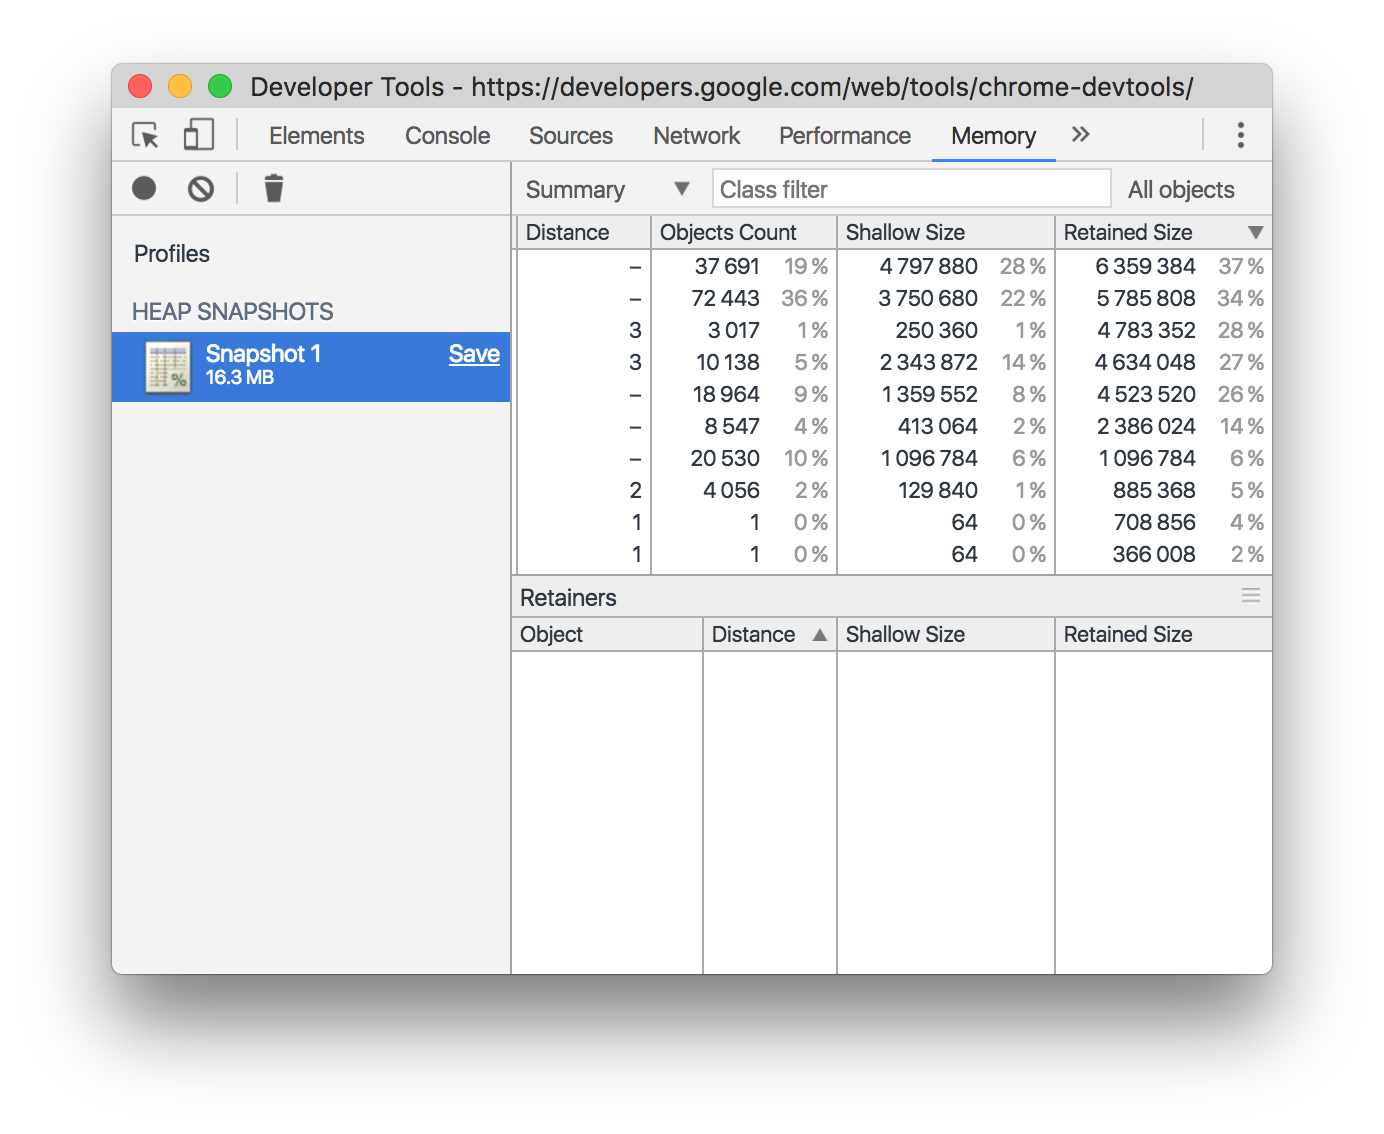
Memory Panel and JavaScript Profiler
It contains several different profilers to track the load that code execution has on the system:
JavaScript CPU Profiler (was moved to a separate JavaScript Profiler panel) - allows you to find out how much CPU time it takes to execute various parts of your JS code.
Take Heap Snapshot - shows the memory allocation among JS objects and the associated DOM elements.
Record Allocation Timeline - records and displays the memory allocation between variables in the code. Effective to eliminate memory leaks.
Record Allocation Profile - records and displays the memory allocation for the execution of individual JS functions.
Key features :
Application Panel
A tab for inspecting and cleaning up all downloaded resources, including IndexedDB or Web SQL databases, local and session storage, cookies, application caches, images, fonts, and style sheets.
Key features :
- Quick cleanup of vaults and caches.
- Inspection and management of storage, databases and cache.
- Inspecting and deleting cookies.
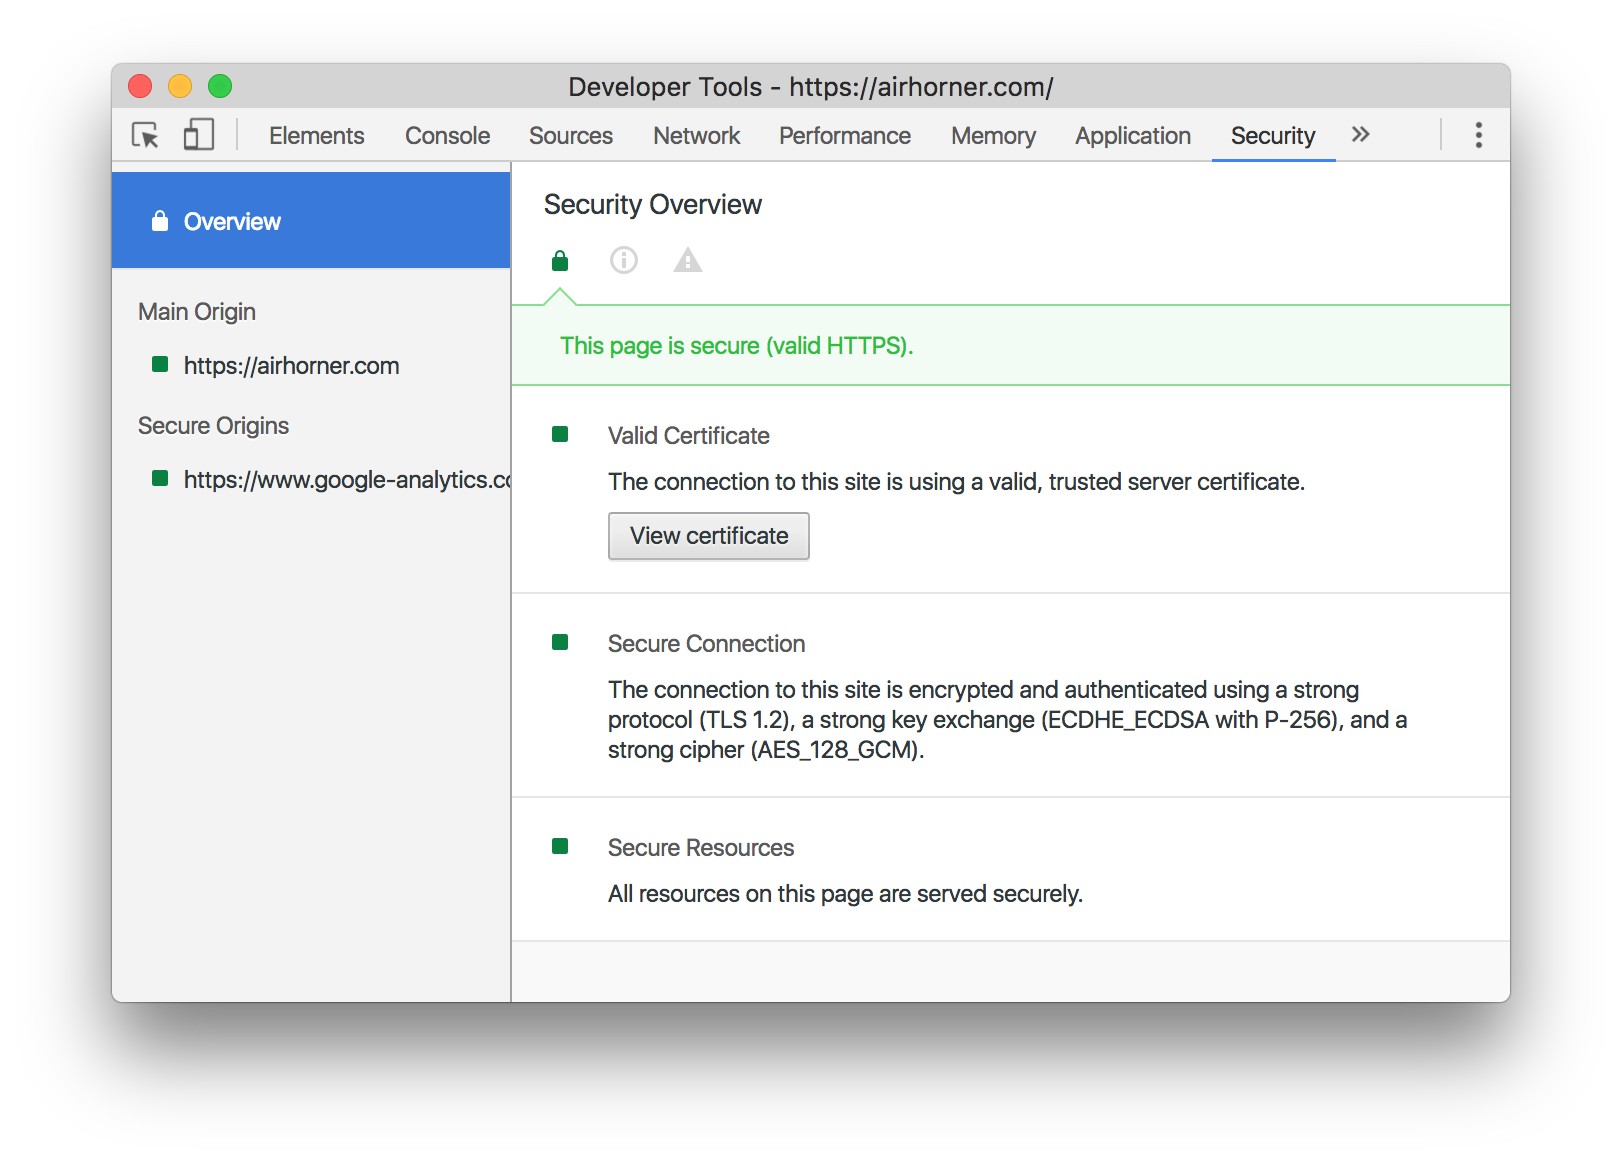
Security panel
On the tab, you can read the security protocol, if available, and view the details of the security certificate, if any.
The tool is used to debug mixed content problems, certificate issues, and more.
Key features :
- The Security Overview window will quickly prompt whether the current page is safe or not.
- The ability to view individual sources to view the connection and certificate details (for secure sources) or to find out which requests are not protected (for unsafe sources).
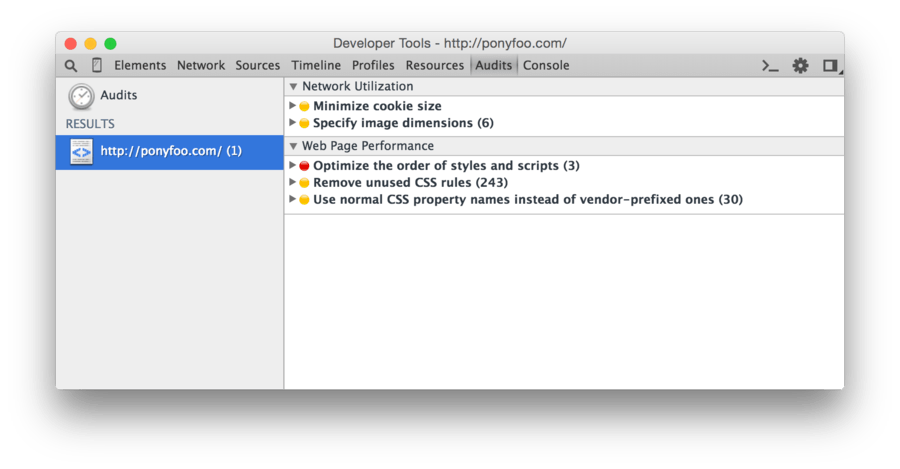
Audits panel
After selecting the desired settings and clicking the Run button, the audit panel analyzes how the page loads and then provides optimization suggestions to reduce page load times and increase its responsiveness.
The following parameters are analyzed: resource caching, gzip compression, the presence of unused parts of JS code and CSS rules, and many other parameters. Further, the user is shown a grouped list of recommendations due to which you can significantly optimize the page loading speed and responsiveness.
Source: https://habr.com/ru/post/337116/
All Articles