Be careful with what you measure - MJIT vs TruffleRuby: 2.1 times slower or 4.2 times faster
Have you seen the results of the MJIT benchmarks ? They are amazing, right? MJIT literally makes all other implementations without options. Where has he been all these years? Everything is now finished with the race?
However, you can understand from the headline that not everything is so simple. But before you understand the problems of these particular benchmarks (of course, you can scroll down to nice charts), you need to consider the important basic basics of benchmarking.
MJIT is a Ruby branch on Github from Vladimir Makarov, a GCC developer , which implements a dynamic JIT compilation ( Just In Time Compilation ) on the most popular Ruby interpreter - CRuby. This is not the final version, on the contrary, the project is at an early stage of development . The promising benchmark results were published on June 15, 2017, and this is the main topic of discussion in this article.
TruffleRuby is an implementation of Ruby on GraalVM from Oracle Labs. It shows impressive performance results, as you could see in my previous article “ Ruby plays Go Rumble ”. It also implements JIT, it needs a little warm-up, but in the end it is about 8 times faster than Ruby 2.0 in the aforementioned benchmark.
')
I have incredible respect for Vladimir, and I think that MJIT is an extremely valuable project. In fact, this may be one of the few attempts to introduce JIT into standard Ruby. JRuby has had JIT for many years and it demonstrates good performance, but this implementation has never become really popular (this is a topic for another article).
I am going to criticize the way the benchmarks were conducted, although I admit that there could be some reasons for this that I missed (I will try to point out those that are known to me). In the end, Vladimir is engaged in programming much longer than I generally live in the world, and obviously knows more about my language implementations.
And once again, this is not a matter of the developer’s personality, but of the way in which benchmarks are conducted. Vladimir, if you read this,
When you see the results of benchmarks, the first question is: “What was measured?” Here the answer is twofold: code and time.
It’s important to know what code tests actually measure: is it relevant to us, is it a good Ruby program? This is especially important if we are going to use benchmarks as a performance indicator for a particular implementation of Ruby.
If you look at the list of benchmarks in the README file (and scroll down to a description of what they mean or examine their code ), then you will see that almost the entire upper half is micro-tests:
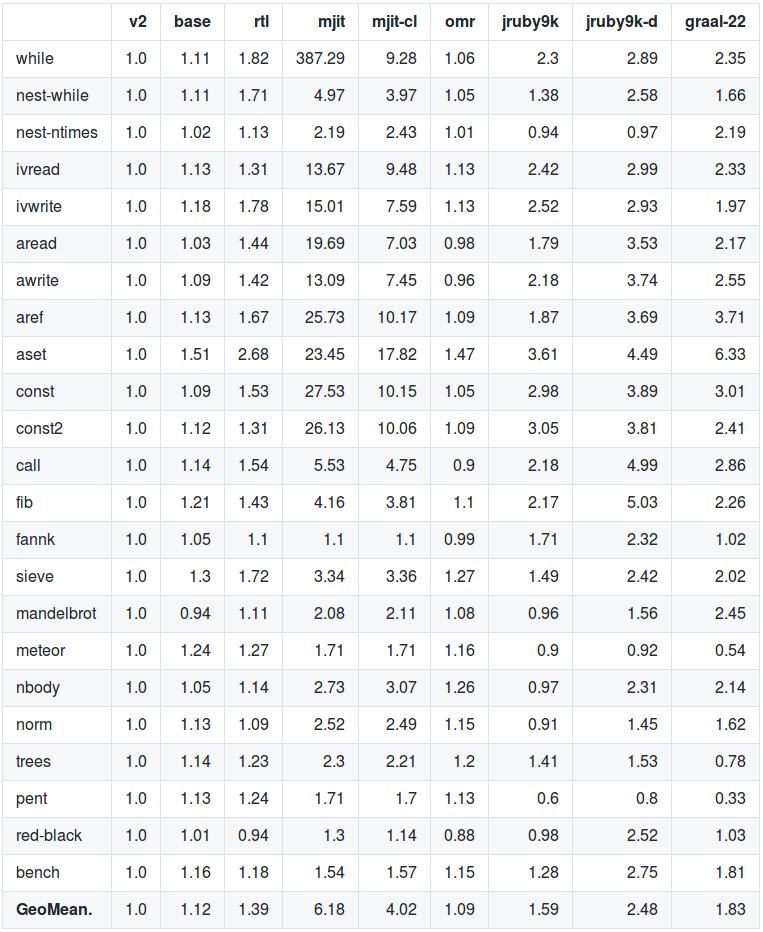
Here you can write to instance variables, read constants, calls to an empty method, while loops, and so on. These are extremely miniature tests, maybe interesting from the point of view of language implementers, but not very much reflecting the actual performance of Ruby. The day the search for a constant becomes a bottleneck in the performance of your Ruby application will be the happiest day. And what part of your code contains while loops?
Most of the code here (not counting micro examples) is not quite what I would call typical Ruby code. Much more like a mix of scripts and C-code. In many places, classes are not defined, while and for cycles are used instead of the more common Enumerable methods, and in some places even bit masks are used.
Some of these designs could result from optimization. Apparently, they are used in common language tests . This is also dangerous, although most of them are optimized for one particular platform, in this case CRuby. The fastest Ruby code on one platform may be much slower on other platforms due to implementation details (for example, a different String implementation is used in TruffleRuby). Naturally, because of this, other implementations are at a disadvantage.
Here the problem is a little deeper: whatever is contained in the popular benchmark, it will inevitably be better optimized for some implementation, but this code should be as close as possible to the real one. Therefore, I am very pleased with the benchmarks of the Ruby 3 × 3 project , these new tests show as if a more relevant result.
This is actually my favorite part of the article and undoubtedly the most important . As far as I know, the time measurements in the original article were made as follows:
What is the problem? Well, let's analyze what is included in the overall result, when we measure only the execution time of the script: start, warm up and execution.

Interestingly, the original benchmark confirms the presence of start-up and warm-up times, but these indicators are processed in such a way that their effect softens, but does not completely disappear: “MJIT starts up very quickly, unlike JRuby and Graal Ruby. To even out the odds for JRuby and Graal Ruby, the benchmarks are modified so that the Ruby MRI v2.0 works for 20–70 s on each test. ”
I believe that in a more well-designed testing scheme, the load and warm-up time does not affect the result, if our goal is to test performance in a long-term process.
Why? Because web applications, for example, are usually long-term processes. We run a web server - and it works hours, days, weeks. We spend time on loading and warming up only once at the very beginning, and then the process takes a long time until we turn off the server. Normal servers should operate in a heated state for more than 99.99% of the time. This is a fact that our benchmarks should reflect: how to get the best performance during the hours / days / weeks of the server, and not in the first seconds or minutes after the download .
As a small analogy, you can bring a car. You are going to drive 300 kilometers in minimum time (in a straight line). Measurement as in the table above can be compared with the measurement of approximately the first 500 meters. Get in the car, accelerate to maximum speed and maybe a little drive at the peak. Is the fastest car really going to drive 300 kilometers faster than anyone in the first 500 meters? Probably not. (Note: I am not good at cars).
What does this mean for our benchmark? Ideally, we need to remove the load and warm up time from it. This can be done using the Ruby test library, which first runs the benchmark several times before taking actual measurements (warm-up time). We use my own small library because it does not need a gem and it is well suited for long-term testing.
Do boot and warm up times really matter? Have Most noticeably, they affect the development process — start the server, reload the code, run tests. For all these tasks, you need to "pay" the time of loading and warming up. Also, if you are developing a UI application or CLI tool for end users, the load and warm-up times can be a problem, since the load happens much more often. You can’t just warm it up before sending it to the load balancer. Another periodic start of processes like cronjob on the server also forces you to waste time on loading and warming up.
So, is there any advantage to measuring the boot and warm up time? Yes, it is important for one of the above situations. And the measurement with the time -v parameter produces much more data:
You get a lot of information, including memory usage, CPU, elapsed time (wall clock) and more, which is also important for evaluating language implementations and therefore also included in the original benchmarks .
Before we (finally!) Move on to benchmarks, we need the obligatory part “This is the system on which the measurements were taken”.
The following versions of Ruby were used: MJIT from this commit for August 25, 2017 , compiled without special settings, graalvm 25 and 27 (more on this later) and CRuby 2.0.0-p648 as the base level.
All this was run on my desktop PC under Linux Mint 18.2 (based on Ubuntu 16.04 LTS) with 16 GB of memory and an i7-4790 processor (3.6 GHz, 4 GHz turbo) .
It seems to me especially important to mention the configuration here, because when I first did tests for the Polyconf conference on my dual-core laptop, the results of TruffleRuby were much worse. I think that graalvm wins from two additional cores for warming up, etc., since the CPU utilization by cores is quite high.
You can check the script for testing and everything else in this repository .
Sorry, it seemed to me that the theory is more important than the test results themselves, although they no doubt help to illustrate the thesis. First, I will explain why I chose the benchmark pent.rb and why I ran it on slightly older versions of graalvm (don't worry, the current version is also in effect). And then, finally, there will be graphs and numbers.
First of all, the original performance tests were launched on graalvm-0.22. An attempt to reproduce the results from the current (at the moment) version of graalvm-0.25 turned out to be difficult, since many of them were already optimized (and version 0.22 contains several authentic performance bugs).
The only benchmark where I was able to reproduce performance problems was pent.rb , and it also most clearly showed an anomaly. In the original benchmarks, it is marked as 0.33 Ruby 2.0 performance (that is, three times slower). But all my experience with TruffleRuby said that this is probably wrong. So I excluded him not because he was the fastest at TruffleRuby, but on the contrary - he was the slowest .
Moreover, although this is in many ways not the most characteristic Ruby code, in my opinion (there are no classes, many global variables), many Enumerable methods are used there, such as each, collect, sort and uniq, while bitmasks are missing, and like that So it seemed to me that here, too, I would receive a relatively good candidate.
The original benchmark was placed in a loop and repeated several times, so that you can measure the warm-up time, and then the average work time at the peak of performance.
So why did I launch it on the old version of graalvm-0.25? Well, whatever is optimized for the benchmark, the difference here will be less obvious.
Benoit Dalouz writes in a tweet below that he optimized the warm-up time of the TruffleRuby for this benchmark, so now TruffleRuby is three times faster than MJIT. He notes that the benchmark code pen.rb uses a global variable instead of an argument to pass the value to the method.
Later we will test the new improved version.
So, on my machine, the initial execution of the pent.rb benchmark (boot time, warm-up and execution) on TruffleRuby 0.25 took 15.05 seconds and only 7.26 seconds on MJIT. That is, MJIT was 2.1 times faster. Impressive!
But what is not to take into account the load and warm up? What if you start the measurement after the interpreter starts? In this case, we run the code in a cycle for 60 seconds to warm up, and then measure the real performance for 60 seconds. The diagram shows the test execution time for the first 15 iterations (after that the TruffleRuby is stabilized):
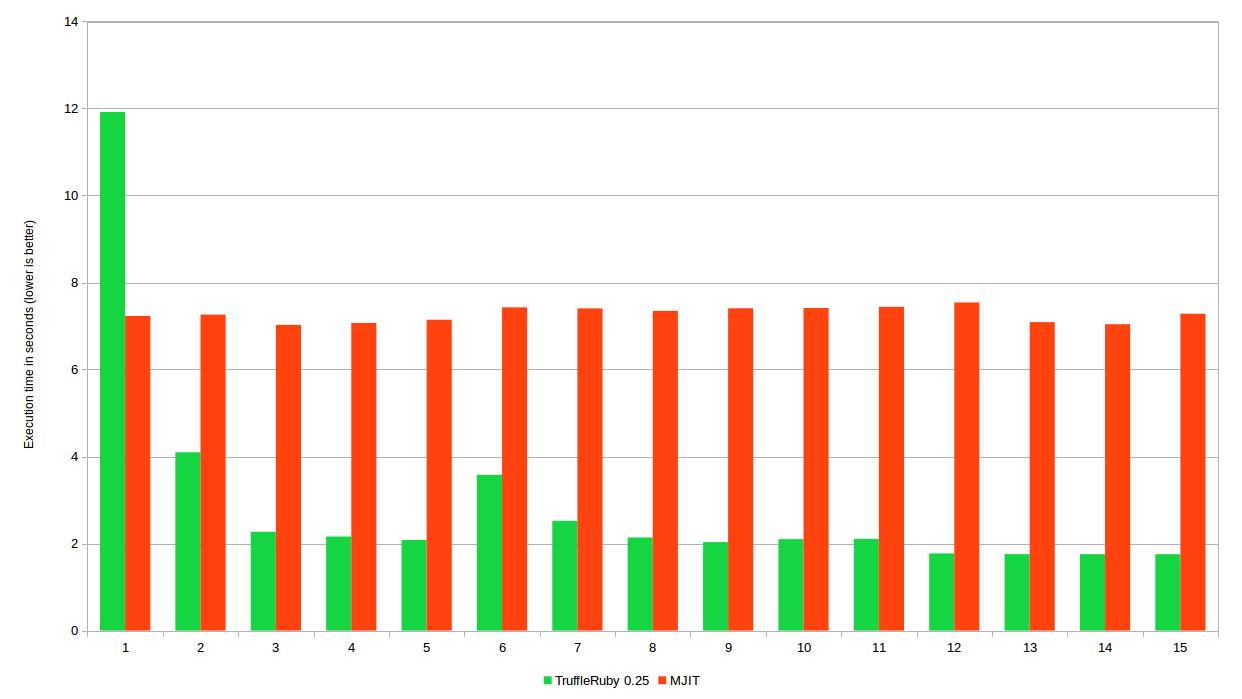
Runtime in TruffleRuby and MJIT gradually changes - iteration after iteration
As you can see, TruffleRuby starts much slower, but then quickly picks up speed, while MJIT continues to work more or less the same . Interestingly, TrufleRuby again slows down in iterations 6 and 7. Or he found a new optimization, which took considerable time to complete, or de-optimization occurred because the limitations of the previous optimization were no longer valid. After that, the TruffleRuby will stabilize and reach peak performance.
When we start the benchmark after warming up, we get an average time of 1.75 seconds for TruffleRuby, and 7.33 seconds for MJIT. That is, with this method of measurement, TruffleRuby is unexpectedly 4.2 times faster than MJIT .
Instead of 2.1 times slower, we got results 4.2 times faster by simply changing the measurement method.
I like to present the test results as the number of iterations per second / minute (ips / ipm), because here the more the better, so the graphs come out more intuitive. Our runtime is converted at 34.25 iterations per minute for TruffleRuby and at 8.18 iterations per minute for MJIT. So now look at the test results, converted as iterations per minute. Here we compare the original measurement method and our new method:
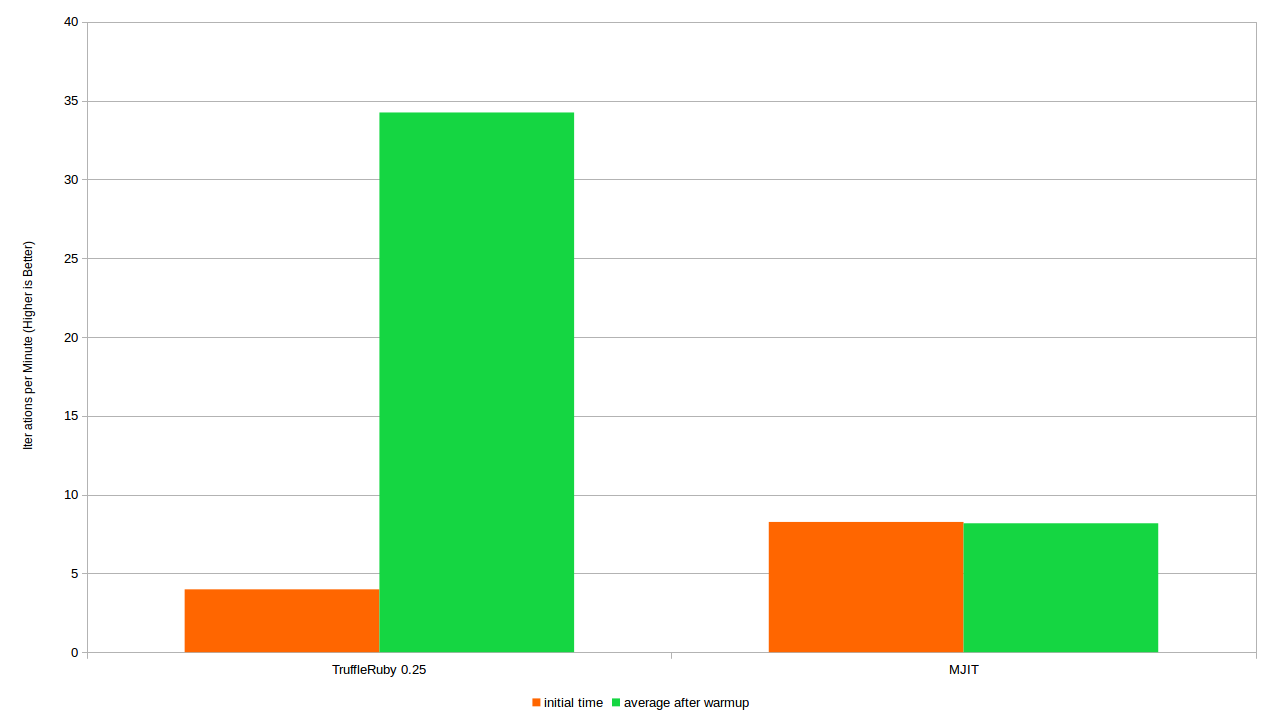
The number of iterations per minute when the entire script is executed (the initial time) and the number of iterations after warming up
The big difference in TruffleRuby results is due to a long warm-up time during the first few iterations. MJIT, on the other hand, is very stable. The difference is quite within the statistical error.
So, I promised you more data, and here they are! This dataset also includes CRuby 2.0 indicators as a baseline for comparison, as well as a new graalvm.

The execution time of each iteration in seconds. CRuby results fade because iterations are over
We see that TruffleRuby 0.27 is faster than MJIT already from the first iteration, which is quite impressive. He also avoided a strange deceleration around the sixth iteration and therefore reached peak performance much faster than TruffleRuby 0.25. The new version has generally become generally faster if we compare the performance after warming up all four competitors:
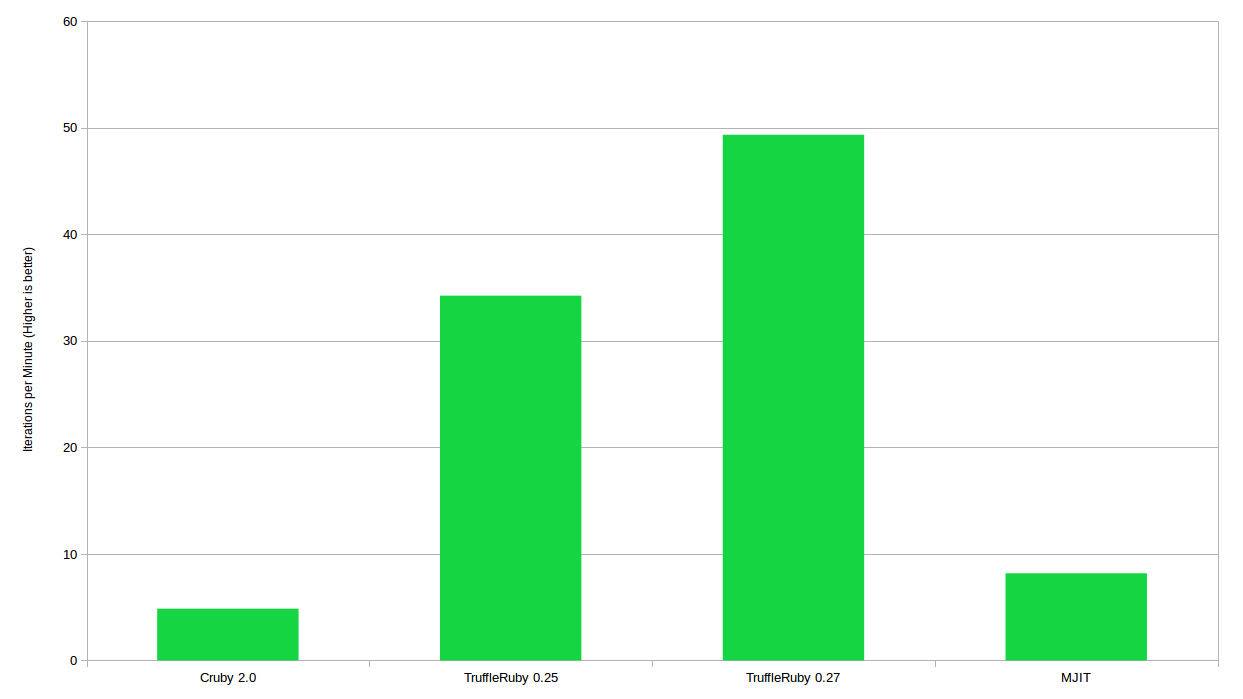
Average number of iterations per minute after warming up for four test participants
So in TruffleRuby 0.27, not only accelerated warming up, but overall, the performance improved slightly. Now it is more than 6 times faster than MJIT. Of course, this was partially due to the fact that the developers of TruffleRuby probably implemented optimization for the existing benchmark. This once again underlines my thesis that we need better performance tests.
As a final fancy diagram, I have a comparison of the total runtime of the script (through time ) and performance after warming up, by the number of iterations per minute.

The difference between the total run time of the script (iterations per minute) and performance after warming up
As expected, CRuby 2 is fairly stable, TruffleRuby immediately shows quite decent performance, but then accelerates several times. I hope this helps you to see that different measurement methods lead to radically excellent results .
So what is the conclusion? Loading time and warming up matter, and you should carefully consider how important these indicators are to you and whether they need to be measured. For web applications, the load and warm-up time is almost irrelevant, because more than 99.99% of the time the program demonstrates performance after warming up.
It is important not only what time we measure, but also what code. Benchmarks should be as realistic as possible so that their results are as meaningful as possible. Any arbitrary test on the Internet is most likely not directly related to what your application does.
ALWAYS RUN YOUR OWN BENCHMARKS AND LOOK WHAT THE CODE IS DETERMINED, HOW THIS IS HAPPENED AND WHAT TIME IS CONSIDERED AT THE BENCHMARK
However, you can understand from the headline that not everything is so simple. But before you understand the problems of these particular benchmarks (of course, you can scroll down to nice charts), you need to consider the important basic basics of benchmarking.
Mjit? TruffleRuby? What is all this?
MJIT is a Ruby branch on Github from Vladimir Makarov, a GCC developer , which implements a dynamic JIT compilation ( Just In Time Compilation ) on the most popular Ruby interpreter - CRuby. This is not the final version, on the contrary, the project is at an early stage of development . The promising benchmark results were published on June 15, 2017, and this is the main topic of discussion in this article.
TruffleRuby is an implementation of Ruby on GraalVM from Oracle Labs. It shows impressive performance results, as you could see in my previous article “ Ruby plays Go Rumble ”. It also implements JIT, it needs a little warm-up, but in the end it is about 8 times faster than Ruby 2.0 in the aforementioned benchmark.
')
Before continuing ...
I have incredible respect for Vladimir, and I think that MJIT is an extremely valuable project. In fact, this may be one of the few attempts to introduce JIT into standard Ruby. JRuby has had JIT for many years and it demonstrates good performance, but this implementation has never become really popular (this is a topic for another article).
I am going to criticize the way the benchmarks were conducted, although I admit that there could be some reasons for this that I missed (I will try to point out those that are known to me). In the end, Vladimir is engaged in programming much longer than I generally live in the world, and obviously knows more about my language implementations.
And once again, this is not a matter of the developer’s personality, but of the way in which benchmarks are conducted. Vladimir, if you read this,

What do we measure?
When you see the results of benchmarks, the first question is: “What was measured?” Here the answer is twofold: code and time.
What code do we measure?
It’s important to know what code tests actually measure: is it relevant to us, is it a good Ruby program? This is especially important if we are going to use benchmarks as a performance indicator for a particular implementation of Ruby.
If you look at the list of benchmarks in the README file (and scroll down to a description of what they mean or examine their code ), then you will see that almost the entire upper half is micro-tests:

Here you can write to instance variables, read constants, calls to an empty method, while loops, and so on. These are extremely miniature tests, maybe interesting from the point of view of language implementers, but not very much reflecting the actual performance of Ruby. The day the search for a constant becomes a bottleneck in the performance of your Ruby application will be the happiest day. And what part of your code contains while loops?
Most of the code here (not counting micro examples) is not quite what I would call typical Ruby code. Much more like a mix of scripts and C-code. In many places, classes are not defined, while and for cycles are used instead of the more common Enumerable methods, and in some places even bit masks are used.
Some of these designs could result from optimization. Apparently, they are used in common language tests . This is also dangerous, although most of them are optimized for one particular platform, in this case CRuby. The fastest Ruby code on one platform may be much slower on other platforms due to implementation details (for example, a different String implementation is used in TruffleRuby). Naturally, because of this, other implementations are at a disadvantage.
Here the problem is a little deeper: whatever is contained in the popular benchmark, it will inevitably be better optimized for some implementation, but this code should be as close as possible to the real one. Therefore, I am very pleased with the benchmarks of the Ruby 3 × 3 project , these new tests show as if a more relevant result.
What time do we measure?
This is actually my favorite part of the article and undoubtedly the most important . As far as I know, the time measurements in the original article were made as follows:
/usr/bin/time -v ruby $script , and this is one of my favorite benchmark errors for programming languages that are widely used in web applications. You can hear more about this in my speech at the conference here .What is the problem? Well, let's analyze what is included in the overall result, when we measure only the execution time of the script: start, warm up and execution.

- The launch is the time before we do something “useful” like running the Ruby Interpreter and parsing the code. For reference, the execution of an empty Ruby file using standard Ruby takes me 0.02 seconds, in MJIT - 0.17 seconds, and in TruffleRuby - 2.5 seconds (although there are plans to significantly reduce this time using Substrate VM ). These seconds are essentially added to each benchmark, if you measure just the runtime of the script.
- Warming up - time before the program starts to work at full speed. This is especially important for implementations on JIT. At a high level, the following happens: they see which code is called most often, and try to further optimize it. This process takes a lot of time, and only after its completion can we talk about achieving real “peak performance”. On warming up, the program can run much slower than at peak performance . Below we will analyze the warm-up timings in more detail.
- Execution is what we call “peak performance” - with fixed execution times. By this stage, most or all of the code is already optimized. This is the level of performance at which code will be executed from now on and in the future. Ideally, you need to measure this performance, because more than 99.99% of the time our code will be executed in the already heated state.
Interestingly, the original benchmark confirms the presence of start-up and warm-up times, but these indicators are processed in such a way that their effect softens, but does not completely disappear: “MJIT starts up very quickly, unlike JRuby and Graal Ruby. To even out the odds for JRuby and Graal Ruby, the benchmarks are modified so that the Ruby MRI v2.0 works for 20–70 s on each test. ”
I believe that in a more well-designed testing scheme, the load and warm-up time does not affect the result, if our goal is to test performance in a long-term process.
Why? Because web applications, for example, are usually long-term processes. We run a web server - and it works hours, days, weeks. We spend time on loading and warming up only once at the very beginning, and then the process takes a long time until we turn off the server. Normal servers should operate in a heated state for more than 99.99% of the time. This is a fact that our benchmarks should reflect: how to get the best performance during the hours / days / weeks of the server, and not in the first seconds or minutes after the download .
As a small analogy, you can bring a car. You are going to drive 300 kilometers in minimum time (in a straight line). Measurement as in the table above can be compared with the measurement of approximately the first 500 meters. Get in the car, accelerate to maximum speed and maybe a little drive at the peak. Is the fastest car really going to drive 300 kilometers faster than anyone in the first 500 meters? Probably not. (Note: I am not good at cars).
What does this mean for our benchmark? Ideally, we need to remove the load and warm up time from it. This can be done using the Ruby test library, which first runs the benchmark several times before taking actual measurements (warm-up time). We use my own small library because it does not need a gem and it is well suited for long-term testing.
Do boot and warm up times really matter? Have Most noticeably, they affect the development process — start the server, reload the code, run tests. For all these tasks, you need to "pay" the time of loading and warming up. Also, if you are developing a UI application or CLI tool for end users, the load and warm-up times can be a problem, since the load happens much more often. You can’t just warm it up before sending it to the load balancer. Another periodic start of processes like cronjob on the server also forces you to waste time on loading and warming up.
So, is there any advantage to measuring the boot and warm up time? Yes, it is important for one of the above situations. And the measurement with the time -v parameter produces much more data:
tobi@speedy $ /usr/bin/time -v ~/dev/graalvm-0.25/bin/ruby pent.rb
Command being timed: "/home/tobi/dev/graalvm-0.25/bin/ruby pent.rb"
User time (seconds): 83.07
System time (seconds): 0.99
Percent of CPU this job got: 555%
Elapsed (wall clock) time (h:mm:ss or m:ss): 0:15.12
Average shared text size (kbytes): 0
Average unshared data size (kbytes): 0
Average stack size (kbytes): 0
Average total size (kbytes): 0
Maximum resident set size (kbytes): 1311768
Average resident set size (kbytes): 0
Major (requiring I/O) page faults: 57
Minor (reclaiming a frame) page faults: 72682
Voluntary context switches: 16718
Involuntary context switches: 13697
Swaps: 0
File system inputs: 25520
File system outputs: 312
Socket messages sent: 0
Socket messages received: 0
Signals delivered: 0
Page size (bytes): 4096
Exit status: 0
You get a lot of information, including memory usage, CPU, elapsed time (wall clock) and more, which is also important for evaluating language implementations and therefore also included in the original benchmarks .
Configuration
Before we (finally!) Move on to benchmarks, we need the obligatory part “This is the system on which the measurements were taken”.
The following versions of Ruby were used: MJIT from this commit for August 25, 2017 , compiled without special settings, graalvm 25 and 27 (more on this later) and CRuby 2.0.0-p648 as the base level.
All this was run on my desktop PC under Linux Mint 18.2 (based on Ubuntu 16.04 LTS) with 16 GB of memory and an i7-4790 processor (3.6 GHz, 4 GHz turbo) .
tobi@speedy ~ $ uname -a
Linux speedy 4.10.0-33-generic #37~16.04.1-Ubuntu SMP Fri Aug 11 14:07:24 UTC 2017 x86_64 x86_64 x86_64 GNU/Linux
It seems to me especially important to mention the configuration here, because when I first did tests for the Polyconf conference on my dual-core laptop, the results of TruffleRuby were much worse. I think that graalvm wins from two additional cores for warming up, etc., since the CPU utilization by cores is quite high.
You can check the script for testing and everything else in this repository .
But ... you promised the benchmarks, where are they?
Sorry, it seemed to me that the theory is more important than the test results themselves, although they no doubt help to illustrate the thesis. First, I will explain why I chose the benchmark pent.rb and why I ran it on slightly older versions of graalvm (don't worry, the current version is also in effect). And then, finally, there will be graphs and numbers.
Why is this benchmark?
First of all, the original performance tests were launched on graalvm-0.22. An attempt to reproduce the results from the current (at the moment) version of graalvm-0.25 turned out to be difficult, since many of them were already optimized (and version 0.22 contains several authentic performance bugs).
The only benchmark where I was able to reproduce performance problems was pent.rb , and it also most clearly showed an anomaly. In the original benchmarks, it is marked as 0.33 Ruby 2.0 performance (that is, three times slower). But all my experience with TruffleRuby said that this is probably wrong. So I excluded him not because he was the fastest at TruffleRuby, but on the contrary - he was the slowest .
Moreover, although this is in many ways not the most characteristic Ruby code, in my opinion (there are no classes, many global variables), many Enumerable methods are used there, such as each, collect, sort and uniq, while bitmasks are missing, and like that So it seemed to me that here, too, I would receive a relatively good candidate.
The original benchmark was placed in a loop and repeated several times, so that you can measure the warm-up time, and then the average work time at the peak of performance.
So why did I launch it on the old version of graalvm-0.25? Well, whatever is optimized for the benchmark, the difference here will be less obvious.
Benoit Dalouz writes in a tweet below that he optimized the warm-up time of the TruffleRuby for this benchmark, so now TruffleRuby is three times faster than MJIT. He notes that the benchmark code pen.rb uses a global variable instead of an argument to pass the value to the method.
Later we will test the new improved version.
MJIT vs Graalvm-0.25
So, on my machine, the initial execution of the pent.rb benchmark (boot time, warm-up and execution) on TruffleRuby 0.25 took 15.05 seconds and only 7.26 seconds on MJIT. That is, MJIT was 2.1 times faster. Impressive!
But what is not to take into account the load and warm up? What if you start the measurement after the interpreter starts? In this case, we run the code in a cycle for 60 seconds to warm up, and then measure the real performance for 60 seconds. The diagram shows the test execution time for the first 15 iterations (after that the TruffleRuby is stabilized):

Runtime in TruffleRuby and MJIT gradually changes - iteration after iteration
As you can see, TruffleRuby starts much slower, but then quickly picks up speed, while MJIT continues to work more or less the same . Interestingly, TrufleRuby again slows down in iterations 6 and 7. Or he found a new optimization, which took considerable time to complete, or de-optimization occurred because the limitations of the previous optimization were no longer valid. After that, the TruffleRuby will stabilize and reach peak performance.
When we start the benchmark after warming up, we get an average time of 1.75 seconds for TruffleRuby, and 7.33 seconds for MJIT. That is, with this method of measurement, TruffleRuby is unexpectedly 4.2 times faster than MJIT .
Instead of 2.1 times slower, we got results 4.2 times faster by simply changing the measurement method.
I like to present the test results as the number of iterations per second / minute (ips / ipm), because here the more the better, so the graphs come out more intuitive. Our runtime is converted at 34.25 iterations per minute for TruffleRuby and at 8.18 iterations per minute for MJIT. So now look at the test results, converted as iterations per minute. Here we compare the original measurement method and our new method:

The number of iterations per minute when the entire script is executed (the initial time) and the number of iterations after warming up
The big difference in TruffleRuby results is due to a long warm-up time during the first few iterations. MJIT, on the other hand, is very stable. The difference is quite within the statistical error.
Ruby 2.0 vs MJIT vs Graalvm-0.25 vs GRAALVM-0.27
So, I promised you more data, and here they are! This dataset also includes CRuby 2.0 indicators as a baseline for comparison, as well as a new graalvm.
| initial time (sec) | ipm start time | average (s) | ipm average after warming up | standard deviation as part of the total | |
| CRuby 2.0 | 12.3 | 4.87 | 12.34 | 4.86 | 0.43% |
| TruffleRuby 0.25 | 15.05 | 3.98 | 1.75 | 34.25 | 0.21% |
| TruffleRuby 0.27 | 8.81 | 6.81 | 1.22 | 49.36 | 0.44% |
| Mjit | 7.26 | 8.26 | 7.33 | 8.18 | 2.39% |

The execution time of each iteration in seconds. CRuby results fade because iterations are over
We see that TruffleRuby 0.27 is faster than MJIT already from the first iteration, which is quite impressive. He also avoided a strange deceleration around the sixth iteration and therefore reached peak performance much faster than TruffleRuby 0.25. The new version has generally become generally faster if we compare the performance after warming up all four competitors:

Average number of iterations per minute after warming up for four test participants
So in TruffleRuby 0.27, not only accelerated warming up, but overall, the performance improved slightly. Now it is more than 6 times faster than MJIT. Of course, this was partially due to the fact that the developers of TruffleRuby probably implemented optimization for the existing benchmark. This once again underlines my thesis that we need better performance tests.
As a final fancy diagram, I have a comparison of the total runtime of the script (through time ) and performance after warming up, by the number of iterations per minute.

The difference between the total run time of the script (iterations per minute) and performance after warming up
As expected, CRuby 2 is fairly stable, TruffleRuby immediately shows quite decent performance, but then accelerates several times. I hope this helps you to see that different measurement methods lead to radically excellent results .
Conclusion
So what is the conclusion? Loading time and warming up matter, and you should carefully consider how important these indicators are to you and whether they need to be measured. For web applications, the load and warm-up time is almost irrelevant, because more than 99.99% of the time the program demonstrates performance after warming up.
It is important not only what time we measure, but also what code. Benchmarks should be as realistic as possible so that their results are as meaningful as possible. Any arbitrary test on the Internet is most likely not directly related to what your application does.
ALWAYS RUN YOUR OWN BENCHMARKS AND LOOK WHAT THE CODE IS DETERMINED, HOW THIS IS HAPPENED AND WHAT TIME IS CONSIDERED AT THE BENCHMARK
Source: https://habr.com/ru/post/337100/
All Articles