Using Graphviz for flowcharts
We create software for developing and maintaining Oracle databases, and the PL / SQL static analyzer is one of the main features of our applications. Anyone familiar with Oracle, knows well what PL / SQL is.
A well-known saying says: "It is better to see once than hear a hundred times." Therefore, we decided to impose a static analyzer in such a way that it visualized the code in the form of flowcharts and call charts. Although it is easy to draw blocks and their connections, optimizing their location on the “sheet” seemed to be a task requiring considerable effort. In order for the arrows to intersect at the minimum and flow around the blocks, the blocks were combined into groups, and the diagram did not turn into a “mess”, you had to spend a lot of time and effort.
And then we decided to look for a ready-made solution, so as not to reinvent the wheel. Graphviz, an open source chart visualization solution, immediately caught our attention. Its first versions were developed by AT & T, and now it is available as a set of utilities and libraries, as well as in source code under the Eclipse Public License (EPL).
')
Its diagram engine uses the DOT graph description language, which is a textual description of the structure of the graph: vertices, their connections, groups, and attributes for their visual design.
Description of the simplest graph:
If it is necessary to add attributes to nodes, for example, signatures, then nodes need to be described separately:
Further I will show on the example of a simple procedure in PL / SQL:
The code is understandable, even if you are not familiar with the PL / SQL syntax.
And now we will describe this code in the DOT language. Explanations are again unnecessary:
Now you can “feed” this Graphviz file by substituting the names of the output (png) and input (dot) files instead of% PNGFILE% and% DOTFILE%, respectively:
With the help of Graphviz from the description above we get this picture:
Visually, but very ascetic.
You can make the diagram more attractive by adding attributes to define the shape of the blocks
We can also combine into a subgraph blocks that are executable. This is implemented by the
It turns out quite nice flowchart, which people are not ashamed to show.
So that the code could be read not only by programmers, but also by “mere mortals”, we came up with such a feature: we attached the recognition of special tags in the comments that the developer would write as pseudocode, the language for describing algorithms. This helped increase the value of the flowchart, which can now display business logic, and not just visualize the listing.
Voila! Graphviz gives you the ability to do amazing visualizations with minimal cost.
A well-known saying says: "It is better to see once than hear a hundred times." Therefore, we decided to impose a static analyzer in such a way that it visualized the code in the form of flowcharts and call charts. Although it is easy to draw blocks and their connections, optimizing their location on the “sheet” seemed to be a task requiring considerable effort. In order for the arrows to intersect at the minimum and flow around the blocks, the blocks were combined into groups, and the diagram did not turn into a “mess”, you had to spend a lot of time and effort.
And then we decided to look for a ready-made solution, so as not to reinvent the wheel. Graphviz, an open source chart visualization solution, immediately caught our attention. Its first versions were developed by AT & T, and now it is available as a set of utilities and libraries, as well as in source code under the Eclipse Public License (EPL).
')
Its diagram engine uses the DOT graph description language, which is a textual description of the structure of the graph: vertices, their connections, groups, and attributes for their visual design.
Description of the simplest graph:
digraph graphname { a -> b; } If it is necessary to add attributes to nodes, for example, signatures, then nodes need to be described separately:
digraph graphname { a [label="source"] b [label="destination"] a -> b; } Further I will show on the example of a simple procedure in PL / SQL:
CREATE PROCEDURE WRITE_STRING( P_MESSAGE_TYPE IN NUMBER , P_MESSAGE IN VARCHAR2 ) IS BEGIN IF P_MESSAGE_TYPE >= LOG_LEVEL THEN ADD_LOG_RECORD(P_MESSAGE_TYPE, P_MESSAGE); END IF; END WRITE_STRING; The code is understandable, even if you are not familiar with the PL / SQL syntax.
And now we will describe this code in the DOT language. Explanations are again unnecessary:
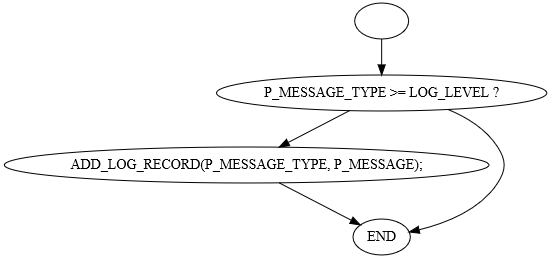
digraph G { N0 [label="”] N1_COND [label="P_MESSAGE_TYPE \>= LOG_LEVEL ?"]; N2 [label="ADD_LOG_RECORD(P_MESSAGE_TYPE, P_MESSAGE);"]; EXIT_LABEL [label="END"]; N0 -> N1_COND N1_COND -> N2 N1_COND -> EXIT_LABEL N2 -> EXIT_LABEL } Now you can “feed” this Graphviz file by substituting the names of the output (png) and input (dot) files instead of% PNGFILE% and% DOTFILE%, respectively:
dot -v -Tpng –o%PNGFILE% %DOTFILE% With the help of Graphviz from the description above we get this picture:
Visually, but very ascetic.
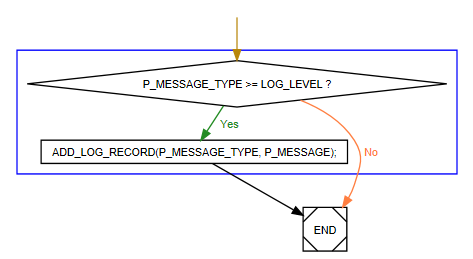
You can make the diagram more attractive by adding attributes to define the shape of the blocks
(shape=diamond) , the arrows' (label="Yes") and the colors, fontcolor .We can also combine into a subgraph blocks that are executable. This is implemented by the
subgraph {} construct, within which we can list the names of the blocks included in the subgraph and specify the attributes for the visual appearance (frame color). digraph G { comment="PL/SQL flowchart generated by ClearSQL"; node [fontname="Arial", fontsize=8, height=.2, width=.25, color="#000000", fontcolor="#000000"]; edge [fontname="Arial", fontsize=8, arrowsize=.8, color="#000000", fontcolor="#000000"]; N0 [shape=plaintext, label="", style=invis]; N1_COND [shape=diamond, conditional=true, label="P_MESSAGE_TYPE \>= LOG_LEVEL ?"]; N2 [shape=box, label="ADD_LOG_RECORD(P_MESSAGE_TYPE, P_MESSAGE);"]; EXIT_LABEL [shape=Msquare, label="END"]; N0 -> N1_COND [color=darkgoldenrod]; N1_COND -> N2 [label=" Yes " color="#228b22" fontcolor="#228b22"]; N1_COND -> EXIT_LABEL [label=" No " color="#ff7e40" fontcolor="#ff7e40"]; N2 -> EXIT_LABEL subgraph "cluster_#1" { color="#0000ff"; N1_COND; N2 } } It turns out quite nice flowchart, which people are not ashamed to show.
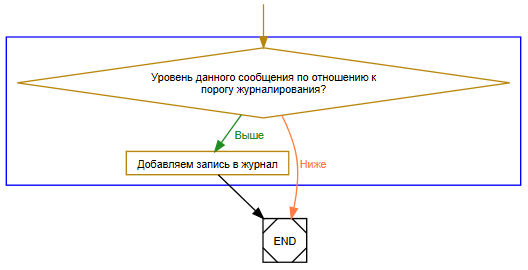
So that the code could be read not only by programmers, but also by “mere mortals”, we came up with such a feature: we attached the recognition of special tags in the comments that the developer would write as pseudocode, the language for describing algorithms. This helped increase the value of the flowchart, which can now display business logic, and not just visualize the listing.
CREATE PROCEDURE WRITE_STRING( P_MESSAGE_TYPE IN NUMBER , P_MESSAGE IN VARCHAR2 ) IS BEGIN --## --##@true --##@false IF P_MESSAGE_TYPE >= LOG_LEVEL THEN --## ADD_LOG_RECORD(P_MESSAGE_TYPE, P_MESSAGE); END IF; END WRITE_STRING; Voila! Graphviz gives you the ability to do amazing visualizations with minimal cost.
Source: https://habr.com/ru/post/337078/
All Articles