Azure Monitor: features and limitations
Today I would like to share with you a note that appeared as a result of my small research on the key features of Azure Monitor.
Opportunities
Based on Microsoft docs, the key features of the tool can be described as follows:
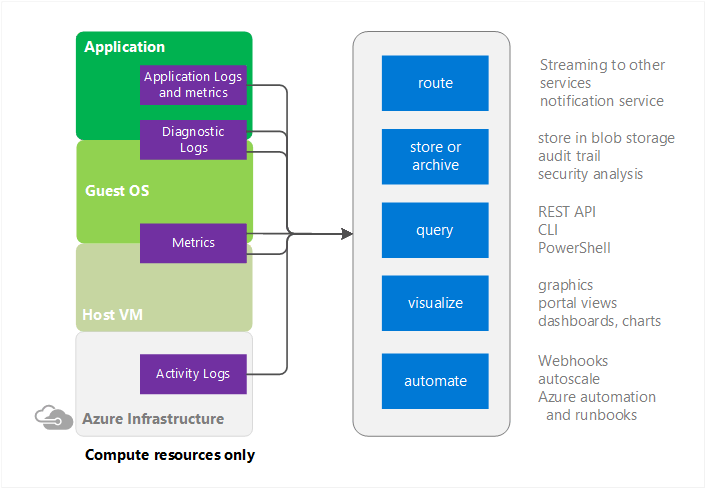
- route - data streaming between services and alert functionality;
- store and arhive - data storage;
- query - providing access to data for reading;
- visualize - visualization, presentation and analytics;
- automate - automation and process triggers (autoscale, email, webhook);
The image below is typical for calculated (executable) resources and differs from non-calculated ones only by the presence of Application Logs and metrics.
')
Activity log
This monitoring section contains information on operations performed within specific components (resources):
- Name (type) of operation;
- Who initiated it and when it was completed;
- The status of its implementation;
In addition, opportunities are provided:
- Export to Storage Account & Azure Event Hub;
- Access via PowerShell & REST API;
- Add alert rules;
- PowerBI analysis;

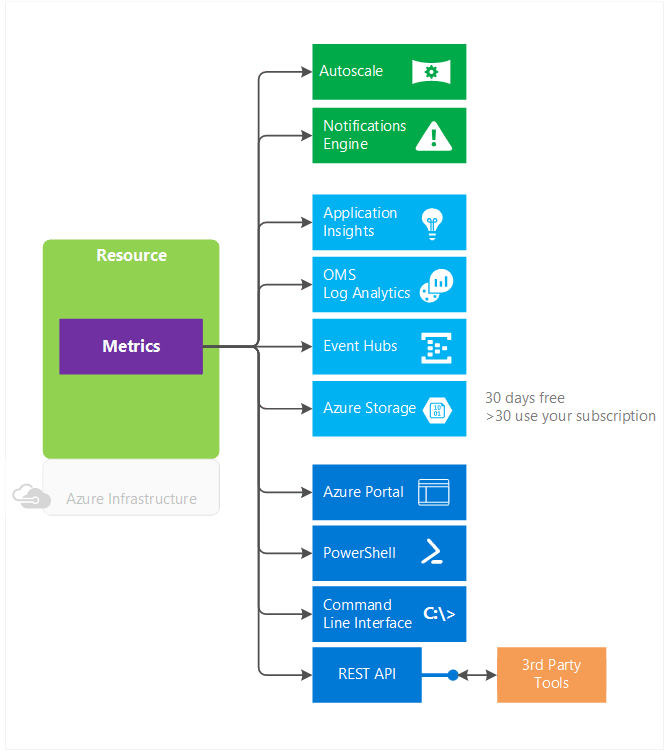
Metrics and Events
In addition to the ability to track information about metrics and events used by components of Azure is also available to add your own custom metrics & events.
If we want to take an action based on the value of the metric, then the alert and response system will help us, in the arsenal of which there is an opportunity to send email notifications, call a webhook or launch a logic app (using a request trigger).
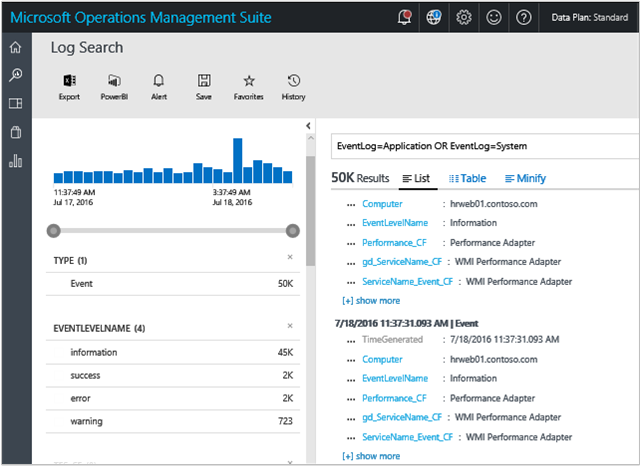
Log search
Thanks to log search and a specialized query language, the ability to perform query / filter / aggregate is applicable to logs and metrics, as well as to visualize the final results in the required form (table, list, bar).
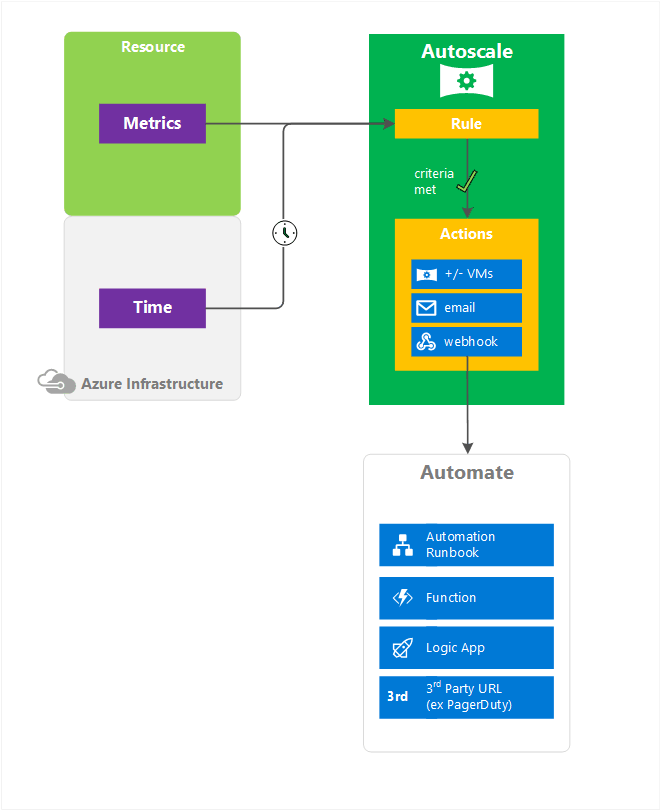
Autoscale
Horizontal scaling is based on the occurrence of one of two types of conditions:
- Based on the value of the metric, for example, increase the number of running instances of a resource in case of exceeding the use of% CPU or loading of RAM;
- Based on the schedule — for example, if the workload on weekends is reduced, then the number of copies can be reduced to the necessary minimum;
Azure Service Health
With a component such as Azure Service Health, it is possible to learn in a timely manner about technical work and failures in the Azure infrastructure that may affect the availability of services and resources deployed in the cloud. Alerts can be notifications by mail, phone or webhook.
You also have the opportunity to prepare in advance for the scheduled maintenance of Azure.

Restrictions
The delay in sending notifications about the occurrence of events - this can be called rather restrictively, however, a notification about the triggering of a rule will be received within one to five minutes.
There is no vertical scaling - at the moment it is possible to change the number of running instances (both up and down), but not their computational power. This is due to the restrictions imposed on this type of scaling - the possible lack of hardware and the need to restart.
Not all Azure services currently place information on the Azure Monitor, however, this will be implemented in the future.
The shelf life of metrics and activity log entry is limited to 30 and 90 days, respectively (for longer duration, you need to connect Azure storage).
Conclusion
In conclusion, we can say that the tool considered in this article allows:
- Uniquely answer who, when and what actions performed applicable to resources or infrastructure;
- Receive, analyze and visualize information about the actions performed;
- Add a set of rules and actions to respond when they occur;
Useful links:
Source: https://habr.com/ru/post/336922/
All Articles