All on the shelves: thematic web analytics on the Internet with Rambler / Top 100, part 2. Analytics of blocks

We continue a series of articles on the study of the behavior of site visitors using Rambler / Top-100. Last time we told you how to evaluate the popularity of different content on the site using the report “Site Sections”. Now we will try to evaluate the effectiveness of various elements of the page, as well as examine the effectiveness of cross-promotion of content (for example, recommendation systems) and analyze the effectiveness of headings.
Each manager - whether he manages a product or a project - wants to know everything about how the interface of the site under his control works. First of all, there are simple questions: where do people click on a specific page? How does this interface block work by itself and how much more clickable is it compared to its neighbor? What is the CTR of the target button?
')
Each page of a content site, as a rule, is closely related to others - in order to retain visitors it is important to constantly offer them interesting materials, increasing the time spent on the site and the depth of viewing. Let's rise to a higher level and try to assess the popularity of content by other parameters: by clicking on the clickthrough rate (CTR) of headings, headings, recommendations blocks and other navigation elements of the page. Rambler / Top-100 has a convenient tool for such an assessment - the Block Analytics report, in which there are three indicators: block impressions, block clicks and CTR (ratio of clicks to impressions).
Analytics blocks on the example of a report on Rambler / likes
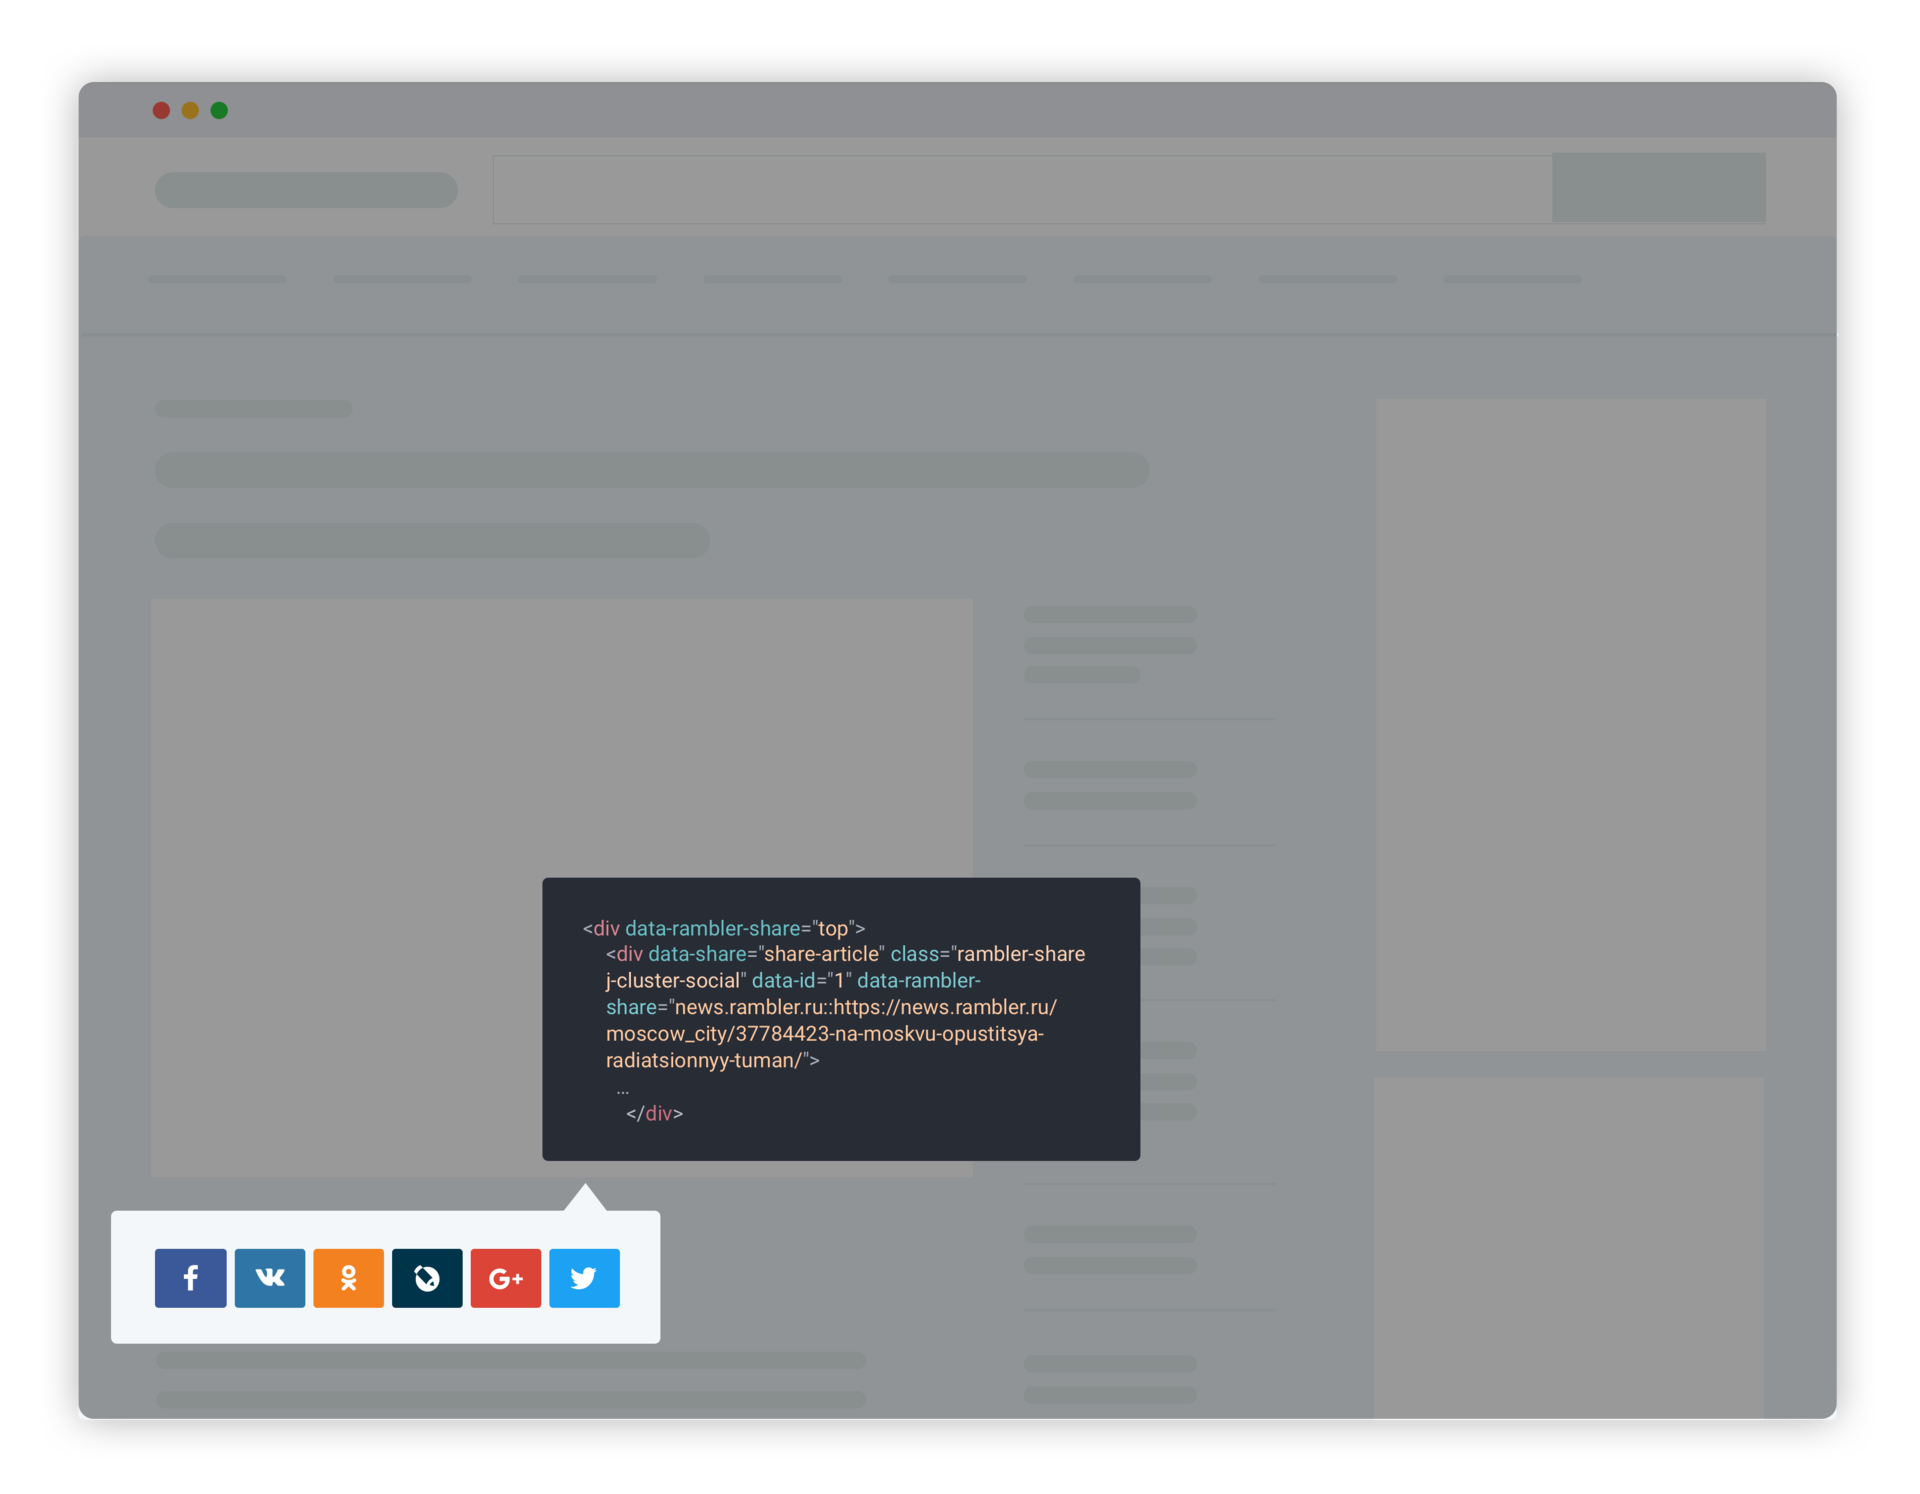
In 2016, Rambler launched the designer of social networking buttons Rambler / Huskies . Consider the example of Rambler / likes, how the "Analytics of blocks" works. But first, a few words about the Likes themselves. In the designer Rambler / Likes, you can select different social networks, customize the appearance of the buttons and their behavior, and in the end you will receive the widget code with buttons to insert into the site. When designing Likes, we wanted to allow widget users to view statistics on the set buttons. Of all the tools for collecting data on user behavior available in Rambler / Top 100, the choice fell on “Block Analytics”: with its help, you can get information on the clickability of the buttons on each page with the necessary detail.
The buttons in the original widget are already labeled with the rambler-share data attribute, which is visible to any Top-100 counter. The data on the buttons can be seen in the Behavior / Rambler / Like report, if you have a Top 100 account and social networks buttons installed on your website.
When a page with the Likes widget is installed, the event bl is sent to the Top-100 counter, containing the following parameters for each social network button: rambler-share :: domain :: page_url :: social_network . When you click on any button, the cl event leaves with the same path. As a result, in the Rambler / Like report we see impressions, clicks and CTR for each social network button on each page of the site.
The data on the clicks are summarized at each next level so that you can see the total number of attempts to send to the social network using the buttons. If one counter is on multiple domains, you can view the statistics by domain. Data for impressions for the upper levels is calculated by summing the maximum value among the sublevels and the values of impressions of chains with a shortened path (without sublevels). For the Rambler / Like widget, this is not relevant, since the widget works entirely, during its normal operation, a situation is impossible when there are no buttons.
If necessary, the markup can be manually added to the levels to collect more detailed data. For example, as it is done on Rambler / News, where there are three widgets of Likes in different parts of the page, and the top level is added to the markup, specifying the location of the block. This allows you to look at the statistics for each button widget separately and compare them with each other.
Looking ahead, it is worth noting that when marking blocks you can use the existing page structure: for each div, specify the corresponding hierarchy of markup. Next we look at this method in more detail.
More about markup
As you can see from the example above, using the "Analytics of blocks" report you can analyze the clickability of various elements on a page. In fact, this is a map of clicks you manage for all pages of the site: you choose which elements are important for you and how they are hierarchically ordered, and you get detailed statistics on their CTR.
This, of course, is not magic - in order to collect data, you will have to finish a little: mark up the blocks of interest with data-attributes and pass them to the counter initialization code as the values of the attributes_dataset parameter. If you specify this parameter, the Top-100 usability.js counter module will be loaded onto the site, which will begin collecting data. The code for collecting by tagged blocks is connected with a separate module so that the simplified version of the Top 100 counter is as easy as possible.
Now let's talk about how data is collected. After the page loads, the counter “listens” to the data-attributes transferred to it and captures the displays of the loaded tagged blocks. This “audition” occurs several times at the time the page is displayed in order to collect displays of the elements loaded later. Clicks are recorded directly with the appropriate action of the visitor. The Block Analytics report is hierarchical: at the top level, you will see the transferred data attributes, each of which can be expanded into a tree up to 8 levels deep (the depth depends on the configured markup). Several levels can be useful for pages with a complex hierarchical structure, for which the effectiveness of both specific links and whole blocks with links should be measured. CTR is calculated as the ratio of clicks to impressions at each level. An example of the counter initialization code with the connection of the Block Analytics module will be lower, but for now let's talk about the markup itself.

We recommend starting with designing the markup on paper, and then moving on to the introduction to the site. First you need to define the purpose of data collection. For example, what information is not enough to assess the effectiveness of the site and its pages? Information about what actions visitors need to collect to get enough data to assess? The collected data should answer the questions you posed and be easy to read, so it is important to choose the optimal number of attributes and come up with clear names for all necessary levels. The approach “let's mark everything up, and then we will understand”, as a rule, leads to numerous questions and changes in markup in the future. Which in turn makes the report unreadable on long time periods: the same data is collected in different branches. The same applies to the option when the developer comes up with the markup, not the manager, who subsequently works with the report. When choosing unsuccessful names, there is a great chance that in a couple of weeks it will be difficult to remember what data was collected for a particular parameter and why they are needed.
Customize the markup and interpret the results.
Let's return to our example from the first article of the cycle with a content site for schoolchildren and parents. Consider the layout for two pages: the main and standard pages of the article. Suppose on the main page there are the following semantic blocks: header, navigation bar, popular materials, new materials, recommendations, partners materials. On the article page: header, navigation bar, recommendations, popular materials from the same section, popular materials (as on the main page), new materials.
For example, the site owner wants to find answers to the following questions:
Which of the blocks with materials is more clickable on the main page and on the pages of articles? Materials from which sections attract more attention? How many transitions does each section receive from blocks with recommendations? Articles from which sections provide more transitions?
To do this, you can use the following hierarchy: Main page / Section name :: Block name (menu, recommendations, popular, new) :: Section with link to material :: Rubric :: Title of section / Section name (for menu)
The top level can be set to date attributes. The only inconvenience in this case will be that the date attribute must be specified in roman letters. The markup itself may look like this: middleandsenior :: Recommendations :: Admission :: Choice of university: 10 reasons to enter MSU.
In the code for the initialization of the counter you will need to pass all the values of the date attributes:
<!-- Top100 (Kraken) Counter --> <script> (function (w, d, c) { (w[c] = w[c] || []).push(function() { var options = { project: PROJECT_ID, attributes_dataset: ['main', 'primary', 'middleandsenior', 'graduation', 'materials'] }; try { w.top100Counter = new top100(options); } catch(e) { } }); var n = d.getElementsByTagName("script")[0], s = d.createElement("script"), f = function () { n.parentNode.insertBefore(s, n); }; s.type = "text/javascript"; s.async = true; s.src = (d.location.protocol == "https:" ? "https:" : "http:") + "//st.top100.ru/top100/top100.js"; if (w.opera == "[object Opera]") { d.addEventListener("DOMContentLoaded", f, false); } else { f(); } })(window, document, "_top100q"); </script> The report will look like this:
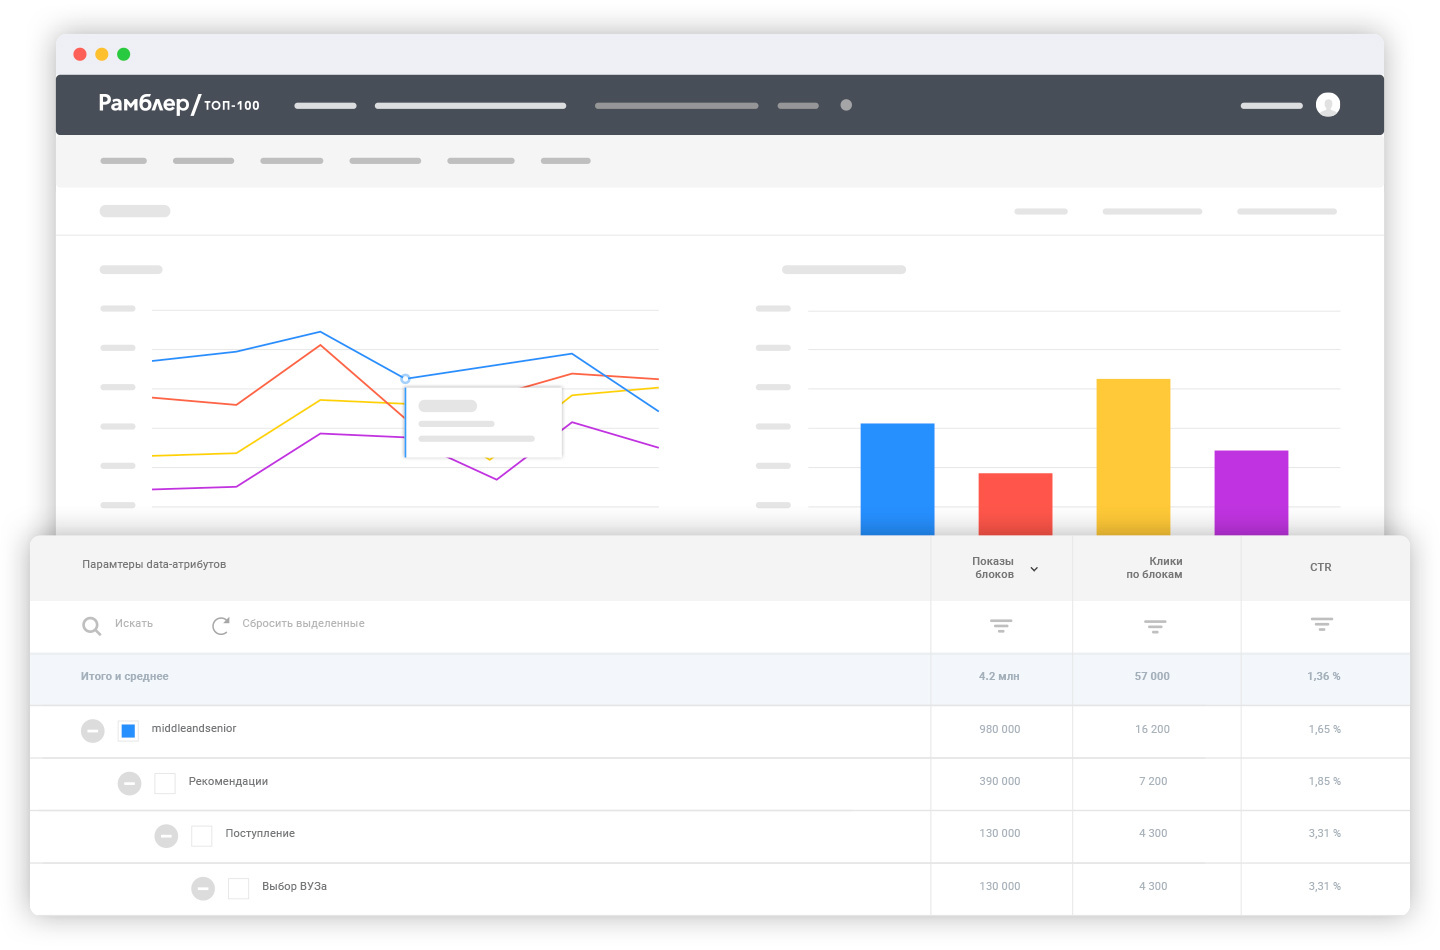
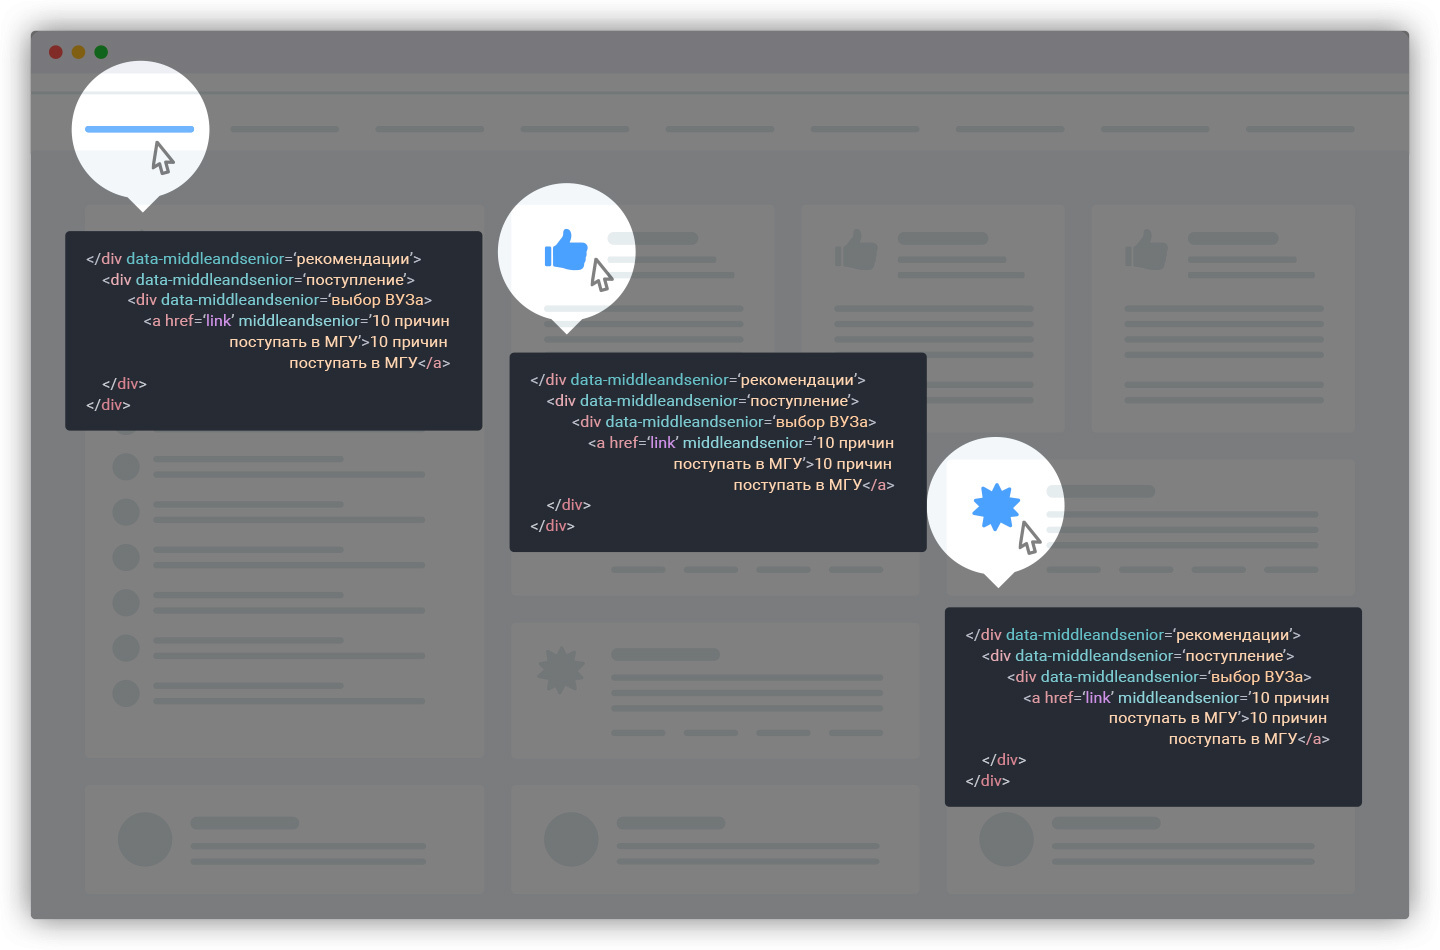
In this case, the names of the data attributes correspond to the names of the sections. Block marking can be transmitted in two ways: at each nesting level, the full path can be passed or the logical page hierarchy can be used. For example, for a link to the article “10 reasons to enter MSU” in the recommendation block on the material page in the section “Middle and High School”, the markup would look like this: data-middleandsenior = recommendations :: admission :: university selection :: 10 reasons to enter Moscow State University.
Either way:
<div data-middleandsenior=''> <div data-middleandsenior=''> <div data-middleandsenior=' > <a href='link' middleandsenior='10 '>10 </a> </div> </div> Thanks to this markup, it will be easy to compare the overall clickability of links across different blocks and see which materials from which sections are most popular in each of the semantic blocks of pages. You can also compare the overall clickability of the pages of different sections.
If first of all you want to compare the popularity of materials from different sections, you can change the hierarchy like this: Home / Section Name :: Section with link to material :: Block name (menu, recommendations, popular, new) :: Topic :: Material name / Section name (for the menu).
Block analytics can be used to test headers. Suppose the task is to choose one heading out of five options for an article. The experiment assumes that the same header is always shown to the same user, and the samples of users are the same and homogeneous. Also suppose that the articles in the recommendation blocks are rotated so that each heading is shown approximately the same number of times. The following markup is suitable for this task:
- Title 1 :: Block name (menu, recommendations, popular, new) :: Home / Section name
- Title 2 :: Block name (menu, recommendations, popular, new) :: Home / Section name
- Title 3 :: Block name (menu, recommendations, popular, new) :: Home / Section name
etc.
If headers are tested for several articles at the same time, it makes sense to add an article ID to the top level.
- Article 1 :: Title 1 :: Block name (menu, recommendations, popular, new) :: Main page / Section title
- Article 1 :: Title 2 :: Block name (menu, recommendations, popular, new) :: Home / Section name
- Article 2 :: Title 1 :: Block name (menu, recommendations, popular, new) :: Home / Section name
- Article 2 :: Title 2 :: Block name (menu, recommendations, popular, new) :: Main page / Section title
etc.
By the way, the presence of such markup will make sure that the testing is correct - the total number of impressions for each of the headings should be approximately the same. Significant differences in impression values for different headers may indicate an improperly configured test.
In the final report, it will be possible to compare the CTR of the headlines for different articles and see in which blocks which headings worked better.
TL; DR or Summary
Rambler / Top-100 offers a simple tool for analyzing the clickability of interface elements - the Block Analytics report. By adding an additional module call to the code of the Top-100 counter initialization and marking the necessary site elements, you can collect statistics and solve the following tasks:
- evaluate the clickability of target blocks of pages or buttons and compare their CTR;
- analyze the effectiveness of different material headers;
- to study the CTR of the block of recommendations and specific positions in it;
- investigate how identical blocks work on different pages, how time clickability changes;
- compare the clickability of the same type of elements with A / B or multivariate testing.
More information on markup can be found in the documentation for working with the Top 100 JavaScript counter or in the documentation for working with the data transfer protocol directly to the counter. If you have any questions, please contact us .
Source: https://habr.com/ru/post/336886/
All Articles