Optimize the launch time of iOS applications
“In the maps we have such a scenario: on the go, get the phone, launch the application, quickly determine where I am, navigate the compass, where to go, and remove the phone.
There are many similar scenarios when an application is opened for a short time. Therefore, it is very important for us that the application runs quickly. We recently did a lot of work on optimizing launch times. I want to share this experience with you now. ”
')
The basis of this material was the presentation of Nikolai Lihogrud, the head of mobile development of Yandex.Maps for iOS, at the Mobius 2017 conference.
likhogrud has already written a post on this topic on the Yandex blog, but we could not help but release one of the best conference reports. Here there is a video, text under the cut, and the presentation, see how you prefer.
Steve Jobs said that the most valuable human resource is his time. You may have heard the story of how Steve made the launch of the Macintosh operating system speed up by half a minute, arguing that speeding up by just 10 seconds would save 300 million user hours per year. Steve considered running an application a very important aspect of performance.
It is obvious that from two applications with the same set of functions, the user will select the one that quickly starts. If there is no alternative, and the application runs for a long time, the user will be annoyed, he will rarely return to your application, write bad reviews. And vice versa, if the application starts quickly, then everything will be great.
Do not forget about the launch time limit of 20 seconds, beyond which the system interrupts the loading of your application. On weak devices, it is enough to really exceed these 20 seconds.
Why is it that the optimization of launch time is most actively spoken over the past six months or a year, and in parallel with the time when we were engaged in optimizing the launch time of our application, several teams did the same in their projects? More and more frameworks that we love and use are being rewritten to Swift. And Swift cannot be compiled into a static library. Therefore, the number of dynamic libraries in our application is growing, as well as time.
Everything is so bad that Apple devoted a launch time to a separate article on the last WWDC ( WWDC 2016: Optimizing App Startup Time ), where it revealed the details of how the dynamic downloads work.
Chika told how it can be profiled and what can be done with the launch time.
What we need to know to effectively run our startup optimization
go application?
To begin with, there is a start time and how to measure it. Startup time is the time from the user clicking on the application icon to the moment when the application is ready for use.
In the simplest case, we can assume that the application is ready for use upon completion of the DidFinishLaunching function, that is, when the main interface of the application is loaded. However, if your application needs to go somewhere at the start for the data, interact with the databases, update the UI, this also has to be taken into account. Therefore, what is considered the end of the launch - a personal matter of each developer.
We decided on the fact that there is a launch time, we begin to measure it. We find that time is very jumps. In the case of Yandex.Map it jumps twice.
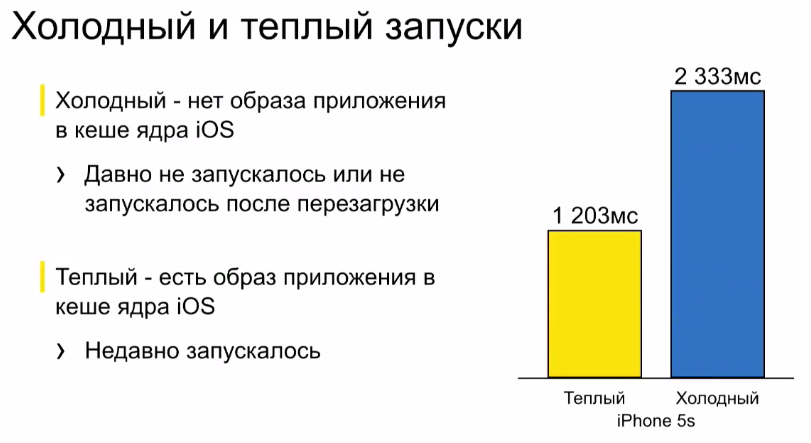
Here you need to introduce the concept of cold and warm start. Cold start is when the application has long since completed its work and has been removed from the operating system cache. A cold start always occurs after restarting the application and, in principle, WWDC recommends that it be modeled in its tests. Warm start is when the application has been completed recently.
Where does this difference come from?
The launch consists of two major steps:
When preparing an application image, the system should:
In the case of a cold start, this pre-main can be an order of magnitude longer than in the case of a warm start.

And just due to this, we have such a big difference between a cold and a warm start.
Especially greatly increases the load time of dynamic libraries in the case of Swift-a. Therefore, today we will spend a lot of time optimizing this stage.
Thus, when you measure the launch of your application, you must take into account not only the segment where your code works, but also pre-main, when the system builds the web application, and also consider the cold start.
Measuring pre-main is not a trivial task, since our code does not work there. Fortunately, in the latest iOS (9 and 10), Apple added the DYLD_PRINT_STATISTICS environment variable, which, when turned on, displays the statistics of the bootloader operation on the console.


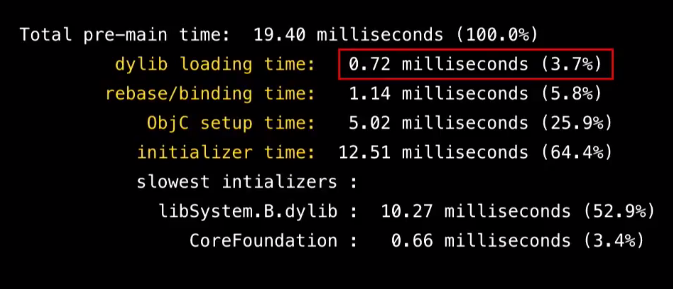
The total time is displayed pre-main and then step by step:
We have a handy tool for measuring pre-main, now we need to measure after-main correctly.
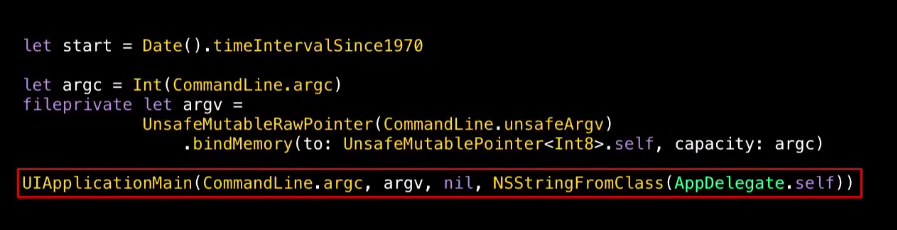
A common mistake is to measure only didFinishLaunching. But before didFinishLaunching, the initialization of UIApplication, UIApplicationDelegate takes place, you can have complex constructors there, and this should also be taken into account. Therefore, time must be measured from the beginning of main.
If you don’t have a main.swift file in your project, you’ll have to add it and put a start-up meter on the first line, and then explicitly call UIApplicationMain.
So, we learned how to measure the full time correctly. However, even in the same situation, the launch time can jump much, and you can’t manage it at all, because the device can do something in the background. Horse racing can reach 20%.

In the case when we are trying to improve our application on a pretty penny, this is unacceptable. You have to do a lot of starts to get rid of the noise. I would like to automate all this, because it is expensive to do manually, especially if you have many devices.
Fortunately, the libimobiledevice utility solves this problem. It communicates with the device directly through the same protocols as xcode and iTunes, and it does not require a jailbreak. The utility allows you to do everything we need.
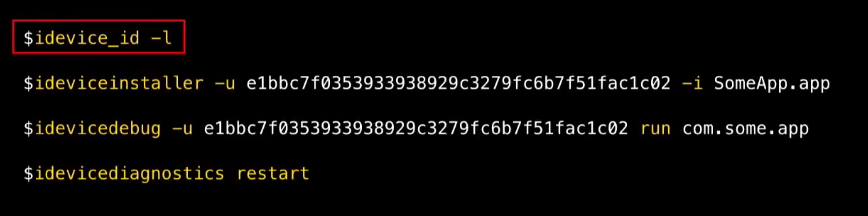
First, it allows you to get a list of connected devices and their UID. Secondly, install the application on a specific device, start the application and reboot the device. It is important for us to measure the cold start.
Most importantly, in the launch of the application, you can pass an environment variable (we need to pass the variable DYLD_PRINT_STATISTICS to measure pre-main).

We will analyze how to use all this. Need to prepare an assembly for the tests. This should be a release configuration with optimizations enabled so that:
And you need to do an automatic termination of the application after it is loaded, if DYLD_PRINT_STATISTICS is specified in the environment variables.

Further we write a script that is on each iteration:
It seems that all is well. But we are faced with the fact that rebooting the phone is very long.

And after that, the launch time jumps very strongly, because for a long time after loading the phone does something in the background (time jumps very strongly - up to 40%). This is unacceptable.
Fortunately, the picture, approximately similar to cold start, turns out, if we do not reboot the device, but simply reinstall the application. This is logical, because when you reinstall the application must be removed from the cache.
After reinstallation, we get clearly not a warm start. At the same time, the start time after the reboot and the start time after the reinstallation is connected, and if you decrease one, the other decreases simultaneously. And reinstallation is much faster, and there is not so much variation in values.
Therefore, we will change the script a bit:
Having such a script, we can collect launch statistics on different devices, taking into account the pre-main, as well as cold and warm start, and further push away from this statistics.

You may think that you can immediately proceed to optimization. But actually not. First you should see what we need to strive for.
And we need to strive for the launch time of an empty project, since our application cannot start faster than an empty project.
And here we come across an unpleasant Swift surprise. Take a simple application on Objective-C, measure it pre-main (say, on the iPhone 5S).
His dynamic library load time will be less than a millisecond. We make the same application on Swift, run on the same device:
Loading dynamic libraries - 200 milliseconds - 2 orders of magnitude more. If we run the application on the iPhone 5, then the loading of dynamic libraries takes almost 800 milliseconds.
We need to understand, because of what. To do this, turn on the Dynamic Library Loads checkbox so that the loadable dynamic libraries are displayed:
And look at the log:
We compare the logs of projects on Objective-C and Swift. We see that in both cases, 146 dynamic libraries are loaded, which are system libraries, and a binary application. But Swift additionally loads nine more suspicious libraries from the application bundle - from the Frameworks folder, called libswift ***. Dylib. These are the so-called swift standard libraries.
If you have ever looked at the compilation log of your application, one of the last steps is the coping swift standard libraries. Where do they come from?
The fact is that swift is developing very quickly, and its developers do not bother with respecting the reverse binary compatibility. Therefore, if you assemble any module on swift 3.0, then even on swift 3.01 you can no longer use it. The compiler will write that this can not be done. Swift cannot yet be part of iOS, because otherwise the new swift will not start on old iOS. Therefore, applications always drag Swift runtime — the swift support libraries, unlike Objective-C, which has long been part of the system.
Therefore, we get the following conclusions:
Now it's time to move on to hardcore optimization.
What is theoretically possible to influence? What does WWDC recommend in its presentation? First, recall the steps:
Apple recommends:
We have an application on swift. It is big. There is already little Objective-C in it - only where you need to interact with the system, with the SDK. In the last swift + load is already prohibited. There are no global C ++ variables. Therefore, of these recommendations, unfortunately, the majority is no longer relevant. It remains only to deal with dynamic libraries and try to somehow reduce the size of the binary file loaded at the start, that is, take out symbols into dynamic libraries and load them lazily. This will inevitably reduce our startup time (reduced rebase / binding, objc-setup).
Let's try to optimize the test application.
Suppose our test application contains many pods written in swift, and somewhere inside it uses Yandex MapKit and YandexSpeechKit, which are static libraries, and also MapKit from the iOS SDK (why this assumption will become clear later).
Measure the start time.
It is three times higher than that of an empty application. Mainly due to dynamic libraries, i.e. for an empty application, they are loaded for 200 milliseconds, and for our test one - for 600 milliseconds. Why is this happening?
Let's start with the simplest: how to remove the download of extra dynamic libraries that come from podov? For this, we can use the plugin for cocoa pods, which is called cocoapods-amimono. It patches the scripts and xcconfigs that are generated by the sweeps, so that after compiling the Podovka libraries, the remaining object files will immediately link to the binary file of the application, and thus get rid of the need for linking with dynamic libraries. Absolutely wonderful solution. And it works great. How to use it?
In the Podfile add the use of the plugin and post-install.

If you are lucky, everything compiles immediately. If not - will have to tinker. But in the end, our launch time is almost halved: the load time of dynamic libraries drops from 600 seconds to 320.

This is precisely due to the fact that all the dynamic libraries from the pods have disappeared.
Unfortunately, we ran into a few shortcomings of this decision, due to the fact that it does not have a large community (people made it almost by themselves):
With all this you can live. I tried the tool for three rather big applications, and each time it took me about an hour and a half to fix the link. But in the end everything works well.
So, we now have the load time of dynamic libraries - 320 milliseconds. It is still one and a half times larger than the empty project. Why it happens?
Let's see what we have left in the Frameworks folder in the bundle. There added 5 new dynamic libraries:

They are called: libswiftAVFoundation.dylib, libswiftCoreAudio.dylib, libswiftCoreLocation.dylib, libswiftCoreMedia.dylib and libswiftMapKit.dylib. Where did they come from?
If you import import CoreLocation somewhere in the swift code, or import <CoreLocation / CoreLocation.h> in the bridging header, the system automatically adds the libswiftCoreLocation.dylib library to your application bundle. Accordingly, the load time increases. Unfortunately, I did not find any other solution, except how not to use CoreLocation for swift.

Therefore, we take and wrap it in Objective-C.
To simplify refactoring, we can take only that part of CoreLocation, which we use, and write the exact same wrapper, but with a different prefix - instead of CoreLocation use, for example, CLWLocationManager (implying core location wrapped), CLWLocation, CLWHeading, etc. Then only these wrappers can be used in swift - and the library, it would seem, is not added.
I did it, but immediately "did not take off."
It turned out that CoreLocation can import dependencies in header files that are added to the bridging header. They also have to be wrapped in Objective C, or somehow bridging the header of the refactor. CoreLocation can also be imported as a dependency of other SDK libraries, for example, MapKit. It turns out that MapKit drags two libraries at once: libswiftCoreLocation.dylib and libswiftMapKit.dylib, and AVFoundation generally has three at once.
That is, if you write import AVFoundation and import MapKit somewhere in a swift file, the load time of the dynamic libraries will immediately increase 1.5 times, even if you have not used this API. Therefore, we write wrappers, and then we return to the load time of the dynamic libraries of the empty project.
There is nowhere else to strive for - we got 10 milliseconds. It remains to suffer a little to reduce the remaining stages.
As I said, Apple's recommendations on optimizing a separate stage are no longer appropriate, because we are all on swift and do not have Objective C or C ++.
Here we have to be guided by the banal idea that at the start only those characters that are necessary to display the start screen should be loaded. Ideally, in general, our application binary should consist only of those symbols that are needed at the start. All the rest would be great to ship lazily. How to do this in our test application?
Earlier, I said that Yandex MapKit, YandexSpeechkit is used inside the application. It would be great to make these static libraries dynamic and load them lazily through a dlopen. This will inevitably reduce the time for rebase / bind, obj startup and initialization, because fewer Objective-C characters will load at the start. How to do it in a convenient way?
For a start we will convert them to dynamic libraries. To do this, for each static library, we create a separate Cocoa Touch Framework target in our application, and in the Podfile we add the required one to the created target. It remains only to correct the linking (if it is written well under the spec, it will immediately link up with you, and if it is written poorly under the spec, you will have to correct the linking).
Basically, we are respectively:
The latter, in fact, is the most difficult moment. Although not so difficult, how frightening, because here you have to use the dlof dlfcn API.
I used to be very afraid of this API. It seemed to me that everything was scary and complicated there. But in fact, everything is not very bad.
For starters, you can load the dynamic library via dlopen. The first parameter takes just the path to the library (the library is in the frameworks folder of our bundle). dlopen returns a handle that will be used later in the dlsym function that loads individual characters.
Now, if we need a function symbol, we use dlsym and pass in the function name (which was in the source library). dlsym will return a pointer to this function.

Further, we can call this function in the usual syntax on a pointer. From a global variable in the same way - we load by its name through dlsym, the address of this global variable is returned. Then you only need to dereference it. Everything is not as difficult as it seemed initially.
Classes are a little more difficult, but you can still live.
First, we can import our former static libraries. This will not load them and will not cause link errors. These are just some declarations to the compiler, and as long as we do not use them directly, linking errors do not occur. However, this h-nickname is worth importing.
Next, we suppose we need some kind of class. The name of his character will consist of the name of the class plus the OBJC_CLASS_ $ prefix. dlsym will return us a class as an instance of the entire metaclass. Further for this metaclass instance we can call alloc. This will return an object of type ID. And then the magic of Objective-C begins, because here we can call a selector on any object of type ID, which the compiler knows about. And our selectors are declared just in the library's imported h-nickname. Then we can map to the desired object and use the API from our library. Those. the only problem is that you need to load the class symbol, and then use it as usual.
What does this give us?
In fact, in our test project, this does not give very much - just 30 milliseconds.

But, nevertheless, such a source of optimization must be considered. Maybe you have somewhere using a large static library, which is not needed at the start, and its symbols are loaded at the start anyway - it depends on the application.
Naturally, through dlopen you can download not only any dependencies, but also break your code into modules and load them lazily. In other words, we strive to ensure that the binary file of the application is as small as possible. This, of course, requires strong refactoring. But what I wrote can be done fairly quickly.
Here is a summary of how we optimized the launch of the application three times through three stages.

If you have a project on Objective-C, then the first two stages you most likely will not be needed, because you already have no dynamic libraries. But over dlopen-th you should think.
How can dlopen automate and not write with your hands? You can see the Facebook SDK. There it is made through a macro system.
Using each class symbol you need to wrap up in loading a dynamic library (if it has not yet been loaded) and loading a symbol (if it has not yet been loaded). Yes, bulky constructions are obtained, but you can do all this through macros, so that the code for loading a symbol collapses into one line of macro usage.
It remains to talk a bit about after-main. It is a little bit - because in fact this is the usual task of optimizing an iOS application, about which much has already been written. And basically it depends on the application itself. You can not think of some kind of super-general scheme, which is suitable for any application.

But, nevertheless, I will talk about what we encountered in the Maps and what worked.
I recommend to look at three things that are in your application:
What will it look like in the case of Maps?
We had a RootViewController class in Maps, which, following the standard approach to dependency injection, accepted dependencies through its constructor.

That is, to create a RouteController, you must first create a Facade lookup and a Facade routing. The user has not yet pressed the search and routing button, however these facades have already been created.
Moreover, if we investigate further the injection of dependencies, then all dependencies on these two facades will also be created. And as a result, at the start, in general, all the dependencies of the application were created. This is not great, because, firstly, additional processor time is wasted, and secondly, this complicates profiling very much, because the profiler is clogged with an incredible number of calls, and it is already very difficult to figure it out.
Instead, we switched to injecting container dependencies that implement lazy dependency creation. That is, we now:
What it looks like:
Create a protocol RootViewControllerDeps, which declares that its implementation should give SearchFacade and RoutingFacade. RootViewController now accepts some implementation of this protocol.
In the implementation of this protocol, we use lazy var:

Now searchFacade and routingFacade will be created only when they are needed by RootViewController, i.e. only when the user clicks Search. And all this does not prevent us from making the classic Composition Root - some class that implements all the dependencies of the application.

It will implement all the protocols of top-level entities and transfer itself as a dependency container.
What did it give us?
Now you need to try to reduce the tree view so that the system does not waste time rendering it. There are several aspects to this:
We use NavigationController. Our map is in NavigationController, because the menu cards and everything else comes through Push.
At the same time, NavigationBar is initially hidden from NavigationController - we do not need it at the start. And it turns out that creating a NavigationController does not affect the starting UI. So why do we need to create it then?

Let's create it lazily. When we need to push something, the NavigationController will be created, and the content, in our case, the map, will be transferred to this NavigationController from the place where it lies now. And then we get that at the start we will have created only content, not NavigationController.
In addition, we still have SplitViewController (for iPad), which is not needed on the iPhone at all. Yes, and on the iPad it is needed only when you want to show the side socket. Therefore, look at your applications, analyze. Perhaps you also have something similar.
As a result of our torment, we have come to optimizing the View tree several times. Now we create only those containers, view controllers, buttons, views, etc., which are needed at the start.

In principle, on this picture you can think a lot. For example, pay attention to the design, which sticks out on the left over the entire content, but does not get on the screen. This is the good old Navigation Bar, which is hidden. But he created. And we used two custom fonts in the Navigation Bar, respectively, these two shifters are loaded at the start, although nothing is visible. Now it is not created here.
The view bundles on the left are onscreen buttons. We used to create a label for each button, Image, background. Now only the content is created. All the rest - SplitViewController was somewhere else, somewhere just containers. All this we have cleaned, leaving only what is needed at the start.
As other UI optimizations, we can remind you that:
The list can be continued for a long time, it all depends on your application and experience.
There remains the last of what can be said in the context of the optimization of after-main.
Open the profiler. Now only those calls remain in the profiler, only the work that is needed at the start. Most likely, this creation of UI, initialization, for example, analytics libraries, opening databases and everything else. Think about whether all this work you need at the time of generation of the initial interface? Perhaps something you can postpone for 200-300 milliseconds, thus showing the starting UI earlier, and doing the work itself a little later (and the user will not get much worse).
We found such work in the maps:
This list will be in each application. Look at your application, analyze. Perhaps something you can postpone.
For a month and a half (or how long it will take you) you got some results - you optimized the launch. I would like this result not to deteriorate in the next update.
If you have any elements of continuous integration, then God himself told you to add there measurements of launches and collection of statistics. Those.after each build, run measurements on some test device, collect statistics, send these statistics, provide access to it. I will not dwell on this now, because everything is well described in the report mail.ru, which was published on Habré. I will simply supplement this report with a few tips.
First, if you have a Composition Root, let's build the dependency creation log.
We make a generic function that accepts a generic block and returns an instance of some type. In this function, we call this block and log some actions - in general, we decorate the creation of dependencies. Such a function fits into our approach fairly fairly with composition root, which implements a lazy dependency creation, because we only need to add a call to this function in the block that is called when creating the next dependency (and this is a generic, so you don’t need to bother with typing).

Thus, we can wrap all the creation of dependencies in this trackCreation and decorate their creation. In our case, you need to at least collect the log.
Why do this?Then, when refactoring, you can hurt something, and you will create a dependency, which should not actually be created.
Beach swift - these are dynamic libraries. So let's ensure that we do not have new dynamic libraries. We can use the Objective-C runtime to get the list of currently loaded libraries.
The objc_copyImageNames function returns a pointer to an array containing the paths to all loaded frameworks. There are a lot of things there, but the main thing is that you can filter out those libraries that are in the bundle of our application, since they affect the launch. You can make sure that nothing new appears there. And if it appeared, then immediately try to figure out why it happened. Something may appear there, for example, because of an iOS update: they added a new wrapper over some standard library, or some new one was updated, pulled another dependency that is written in swift, or some class in Objective- C rewritten. In general, there are a lot of options. It is necessary to ensure that new dynamic libraries do not appear.
But this is generally hardcore:
There is such a function - sysctl. It interacts directly with the operating system kernel and allows you to pull information about the current process out of it. In the structure that it returns, there is a timestamp of the beginning of this process, and, we checked, through this function it is really possible to get the full load time of the application, starting from the user clicking on the button, i.e. counting pre-main.
Why didn’t I talk about it earlier when I talked about launch measurements? Because in fact, DYLD_PRINT_STATISTICS is enough for launch measurements during optimization. And this thing is needed to measure the time of user launches, because there you can not transfer DYLD_PRINT_STATISTICS. And it would be very nice to measure user launches and send them to analytics systems and check again that after each update you didn’t have a full launch time. Here you need to use sysctl to get the beginning of the process, and gettimeofday to take some point, for example, start main. And from each other deduct them.
It remains to talk about what we have achieved in the maps.

We were able to speed up the cold start by 30%.
We worked on all the parts. The loading of dynamic libraries was optimized using Objective-C wrappers for AVFoundation, MapKit and CoreLocation (it dropped one and a half times, as for the test application). We didn’t initially have swift libraries in the subfields, so in principle, the application did not load for S5 in just as long - just 2.3 seconds. It can be worse, especially in applications where there are many swift pods. But still, we did better - dynamic libraries load 1.5 times faster. Obj setup, rebase / bind and initialization, we did a little bit less by lazy loading SpeechKit. Here you can continue on - some of your own pieces of the application is lazily loading.
The green and lilac blocks are after-main, we just have it divided into two segments: from the beginning of main to didFinishLaunching and didFinishLaunching itself. From the beginning of main and to didFinishLaunching, we have several times improved time due to the fact that no extra dependencies are created at the start, and didFinishLaunching we have improved by 40-50% just due to the optimization of the view-tree and putting off unnecessary work at the start for 200-300 milliseconds.
Thanks to Apple for having the same picture on other devices!
There is no such thing that we optimized on one device, and on the other it all did not work. All devices work approximately equally, and the ratio between the different stages of launching them is approximately the same. And while we on the iPhone 5S optimized the launch by 30%, on the iPhone 7, 6S and 5, we received a similar acceleration.
If we talk about a warm start, then it is even better.
Because in a warm start, as we remember, our pre-main has practically no effect on anything. But after-main is, in fact, what a warm start consists of. And in our case, since we didFinishLaunching optimized not by 30%, but by 40%, it turned out that the launch time improved by 37%. The same on other devices.
The picture for 5S is repeated for other devices. And for new devices like the iPhone 6S and 7, the warm launch accelerated 2 times.
And despite the fact that all these values are not so big when you actually use the application, this is noticeable. Our users have responded to this. There are good reviews in the AppStore.
In conclusion, let's go over what we talked about today. Startup optimization is an iterative process.
At each iteration, you are trying to do something; you are putting forward and implementing some of your provisions. After the iteration, cycle the measurements on different or even on one device (what works on one iPhone will work on another iPhone). Then again, trying to improve something.
The optimization itself consists of working on two segments: pre-main and after-main. And they are optimized completely independently of each other, because with pre-main, only the system works for us - DYLD (dynamic loader), and after-main is our code.
When optimizing pre-main, we try, first, to reduce the number of dynamic libraries through the use of a plugin for cocoapods and through writing wrappers for extra swift standard libraries. And secondly, we are trying to reduce the size of the binary file.
When optimizing after-main, we are guided by a profiler, etc., trying to do as little work as possible at the start. We try not to create unnecessary entities (we create only the amount of UI that is needed to display the starting interface), and we are trying to postpone the work that is not necessary to be shown.
That's all the secrets.
If you like mobile development as well as we, we recommend to pay attention to the following reports at the upcoming conference Mobius 2017 Moscow :
There are many similar scenarios when an application is opened for a short time. Therefore, it is very important for us that the application runs quickly. We recently did a lot of work on optimizing launch times. I want to share this experience with you now. ”
')
The basis of this material was the presentation of Nikolai Lihogrud, the head of mobile development of Yandex.Maps for iOS, at the Mobius 2017 conference.
likhogrud has already written a post on this topic on the Yandex blog, but we could not help but release one of the best conference reports. Here there is a video, text under the cut, and the presentation, see how you prefer.
Why reduce startup time?
Steve Jobs said that the most valuable human resource is his time. You may have heard the story of how Steve made the launch of the Macintosh operating system speed up by half a minute, arguing that speeding up by just 10 seconds would save 300 million user hours per year. Steve considered running an application a very important aspect of performance.
It is obvious that from two applications with the same set of functions, the user will select the one that quickly starts. If there is no alternative, and the application runs for a long time, the user will be annoyed, he will rarely return to your application, write bad reviews. And vice versa, if the application starts quickly, then everything will be great.
Do not forget about the launch time limit of 20 seconds, beyond which the system interrupts the loading of your application. On weak devices, it is enough to really exceed these 20 seconds.
Why is it that the optimization of launch time is most actively spoken over the past six months or a year, and in parallel with the time when we were engaged in optimizing the launch time of our application, several teams did the same in their projects? More and more frameworks that we love and use are being rewritten to Swift. And Swift cannot be compiled into a static library. Therefore, the number of dynamic libraries in our application is growing, as well as time.
Everything is so bad that Apple devoted a launch time to a separate article on the last WWDC ( WWDC 2016: Optimizing App Startup Time ), where it revealed the details of how the dynamic downloads work.
Chika told how it can be profiled and what can be done with the launch time.
What we need to know to effectively run our startup optimization
go application?
- That there is a start time, and it needs to be measured;
- How to optimize the application loading stage that occurs before the Main function is called, that is, before our code starts to run;
- How to activate the start time after this point;
- How not to spoil the result with subsequent updates.
Start time measurements
To begin with, there is a start time and how to measure it. Startup time is the time from the user clicking on the application icon to the moment when the application is ready for use.
In the simplest case, we can assume that the application is ready for use upon completion of the DidFinishLaunching function, that is, when the main interface of the application is loaded. However, if your application needs to go somewhere at the start for the data, interact with the databases, update the UI, this also has to be taken into account. Therefore, what is considered the end of the launch - a personal matter of each developer.
We decided on the fact that there is a launch time, we begin to measure it. We find that time is very jumps. In the case of Yandex.Map it jumps twice.
Here you need to introduce the concept of cold and warm start. Cold start is when the application has long since completed its work and has been removed from the operating system cache. A cold start always occurs after restarting the application and, in principle, WWDC recommends that it be modeled in its tests. Warm start is when the application has been completed recently.
Where does this difference come from?
The launch consists of two major steps:
- preparing an image of the application;
- running our code when the main function starts.
When preparing an application image, the system should:
- load all dynamic libraries, for each dynamic library check its digital signature, display its virtual address space;
- since the library can be located anywhere in memory, you need to correct pointers, substitute addresses of unknown characters in other libraries;
- create an Objective-C context, i.e. register C-classes, selectors, categories, unique selectors, plus other work is done there;
- initialize the classes, execute the + load call and the C ++ global variable constructor.
In the case of a cold start, this pre-main can be an order of magnitude longer than in the case of a warm start.
And just due to this, we have such a big difference between a cold and a warm start.
Especially greatly increases the load time of dynamic libraries in the case of Swift-a. Therefore, today we will spend a lot of time optimizing this stage.
Thus, when you measure the launch of your application, you must take into account not only the segment where your code works, but also pre-main, when the system builds the web application, and also consider the cold start.
Measuring pre-main
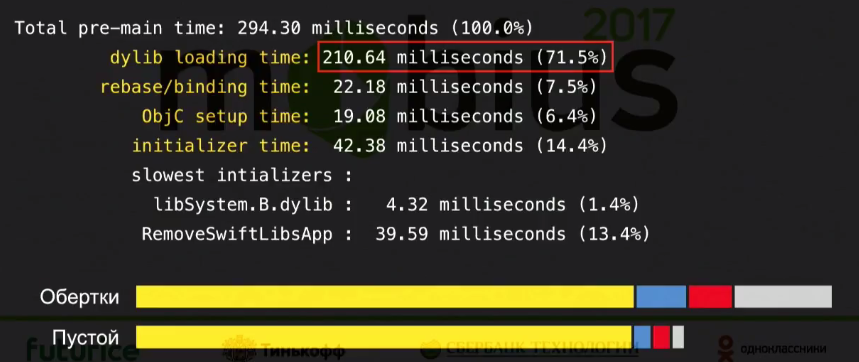
Measuring pre-main is not a trivial task, since our code does not work there. Fortunately, in the latest iOS (9 and 10), Apple added the DYLD_PRINT_STATISTICS environment variable, which, when turned on, displays the statistics of the bootloader operation on the console.
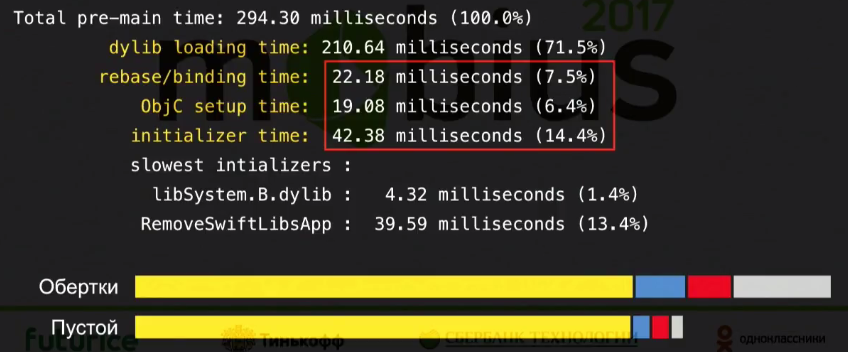
The total time is displayed pre-main and then step by step:
- load time of dynamic libraries;
- rebase / binding time - i.e. edits to pointers and binding;
- creation time of ObjC context;
- initialization time - where + load and global variables.
Measuring after-main
We have a handy tool for measuring pre-main, now we need to measure after-main correctly.
A common mistake is to measure only didFinishLaunching. But before didFinishLaunching, the initialization of UIApplication, UIApplicationDelegate takes place, you can have complex constructors there, and this should also be taken into account. Therefore, time must be measured from the beginning of main.
If you don’t have a main.swift file in your project, you’ll have to add it and put a start-up meter on the first line, and then explicitly call UIApplicationMain.
So, we learned how to measure the full time correctly. However, even in the same situation, the launch time can jump much, and you can’t manage it at all, because the device can do something in the background. Horse racing can reach 20%.
In the case when we are trying to improve our application on a pretty penny, this is unacceptable. You have to do a lot of starts to get rid of the noise. I would like to automate all this, because it is expensive to do manually, especially if you have many devices.
Fortunately, the libimobiledevice utility solves this problem. It communicates with the device directly through the same protocols as xcode and iTunes, and it does not require a jailbreak. The utility allows you to do everything we need.
First, it allows you to get a list of connected devices and their UID. Secondly, install the application on a specific device, start the application and reboot the device. It is important for us to measure the cold start.
Most importantly, in the launch of the application, you can pass an environment variable (we need to pass the variable DYLD_PRINT_STATISTICS to measure pre-main).
Build for tests
We will analyze how to use all this. Need to prepare an assembly for the tests. This should be a release configuration with optimizations enabled so that:
- asserts are turned off,
- included optimizations (otherwise the library libswiftSwiftOnoneSupport.dylib will be added, which affects the launch time).
And you need to do an automatic termination of the application after it is loaded, if DYLD_PRINT_STATISTICS is specified in the environment variables.
Further we write a script that is on each iteration:
- reboots the device (indevicediagnostics restart);
- waiting for the download to complete;
- then we start the application (indevicedebug run - this will be a cold start);
- it ends automatically;
- we run again (indevicedebug run - this will be a warm start);
- the script processes the output, saves the logs.
It seems that all is well. But we are faced with the fact that rebooting the phone is very long.
And after that, the launch time jumps very strongly, because for a long time after loading the phone does something in the background (time jumps very strongly - up to 40%). This is unacceptable.
Fortunately, the picture, approximately similar to cold start, turns out, if we do not reboot the device, but simply reinstall the application. This is logical, because when you reinstall the application must be removed from the cache.
After reinstallation, we get clearly not a warm start. At the same time, the start time after the reboot and the start time after the reinstallation is connected, and if you decrease one, the other decreases simultaneously. And reinstallation is much faster, and there is not so much variation in values.
Therefore, we will change the script a bit:
- the first step is to reinstall the application (indevicinstaller -i);
- then start indevicedebug run (cold);
- another indevicedebug run (warm start);
- and output processing.
Having such a script, we can collect launch statistics on different devices, taking into account the pre-main, as well as cold and warm start, and further push away from this statistics.
Blank swift project
You may think that you can immediately proceed to optimization. But actually not. First you should see what we need to strive for.
And we need to strive for the launch time of an empty project, since our application cannot start faster than an empty project.
And here we come across an unpleasant Swift surprise. Take a simple application on Objective-C, measure it pre-main (say, on the iPhone 5S).
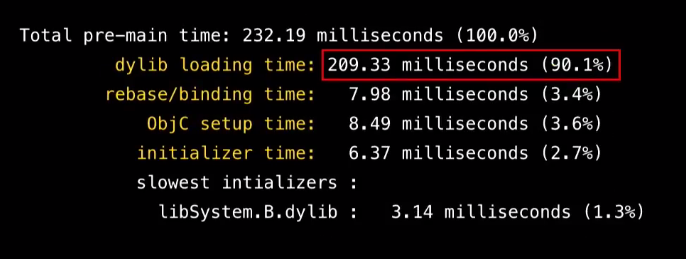
His dynamic library load time will be less than a millisecond. We make the same application on Swift, run on the same device:
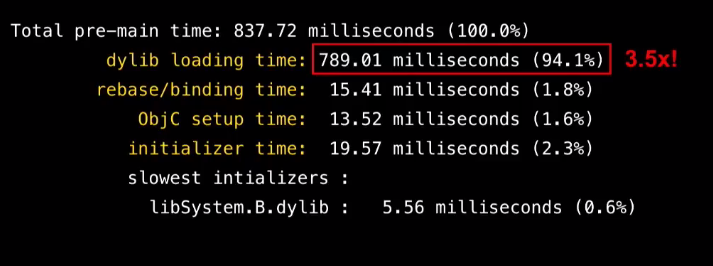
Loading dynamic libraries - 200 milliseconds - 2 orders of magnitude more. If we run the application on the iPhone 5, then the loading of dynamic libraries takes almost 800 milliseconds.
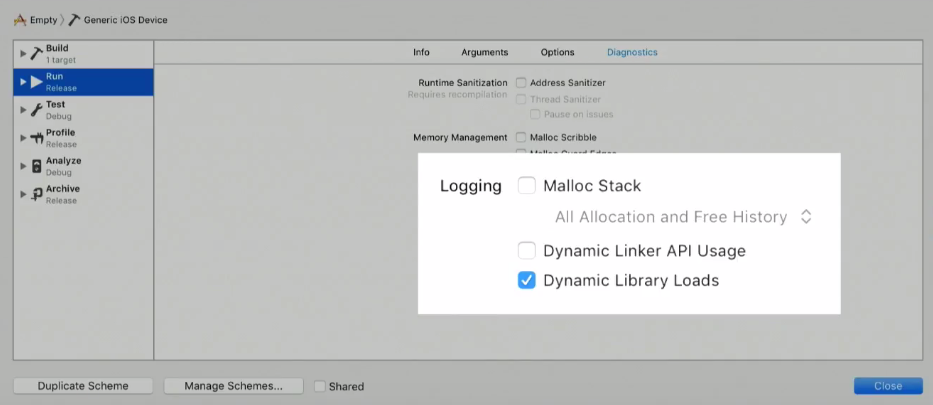
We need to understand, because of what. To do this, turn on the Dynamic Library Loads checkbox so that the loadable dynamic libraries are displayed:
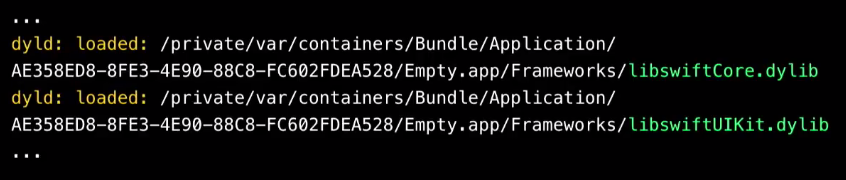
And look at the log:
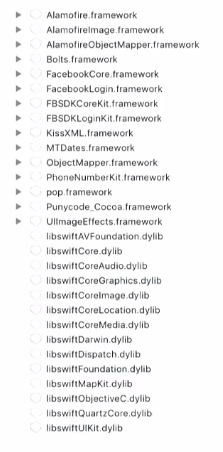
We compare the logs of projects on Objective-C and Swift. We see that in both cases, 146 dynamic libraries are loaded, which are system libraries, and a binary application. But Swift additionally loads nine more suspicious libraries from the application bundle - from the Frameworks folder, called libswift ***. Dylib. These are the so-called swift standard libraries.
If you have ever looked at the compilation log of your application, one of the last steps is the coping swift standard libraries. Where do they come from?
The fact is that swift is developing very quickly, and its developers do not bother with respecting the reverse binary compatibility. Therefore, if you assemble any module on swift 3.0, then even on swift 3.01 you can no longer use it. The compiler will write that this can not be done. Swift cannot yet be part of iOS, because otherwise the new swift will not start on old iOS. Therefore, applications always drag Swift runtime — the swift support libraries, unlike Objective-C, which has long been part of the system.
Therefore, we get the following conclusions:
- no matter what anyone says, the loading of the system libraries is optimized (I myself spent a lot of time trying to make sure of this completely). Even if you have 200 or 300 system libraries loaded, it still does not affect the start time, so do not waste time trying to reduce their number;
- But the libraries from the application bundle load for a long time. Unfortunately, these include the swift standard libraries;
- even an empty application on the iPhone loads a second (with a cold start). Accordingly, your application can not load less than a second;
- someday this problem will disappear. A swift 4 is already being prepared, and the swift standard libraries will simply become part of the system, and applications will no longer carry these libraries with them.
Now it's time to move on to hardcore optimization.
Pre-main optimization
What is theoretically possible to influence? What does WWDC recommend in its presentation? First, recall the steps:
- loading dynamic libraries;
- rebase / binding, i.e. fix pointers;
- objc-setup, i.e. creating Objective-C context;
- initialization, that is, global variables of C ++ and the + load method.
Apple recommends:
- reduce the number of loadable dynamic libraries;
- reduce the use of Objective-C (use more swift), which will reduce the amount of Objective-C metadata created at the start;
- move the code from + load to + initialize so that it is called when the code first accesses the class;
- get rid of static C ++ variables with complex constructors.
We have an application on swift. It is big. There is already little Objective-C in it - only where you need to interact with the system, with the SDK. In the last swift + load is already prohibited. There are no global C ++ variables. Therefore, of these recommendations, unfortunately, the majority is no longer relevant. It remains only to deal with dynamic libraries and try to somehow reduce the size of the binary file loaded at the start, that is, take out symbols into dynamic libraries and load them lazily. This will inevitably reduce our startup time (reduced rebase / binding, objc-setup).
Dynamic Library Optimization
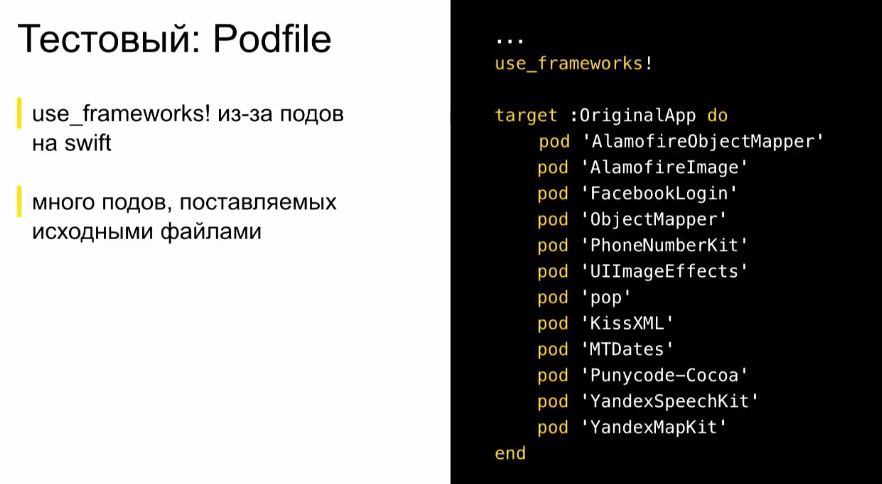
Let's try to optimize the test application.
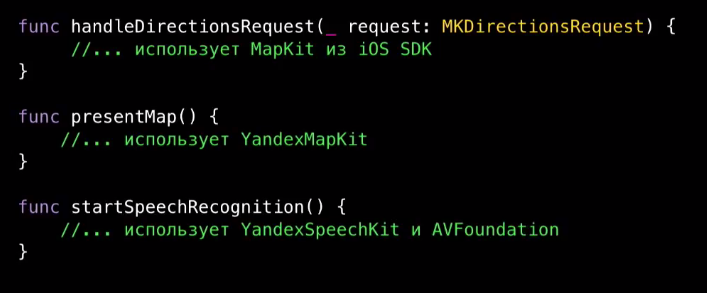
Suppose our test application contains many pods written in swift, and somewhere inside it uses Yandex MapKit and YandexSpeechKit, which are static libraries, and also MapKit from the iOS SDK (why this assumption will become clear later).
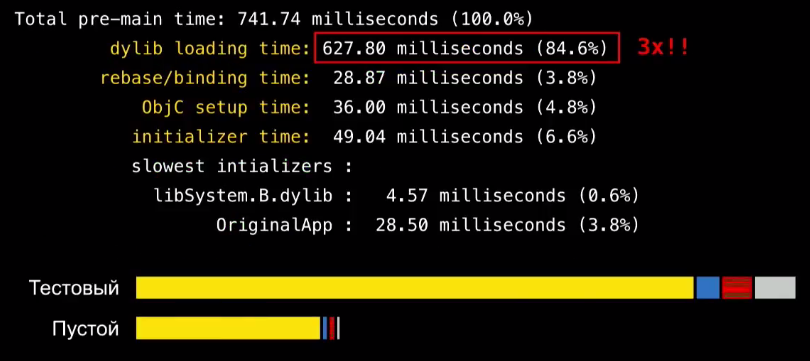
Measure the start time.
It is three times higher than that of an empty application. Mainly due to dynamic libraries, i.e. for an empty application, they are loaded for 200 milliseconds, and for our test one - for 600 milliseconds. Why is this happening?
- added a dynamic library for each hearth compiled from swift;
- there are more swift standard libraries. Initially there are 9 of them, and now there are already 14.
Let's start with the simplest: how to remove the download of extra dynamic libraries that come from podov? For this, we can use the plugin for cocoa pods, which is called cocoapods-amimono. It patches the scripts and xcconfigs that are generated by the sweeps, so that after compiling the Podovka libraries, the remaining object files will immediately link to the binary file of the application, and thus get rid of the need for linking with dynamic libraries. Absolutely wonderful solution. And it works great. How to use it?
In the Podfile add the use of the plugin and post-install.
If you are lucky, everything compiles immediately. If not - will have to tinker. But in the end, our launch time is almost halved: the load time of dynamic libraries drops from 600 seconds to 320.
This is precisely due to the fact that all the dynamic libraries from the pods have disappeared.
Unfortunately, we ran into a few shortcomings of this decision, due to the fact that it does not have a large community (people made it almost by themselves):
- cocoapods-amimono skips the integration of the pods supplied by the frameworks, that is, you need to add these pods yourself to the application and perform the integration;
- there is no control over which pods to hold in a binary file and which ones to leave as is;
- still for some reason the target, whose name contain "test", are omitted.
With all this you can live. I tried the tool for three rather big applications, and each time it took me about an hour and a half to fix the link. But in the end everything works well.
Objective-C wrappers
So, we now have the load time of dynamic libraries - 320 milliseconds. It is still one and a half times larger than the empty project. Why it happens?
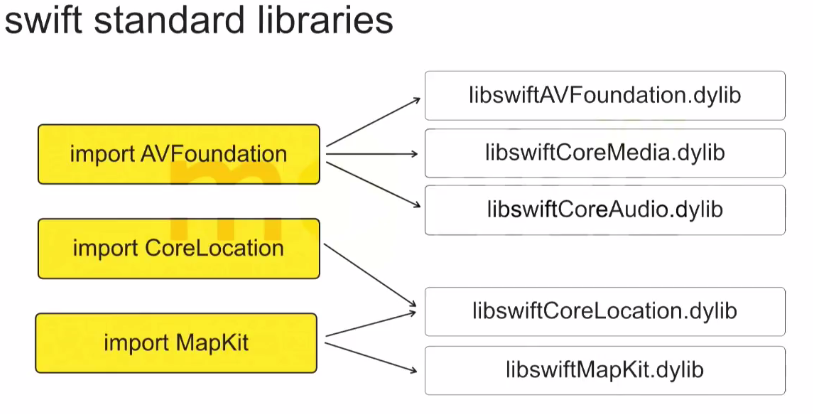
Let's see what we have left in the Frameworks folder in the bundle. There added 5 new dynamic libraries:
They are called: libswiftAVFoundation.dylib, libswiftCoreAudio.dylib, libswiftCoreLocation.dylib, libswiftCoreMedia.dylib and libswiftMapKit.dylib. Where did they come from?
If you import import CoreLocation somewhere in the swift code, or import <CoreLocation / CoreLocation.h> in the bridging header, the system automatically adds the libswiftCoreLocation.dylib library to your application bundle. Accordingly, the load time increases. Unfortunately, I did not find any other solution, except how not to use CoreLocation for swift.
Therefore, we take and wrap it in Objective-C.
To simplify refactoring, we can take only that part of CoreLocation, which we use, and write the exact same wrapper, but with a different prefix - instead of CoreLocation use, for example, CLWLocationManager (implying core location wrapped), CLWLocation, CLWHeading, etc. Then only these wrappers can be used in swift - and the library, it would seem, is not added.
I did it, but immediately "did not take off."
It turned out that CoreLocation can import dependencies in header files that are added to the bridging header. They also have to be wrapped in Objective C, or somehow bridging the header of the refactor. CoreLocation can also be imported as a dependency of other SDK libraries, for example, MapKit. It turns out that MapKit drags two libraries at once: libswiftCoreLocation.dylib and libswiftMapKit.dylib, and AVFoundation generally has three at once.
That is, if you write import AVFoundation and import MapKit somewhere in a swift file, the load time of the dynamic libraries will immediately increase 1.5 times, even if you have not used this API. Therefore, we write wrappers, and then we return to the load time of the dynamic libraries of the empty project.
There is nowhere else to strive for - we got 10 milliseconds. It remains to suffer a little to reduce the remaining stages.
Download via dlopen
As I said, Apple's recommendations on optimizing a separate stage are no longer appropriate, because we are all on swift and do not have Objective C or C ++.
Here we have to be guided by the banal idea that at the start only those characters that are necessary to display the start screen should be loaded. Ideally, in general, our application binary should consist only of those symbols that are needed at the start. All the rest would be great to ship lazily. How to do this in our test application?
Earlier, I said that Yandex MapKit, YandexSpeechkit is used inside the application. It would be great to make these static libraries dynamic and load them lazily through a dlopen. This will inevitably reduce the time for rebase / bind, obj startup and initialization, because fewer Objective-C characters will load at the start. How to do it in a convenient way?
For a start we will convert them to dynamic libraries. To do this, for each static library, we create a separate Cocoa Touch Framework target in our application, and in the Podfile we add the required one to the created target. It remains only to correct the linking (if it is written well under the spec, it will immediately link up with you, and if it is written poorly under the spec, you will have to correct the linking).
Basically, we are respectively:
- under the clean;
- the framework that is compiled from the newly created target is added to the embedded binaries so that it goes along with the bundle, but we do not add it to the link;
- we transfer the necessary resources, we rule integration;
- We write Objective-C wrappers for lazy downloads - Objective-C wrappers that implement the same interface, but load the library and characters lazily.
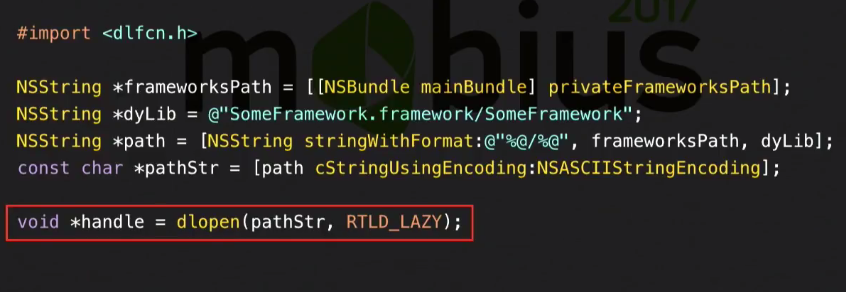
The latter, in fact, is the most difficult moment. Although not so difficult, how frightening, because here you have to use the dlof dlfcn API.
I used to be very afraid of this API. It seemed to me that everything was scary and complicated there. But in fact, everything is not very bad.
For starters, you can load the dynamic library via dlopen. The first parameter takes just the path to the library (the library is in the frameworks folder of our bundle). dlopen returns a handle that will be used later in the dlsym function that loads individual characters.
Now, if we need a function symbol, we use dlsym and pass in the function name (which was in the source library). dlsym will return a pointer to this function.
Further, we can call this function in the usual syntax on a pointer. From a global variable in the same way - we load by its name through dlsym, the address of this global variable is returned. Then you only need to dereference it. Everything is not as difficult as it seemed initially.
Classes are a little more difficult, but you can still live.
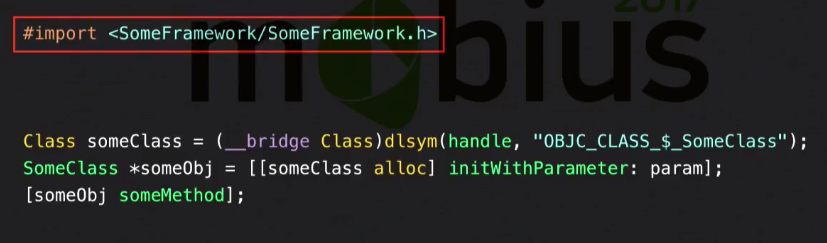
First, we can import our former static libraries. This will not load them and will not cause link errors. These are just some declarations to the compiler, and as long as we do not use them directly, linking errors do not occur. However, this h-nickname is worth importing.
Next, we suppose we need some kind of class. The name of his character will consist of the name of the class plus the OBJC_CLASS_ $ prefix. dlsym will return us a class as an instance of the entire metaclass. Further for this metaclass instance we can call alloc. This will return an object of type ID. And then the magic of Objective-C begins, because here we can call a selector on any object of type ID, which the compiler knows about. And our selectors are declared just in the library's imported h-nickname. Then we can map to the desired object and use the API from our library. Those. the only problem is that you need to load the class symbol, and then use it as usual.
What does this give us?
In fact, in our test project, this does not give very much - just 30 milliseconds.
But, nevertheless, such a source of optimization must be considered. Maybe you have somewhere using a large static library, which is not needed at the start, and its symbols are loaded at the start anyway - it depends on the application.
Naturally, through dlopen you can download not only any dependencies, but also break your code into modules and load them lazily. In other words, we strive to ensure that the binary file of the application is as small as possible. This, of course, requires strong refactoring. But what I wrote can be done fairly quickly.
Here is a summary of how we optimized the launch of the application three times through three stages.
- first got rid of the dynamic libraries of pods;
- then we wrote Objective-C wrappers for system frameworks that add new swift standard libraries;
- and finished off all the fact that we stop loading some of the new symbols at the start - we load them lazily.
If you have a project on Objective-C, then the first two stages you most likely will not be needed, because you already have no dynamic libraries. But over dlopen-th you should think.
How can dlopen automate and not write with your hands? You can see the Facebook SDK. There it is made through a macro system.
Using each class symbol you need to wrap up in loading a dynamic library (if it has not yet been loaded) and loading a symbol (if it has not yet been loaded). Yes, bulky constructions are obtained, but you can do all this through macros, so that the code for loading a symbol collapses into one line of macro usage.
After-main optimization
It remains to talk a bit about after-main. It is a little bit - because in fact this is the usual task of optimizing an iOS application, about which much has already been written. And basically it depends on the application itself. You can not think of some kind of super-general scheme, which is suitable for any application.
But, nevertheless, I will talk about what we encountered in the Maps and what worked.
I recommend to look at three things that are in your application:
- get rid of excessive creation of entities at the start, i.e., create only those dependencies of your application that are needed at the start;
- then, of course, you need to work on optimizing the UI so that only the part of the UI that is needed at the start is loaded;
- see the initialization, for example, of some libraries, databases. If it does not affect the perception of the launch by the user, let's postpone it.
What will it look like in the case of Maps?
Optimize extra dependencies
We had a RootViewController class in Maps, which, following the standard approach to dependency injection, accepted dependencies through its constructor.
That is, to create a RouteController, you must first create a Facade lookup and a Facade routing. The user has not yet pressed the search and routing button, however these facades have already been created.
Moreover, if we investigate further the injection of dependencies, then all dependencies on these two facades will also be created. And as a result, at the start, in general, all the dependencies of the application were created. This is not great, because, firstly, additional processor time is wasted, and secondly, this complicates profiling very much, because the profiler is clogged with an incredible number of calls, and it is already very difficult to figure it out.
Instead, we switched to injecting container dependencies that implement lazy dependency creation. That is, we now:
- entity dependencies are drawn up in the protocol;
- in the constructor, we accept some implementation of this protocol;
- and in the implementation of this protocol, we use lazy var, so that dependencies are created only when addressed.
What it looks like:
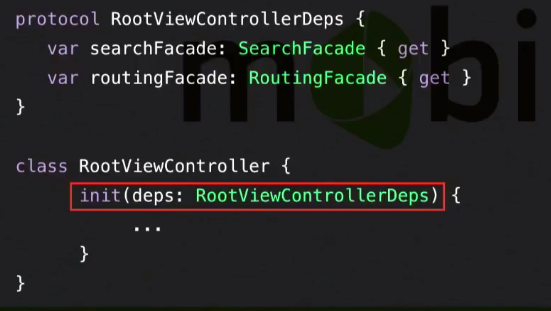
Create a protocol RootViewControllerDeps, which declares that its implementation should give SearchFacade and RoutingFacade. RootViewController now accepts some implementation of this protocol.
In the implementation of this protocol, we use lazy var:
Now searchFacade and routingFacade will be created only when they are needed by RootViewController, i.e. only when the user clicks Search. And all this does not prevent us from making the classic Composition Root - some class that implements all the dependencies of the application.
It will implement all the protocols of top-level entities and transfer itself as a dependency container.
What did it give us?
- At the start, now only necessary dependencies are created. This reduced the launch time and simplified the profiling, because now at the start there are obviously fewer calls, and the profiler can already be figured out somehow.
- As a side effect, we received a healthy injection of addictions that does not use reflection. Now, if in some class some new dependency is needed, we indicate this new dependency in the protocol, and the resolve will not occur at runtime, but at compilation. Those.the compiler will tell us that Composition Root cannot give this dependency. This simplifies refactoring, because now we don’t need to start and wait until something falls somewhere because we didn’t specify any dependency in Composition Root or use the constructor in some way. Therefore, refactoring has become much easier.
UI optimization
Now you need to try to reduce the tree view so that the system does not waste time rendering it. There are several aspects to this:
- new views can come from containers and controllers. It may well be that the container controller is created, its views are created, but it does not affect the UI. Then they do not need to be created at the start;
- no need to create containers in which nothing is put at the start. They occupy additional space in the view-tree and in memory, they have to spend layout work to render;
- No need to create views that do not contain content at the start. For example, labels without text. They need to be created when the necessary content for them appears.
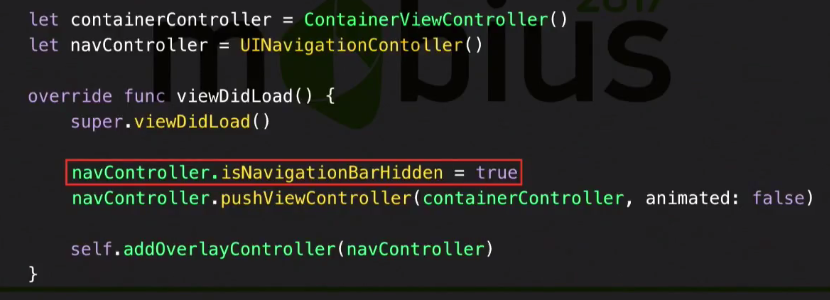
We use NavigationController. Our map is in NavigationController, because the menu cards and everything else comes through Push.
At the same time, NavigationBar is initially hidden from NavigationController - we do not need it at the start. And it turns out that creating a NavigationController does not affect the starting UI. So why do we need to create it then?
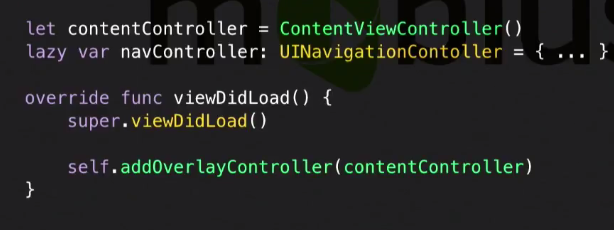
Let's create it lazily. When we need to push something, the NavigationController will be created, and the content, in our case, the map, will be transferred to this NavigationController from the place where it lies now. And then we get that at the start we will have created only content, not NavigationController.
In addition, we still have SplitViewController (for iPad), which is not needed on the iPhone at all. Yes, and on the iPad it is needed only when you want to show the side socket. Therefore, look at your applications, analyze. Perhaps you also have something similar.
As a result of our torment, we have come to optimizing the View tree several times. Now we create only those containers, view controllers, buttons, views, etc., which are needed at the start.
In principle, on this picture you can think a lot. For example, pay attention to the design, which sticks out on the left over the entire content, but does not get on the screen. This is the good old Navigation Bar, which is hidden. But he created. And we used two custom fonts in the Navigation Bar, respectively, these two shifters are loaded at the start, although nothing is visible. Now it is not created here.
The view bundles on the left are onscreen buttons. We used to create a label for each button, Image, background. Now only the content is created. All the rest - SplitViewController was somewhere else, somewhere just containers. All this we have cleaned, leaving only what is needed at the start.
As other UI optimizations, we can remind you that:
- fonts should be loaded lazily, as it takes time;
- if you are at the start of some graphics render in Core Graphics, then it is better for you to render it in advance;
- if you have some kind of font used for the sake of one single label, then this label can also be rendered into a picture;
- Of course, you need to work on autolayout - to optimize it, or to get rid of it.
The list can be continued for a long time, it all depends on your application and experience.
Optional work at the start
There remains the last of what can be said in the context of the optimization of after-main.
Open the profiler. Now only those calls remain in the profiler, only the work that is needed at the start. Most likely, this creation of UI, initialization, for example, analytics libraries, opening databases and everything else. Think about whether all this work you need at the time of generation of the initial interface? Perhaps something you can postpone for 200-300 milliseconds, thus showing the starting UI earlier, and doing the work itself a little later (and the user will not get much worse).
We found such work in the maps:
- we start bookmark synchronization later, because we need it in the internal screens;
- We also display the bookmarks on the map a little later, because, firstly, it requires synchronization, and, secondly, Account Merge there also pulls some work. And if bookmarks appear 200 milliseconds later, no one will notice;
- we also later load the application configuration;
- audio sessions are only configured when they are needed, etc.
This list will be in each application. Look at your application, analyze. Perhaps something you can postpone.
Saving result
For a month and a half (or how long it will take you) you got some results - you optimized the launch. I would like this result not to deteriorate in the next update.
If you have any elements of continuous integration, then God himself told you to add there measurements of launches and collection of statistics. Those.after each build, run measurements on some test device, collect statistics, send these statistics, provide access to it. I will not dwell on this now, because everything is well described in the report mail.ru, which was published on Habré. I will simply supplement this report with a few tips.
First, if you have a Composition Root, let's build the dependency creation log.
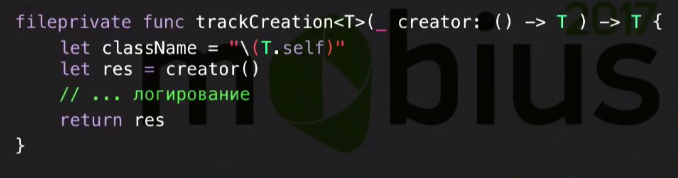
We make a generic function that accepts a generic block and returns an instance of some type. In this function, we call this block and log some actions - in general, we decorate the creation of dependencies. Such a function fits into our approach fairly fairly with composition root, which implements a lazy dependency creation, because we only need to add a call to this function in the block that is called when creating the next dependency (and this is a generic, so you don’t need to bother with typing).
Thus, we can wrap all the creation of dependencies in this trackCreation and decorate their creation. In our case, you need to at least collect the log.
Why do this?Then, when refactoring, you can hurt something, and you will create a dependency, which should not actually be created.
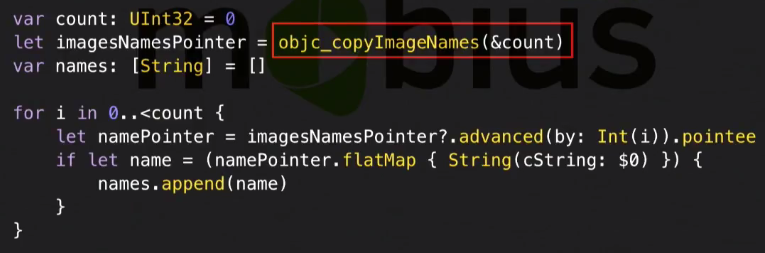
Beach swift - these are dynamic libraries. So let's ensure that we do not have new dynamic libraries. We can use the Objective-C runtime to get the list of currently loaded libraries.
The objc_copyImageNames function returns a pointer to an array containing the paths to all loaded frameworks. There are a lot of things there, but the main thing is that you can filter out those libraries that are in the bundle of our application, since they affect the launch. You can make sure that nothing new appears there. And if it appeared, then immediately try to figure out why it happened. Something may appear there, for example, because of an iOS update: they added a new wrapper over some standard library, or some new one was updated, pulled another dependency that is written in swift, or some class in Objective- C rewritten. In general, there are a lot of options. It is necessary to ensure that new dynamic libraries do not appear.
But this is generally hardcore:
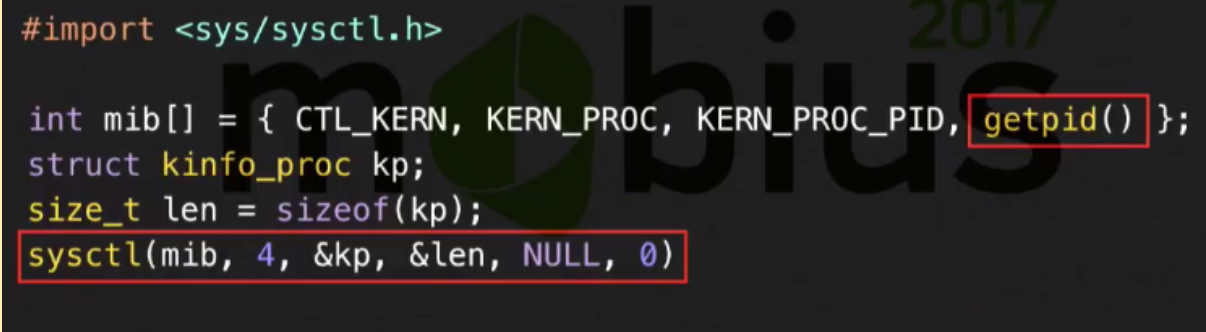
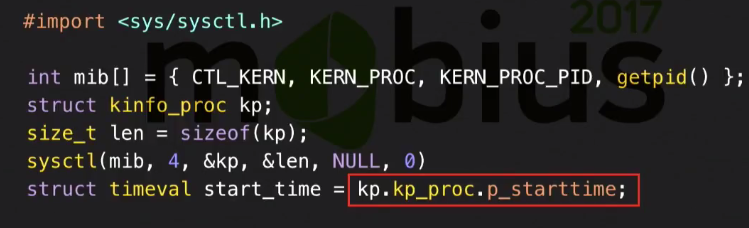
There is such a function - sysctl. It interacts directly with the operating system kernel and allows you to pull information about the current process out of it. In the structure that it returns, there is a timestamp of the beginning of this process, and, we checked, through this function it is really possible to get the full load time of the application, starting from the user clicking on the button, i.e. counting pre-main.
Why didn’t I talk about it earlier when I talked about launch measurements? Because in fact, DYLD_PRINT_STATISTICS is enough for launch measurements during optimization. And this thing is needed to measure the time of user launches, because there you can not transfer DYLD_PRINT_STATISTICS. And it would be very nice to measure user launches and send them to analytics systems and check again that after each update you didn’t have a full launch time. Here you need to use sysctl to get the beginning of the process, and gettimeofday to take some point, for example, start main. And from each other deduct them.
Instead of conclusion
It remains to talk about what we have achieved in the maps.
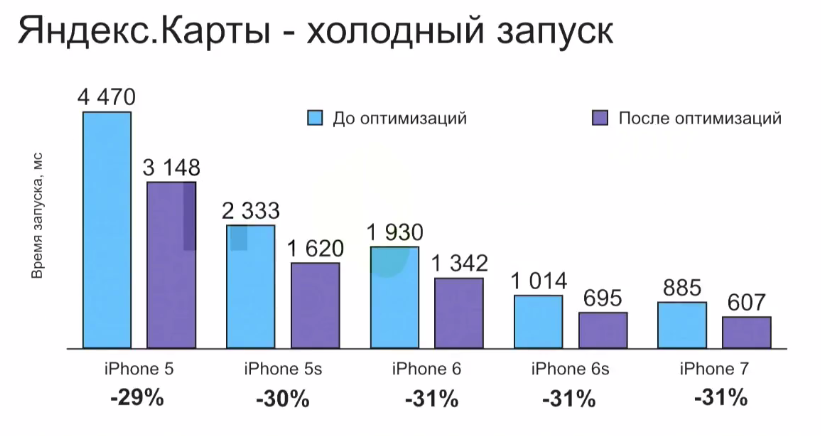
We were able to speed up the cold start by 30%.
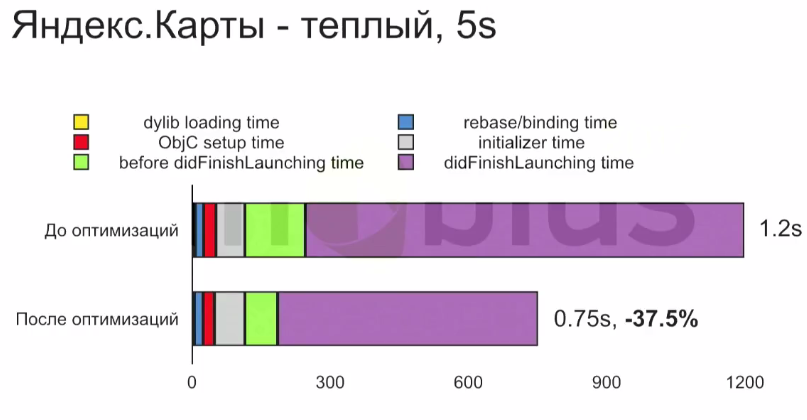
We worked on all the parts. The loading of dynamic libraries was optimized using Objective-C wrappers for AVFoundation, MapKit and CoreLocation (it dropped one and a half times, as for the test application). We didn’t initially have swift libraries in the subfields, so in principle, the application did not load for S5 in just as long - just 2.3 seconds. It can be worse, especially in applications where there are many swift pods. But still, we did better - dynamic libraries load 1.5 times faster. Obj setup, rebase / bind and initialization, we did a little bit less by lazy loading SpeechKit. Here you can continue on - some of your own pieces of the application is lazily loading.
The green and lilac blocks are after-main, we just have it divided into two segments: from the beginning of main to didFinishLaunching and didFinishLaunching itself. From the beginning of main and to didFinishLaunching, we have several times improved time due to the fact that no extra dependencies are created at the start, and didFinishLaunching we have improved by 40-50% just due to the optimization of the view-tree and putting off unnecessary work at the start for 200-300 milliseconds.
Thanks to Apple for having the same picture on other devices!
There is no such thing that we optimized on one device, and on the other it all did not work. All devices work approximately equally, and the ratio between the different stages of launching them is approximately the same. And while we on the iPhone 5S optimized the launch by 30%, on the iPhone 7, 6S and 5, we received a similar acceleration.
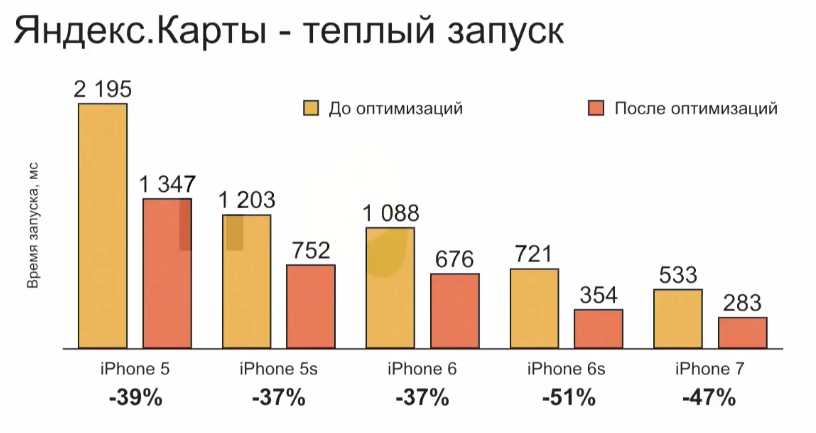
If we talk about a warm start, then it is even better.
Because in a warm start, as we remember, our pre-main has practically no effect on anything. But after-main is, in fact, what a warm start consists of. And in our case, since we didFinishLaunching optimized not by 30%, but by 40%, it turned out that the launch time improved by 37%. The same on other devices.
The picture for 5S is repeated for other devices. And for new devices like the iPhone 6S and 7, the warm launch accelerated 2 times.
And despite the fact that all these values are not so big when you actually use the application, this is noticeable. Our users have responded to this. There are good reviews in the AppStore.
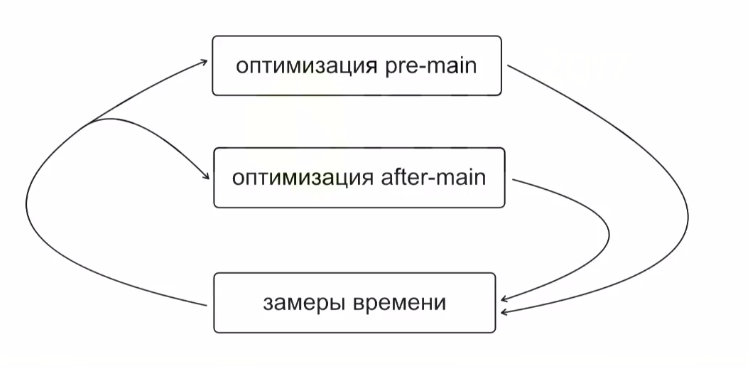
In conclusion, let's go over what we talked about today. Startup optimization is an iterative process.
At each iteration, you are trying to do something; you are putting forward and implementing some of your provisions. After the iteration, cycle the measurements on different or even on one device (what works on one iPhone will work on another iPhone). Then again, trying to improve something.
The optimization itself consists of working on two segments: pre-main and after-main. And they are optimized completely independently of each other, because with pre-main, only the system works for us - DYLD (dynamic loader), and after-main is our code.
When optimizing pre-main, we try, first, to reduce the number of dynamic libraries through the use of a plugin for cocoapods and through writing wrappers for extra swift standard libraries. And secondly, we are trying to reduce the size of the binary file.
When optimizing after-main, we are guided by a profiler, etc., trying to do as little work as possible at the start. We try not to create unnecessary entities (we create only the amount of UI that is needed to display the starting interface), and we are trying to postpone the work that is not necessary to be shown.
That's all the secrets.
If you like mobile development as well as we, we recommend to pay attention to the following reports at the upcoming conference Mobius 2017 Moscow :
Source: https://habr.com/ru/post/336852/
All Articles