Chrome DevTools Tricks
We turn to the most interesting - a selection of the most useful and interesting, in our opinion, tricks and hidden features of Chrome DevTools.
The animations menu in DevTools will allow you to slow down all the animations on a page or move a specific animation with your hands.
')
When you experiment with colors, you can use the eyedropper to select any element on the page or select from a palette of colors that are already used on the page. Or choose one of the colors material design.
Suppose you have a text block on the page and you want to know how it will look if the text in it changes. Switch the document to design mode! Type document.designMode = 'on' in the console, document.body.contentEditable = true works in the same way. After that you will be able to edit all elements with textual content.
Sometimes it is very difficult to say which font was actually rendered. At the bottom of the Computed tab of the toolbar, you can see which font is used, even if its name is not in the font-family list.
DevTools has a function that simulates the use of CSS pseudo-classes, such as: hover and: focus on elements, which simplifies their styling. It is available from the CSS editor.
Use Shift + Click on the color preview to change the format: rgb, hsl and hex.
You can easily change the time functions using DevTools (for example, property values for animation-timing-function CSS properties).
When reading HTML, the browser generates a DOM model. If it is necessary to output an element in the form of a JS object to the console, the easiest way to do this is to use the console.dir () method .
Sometimes it is useful to group logs to simplify working with them and less clogging the console. To do this, there are methods console.group (), console.groupCollapsed () and console.groupEnd ().
Sometimes it is much more convenient and clearer to work with arrays or objects as a table, and not as a standard hierarchical representation. The console.table () method exists for outputting data as a table.
Keys () - returns an array of object property names.
Values () - returns an array containing the values of all properties of the specified object.
Imagine that you have two functions that do the same thing, but their implementation is different. How to understand which one works faster? You can use the methods console.time () and console.timeEnd ().
In addition to measuring time, you can profile your code and display a profiling stack, which shows in detail where and how much time the browser has spent.
If you are familiar with jQuery, then you know about the possibility of constructions like $ ('. Class') and $ ('# id'). The developer console has similar functionality. Here “$” has nothing to do with jQuery, although it does the same. This is an abbreviation for the document.querySelector () function; it returns a reference to the first DOM element with the specified CSS selector. At the same time, if jQuery is available in the document, its “$” will override console functionality.
Returns an array of elements containing the specified selector. This command is equivalent to calling document.querySelectorAll () .
Clear () - clears all entries in the console.
Copy () - copy to the clipboard a string representation of the specified object.
Inspect () - opens and selects the specified element or object in the corresponding panel: Elements or Profiles.
(It works only when DevTools is open and only in Google Chrome browser!)
By a long press on the “Refresh Page” button (or by right-click), we open a special menu that gives us a choice:

Chrome's developer tools have a built-in smarter of minimized source codes to a readable form. The button is located in the lower left corner of the currently open file in the Sources tab.
Elements such as input fields and buttons, browsers, create from other basic elements that are usually hidden. However, you can go to Settings -> General and enable Show user agent shadow DOM to display these basic elements in the Elements tab. This will give you the opportunity to arrange them separately.
When working with DOM, CSS, a list of requests on the Network tab, etc. we often see in front of us a large list of elements, selectors, properties, and so on, in which it is difficult to quickly find the value we are interested in. In such cases, do not forget about the use of filtering and searching that is present on all tabs. Thanks to filtering, we will filter out all the options except the ones that match the conditions, and the search will allow you to quickly find what you need if you know the key “words” to search. As a rule, the search field is hidden and called by the combination Ctrl + F.
Just because the dark side is cooler (:
But seriously, a dark theme will save your eyes from unnecessary tension, if the main color of the page being developed or debugged is dark, as in my case. You can enable it at the beginning of the DevTools settings page.

Resources used:
→ developers.google.com/web/tools/chrome-devtools
→ habrahabr.ru
Layout
1. Inspect the animation.
The animations menu in DevTools will allow you to slow down all the animations on a page or move a specific animation with your hands.
')
2. Experimenting with colors
When you experiment with colors, you can use the eyedropper to select any element on the page or select from a palette of colors that are already used on the page. Or choose one of the colors material design.
3. Edit any text on the page.
Suppose you have a text block on the page and you want to know how it will look if the text in it changes. Switch the document to design mode! Type document.designMode = 'on' in the console, document.body.contentEditable = true works in the same way. After that you will be able to edit all elements with textual content.
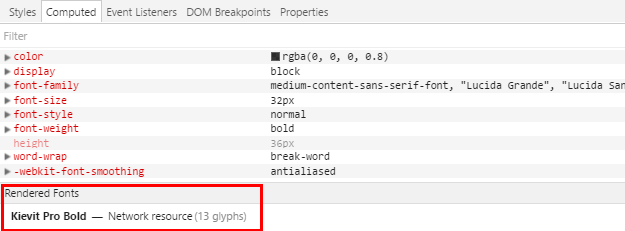
4. View rendered fonts
Sometimes it is very difficult to say which font was actually rendered. At the bottom of the Computed tab of the toolbar, you can see which font is used, even if its name is not in the font-family list.
5. Forced pseudo-classes for elements
DevTools has a function that simulates the use of CSS pseudo-classes, such as: hover and: focus on elements, which simplifies their styling. It is available from the CSS editor.
6. Changing the color format
Use Shift + Click on the color preview to change the format: rgb, hsl and hex.
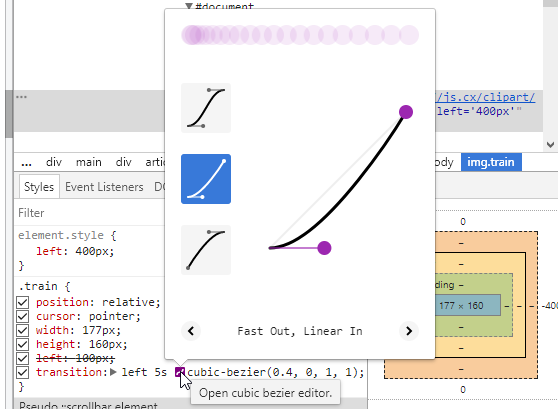
7. Bezier Curve Editor for Animation
You can easily change the time functions using DevTools (for example, property values for animation-timing-function CSS properties).
Console features
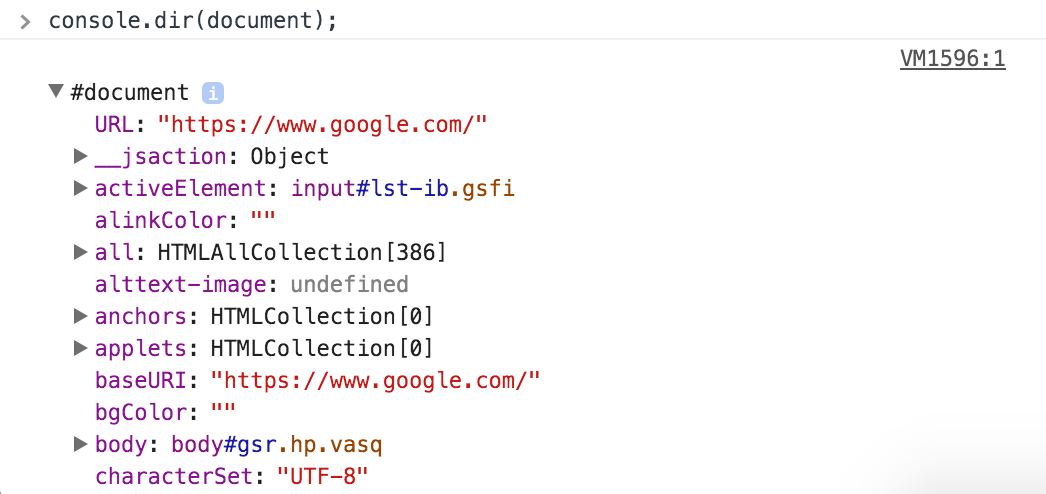
1. Output HTML element in JS object view
When reading HTML, the browser generates a DOM model. If it is necessary to output an element in the form of a JS object to the console, the easiest way to do this is to use the console.dir () method .
2. Message grouping
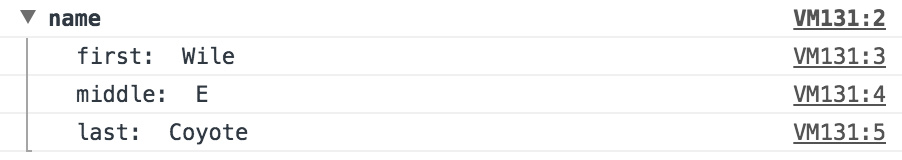
Sometimes it is useful to group logs to simplify working with them and less clogging the console. To do this, there are methods console.group (), console.groupCollapsed () and console.groupEnd ().
function name(obj) { console.group('name'); console.log('first: ', obj.first); console.log('middle: ', obj.middle); console.log('last: ', obj.last); console.groupEnd(); } name({"first":"Wile","middle":"E","last":"Coyote"}); 3.1. Outputting variable values as tables
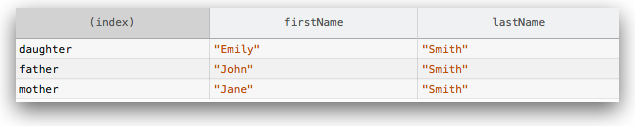
Sometimes it is much more convenient and clearer to work with arrays or objects as a table, and not as a standard hierarchical representation. The console.table () method exists for outputting data as a table.
function Person(firstName, lastName) { this.firstName = firstName; this.lastName = lastName; } var family = {}; family.mother = new Person("Jane", "Smith"); family.father = new Person("John", "Smith"); family.daughter = new Person("Emily", "Smith"); console.table(family); 3.2 keys (object) and values (object)
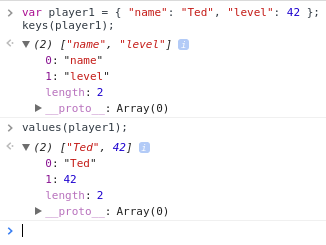
Keys () - returns an array of object property names.
Values () - returns an array containing the values of all properties of the specified object.
4. Logging code execution time
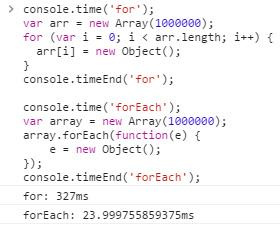
Imagine that you have two functions that do the same thing, but their implementation is different. How to understand which one works faster? You can use the methods console.time () and console.timeEnd ().
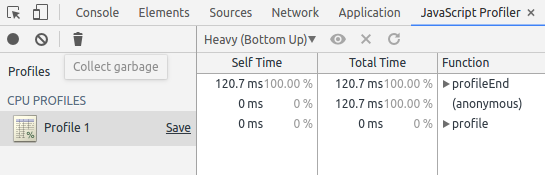
5. Profiling
In addition to measuring time, you can profile your code and display a profiling stack, which shows in detail where and how much time the browser has spent.
console.profile(); // Some code to execute console.profileEnd(); 6.1. $ (selector)
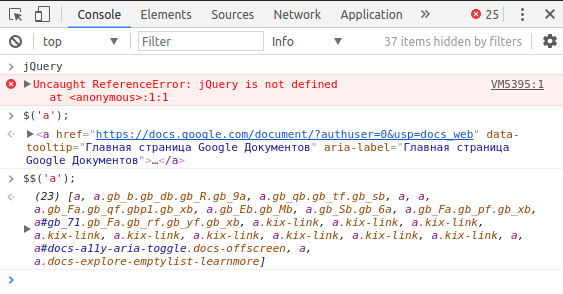
If you are familiar with jQuery, then you know about the possibility of constructions like $ ('. Class') and $ ('# id'). The developer console has similar functionality. Here “$” has nothing to do with jQuery, although it does the same. This is an abbreviation for the document.querySelector () function; it returns a reference to the first DOM element with the specified CSS selector. At the same time, if jQuery is available in the document, its “$” will override console functionality.
6.2. $$ (selector)
Returns an array of elements containing the specified selector. This command is equivalent to calling document.querySelectorAll () .
7. clear (), copy (object) and inspect (object / function)
Clear () - clears all entries in the console.
Copy () - copy to the clipboard a string representation of the specified object.
Inspect () - opens and selects the specified element or object in the corresponding panel: Elements or Profiles.
Other
1. Advanced Reboot Button
(It works only when DevTools is open and only in Google Chrome browser!)
By a long press on the “Refresh Page” button (or by right-click), we open a special menu that gives us a choice:
- Normal reboot (expired resources are updated).
- Hardware reboot (force download of all site resources).
- Clear cache and hard reset.
2. Formatting minified source code
Chrome's developer tools have a built-in smarter of minimized source codes to a readable form. The button is located in the lower left corner of the currently open file in the Sources tab.
3. Display shadow DOM
Elements such as input fields and buttons, browsers, create from other basic elements that are usually hidden. However, you can go to Settings -> General and enable Show user agent shadow DOM to display these basic elements in the Elements tab. This will give you the opportunity to arrange them separately.
4. Filtering and searching
When working with DOM, CSS, a list of requests on the Network tab, etc. we often see in front of us a large list of elements, selectors, properties, and so on, in which it is difficult to quickly find the value we are interested in. In such cases, do not forget about the use of filtering and searching that is present on all tabs. Thanks to filtering, we will filter out all the options except the ones that match the conditions, and the search will allow you to quickly find what you need if you know the key “words” to search. As a rule, the search field is hidden and called by the combination Ctrl + F.
5. Come to the Dark Side
Just because the dark side is cooler (:
But seriously, a dark theme will save your eyes from unnecessary tension, if the main color of the page being developed or debugged is dark, as in my case. You can enable it at the beginning of the DevTools settings page.
Resources used:
→ developers.google.com/web/tools/chrome-devtools
→ habrahabr.ru
Source: https://habr.com/ru/post/336710/
All Articles