In a section: the news aggregator on Android with backend. Monitoring and data visualization system (InfluxDB, Grafana)
→ Introduction (with links to all articles)
Complex systems (distributed / large / with complex logic / complex data system) - as a living organism: mobile, changeable and independent. All this requires constant monitoring by developers / administrators / DevOps engineers.
I came to this conclusion when the system “bent” several times during its development, server tuning and operation. This prompted me to the idea that monitoring should be carried out not only at the stage of production operation, but also at the development stage.
')
Everything in order ...
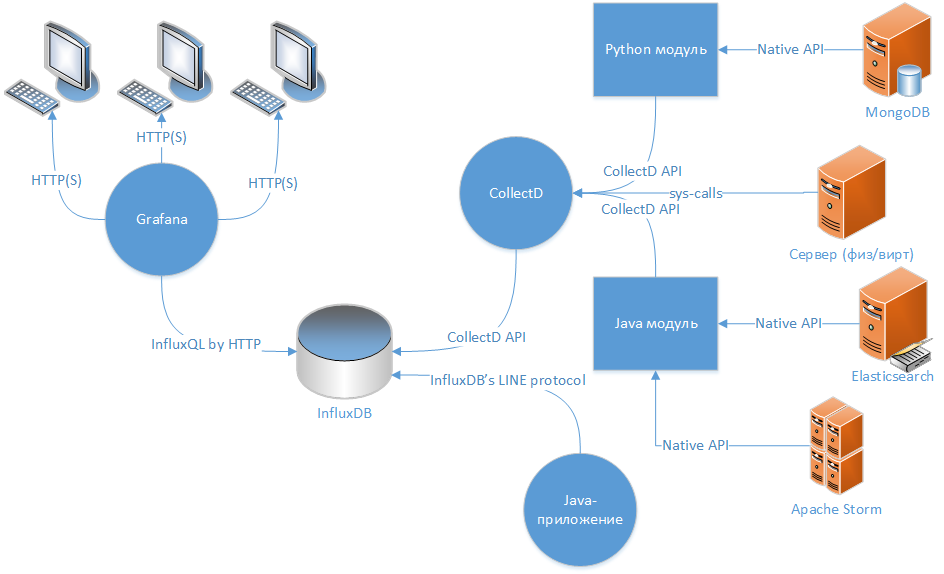
When I came to the conclusion about the need to monitor the project (at least the server part), I decided that the ideal option for this would be the following scheme: “data collector → TSDB → web client for displaying data”.
At the moment, there are a lot of articles dedicated to configuring Graphite as TSDB, but I chose a more modern and legacy-free solution based on InfluxDB . About InfluxDB has already been written on Habré in the blog of the company Selectel . I don’t want to copy someone else’s text, the only thing I can say is that some of the information is no longer true, but the basis is still true - the system is productive, flexible, accessible to work for different languages and supports different protocols of other TSDB and agents. Graphite, however, scared me away by the presence of several related demons written in Python (excessive complexity and additional components).
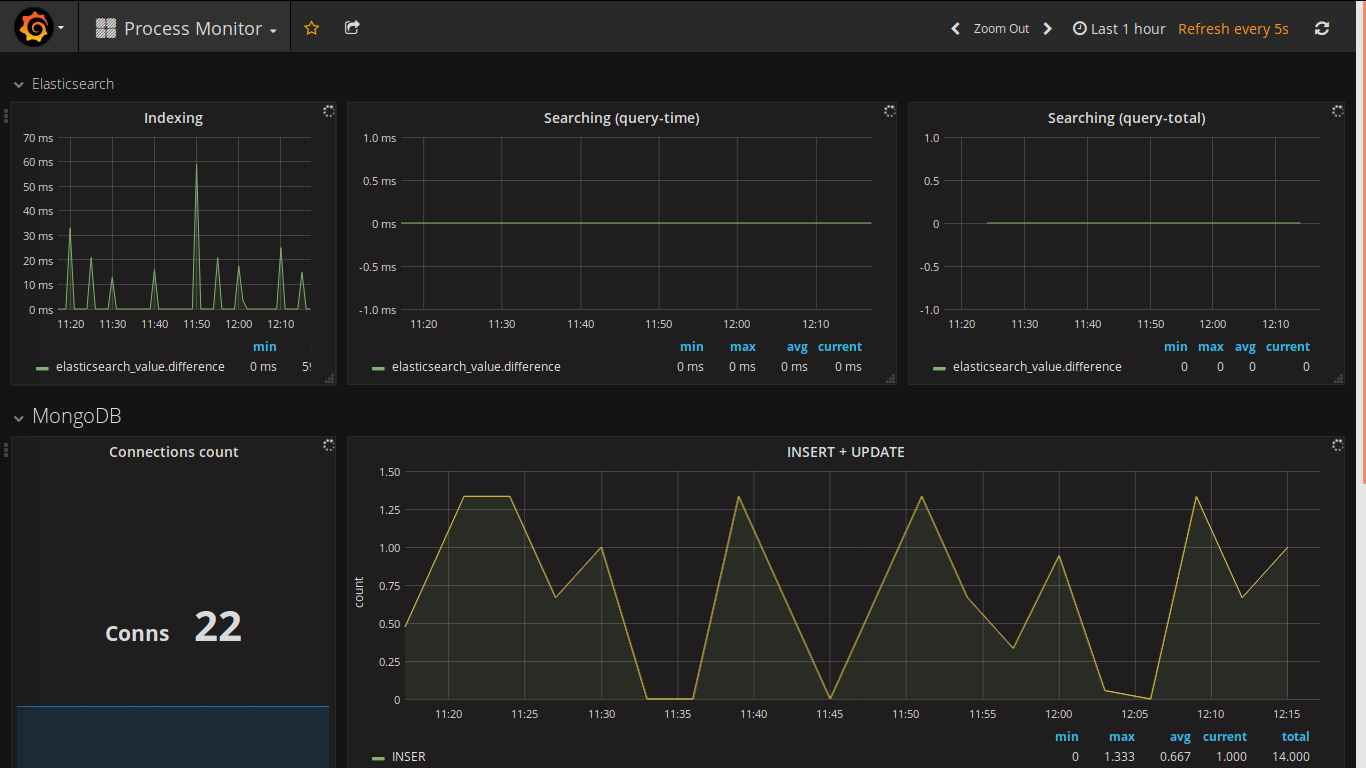
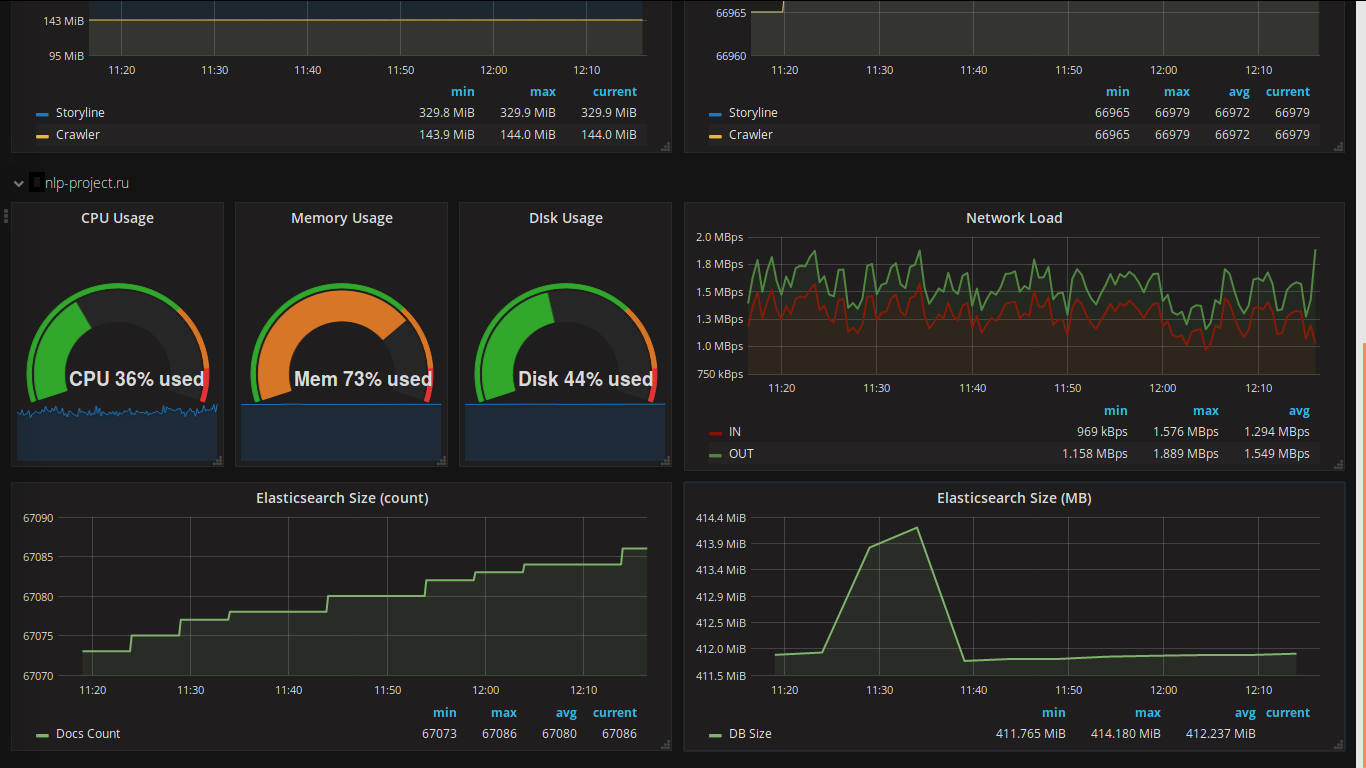
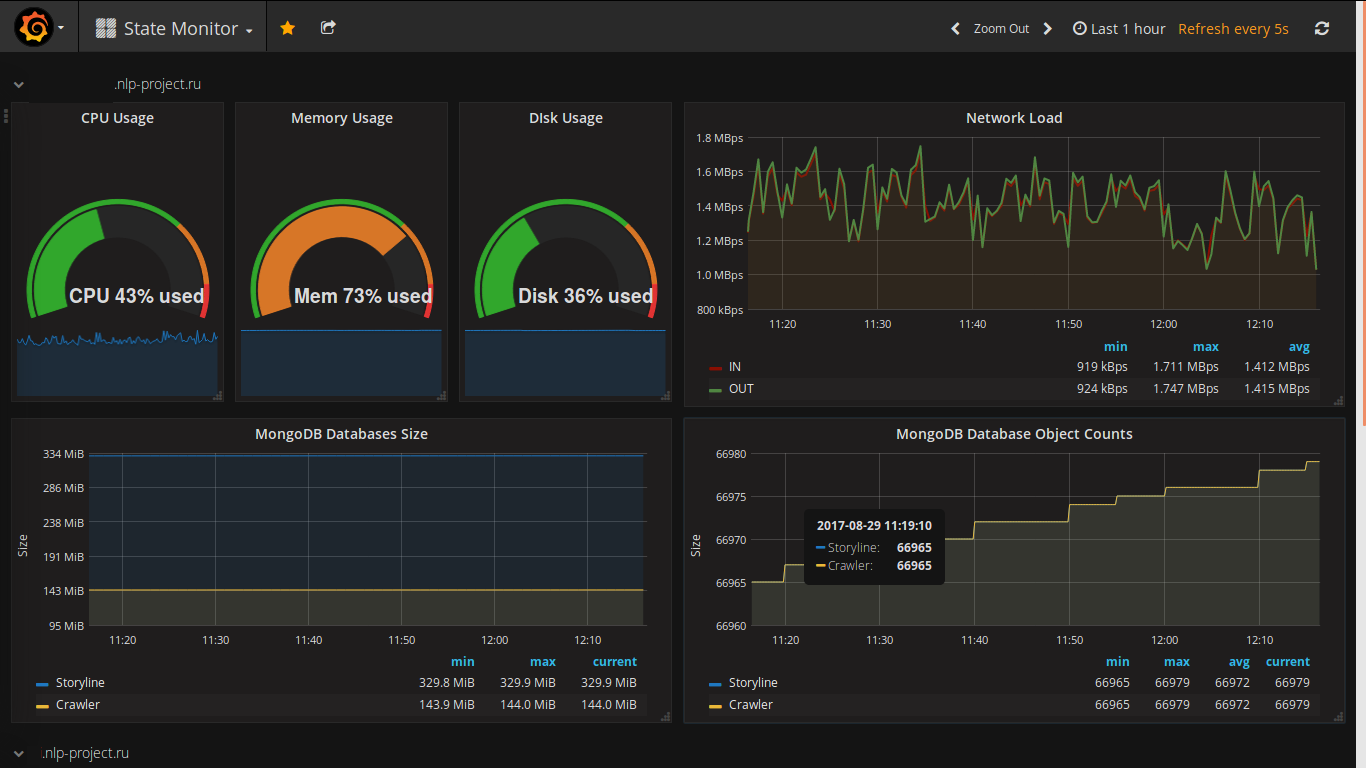
The choice of a web client to display data was made a long time ago (I saw it in action a long time ago and always wanted to use it in my project). Here are some screenshots from my project:
The features of grafana are:
And the link to ready-made dashboards is a wonderful opportunity to see how others form graphics and learn something for themselves (useful and / or beautiful). I podcherpnul :)
The client, bundled with InfluxDB itself - Chronograf is not so good in terms of functionality yet.
The main source for displaying data is time-series data from InfluxDB, and into it they come from 2 sources: the collectd daemon and the java-library " com.github.davidb: metrics-influxdb ".
Collectd is a daemon written in C that can transfer data to its network analog, the protocol of which InfluxDB can emulate. "Out of the box" it can collect a sufficiently large number of metrics in the server environment and in terms of services, the possibility of expansion is achieved through modules written in python or Java.
The collectd function of collecting information about the operation of the server (physical and virtual) quite suits me, but the additional settings required for collecting data from third-party services (in my case Elsticsearch, MongoDB and Apache Storm) are quite non-trivial and not always fully functional (for example, Elsticsearch does not correctly collect information on the speed of a query when there are several shard on different replicas). Most likely you should look in the direction of the native client InfluxDB - Telegraf .
This library is actually an adapter for the widely known Metrics java-library of metrics. Supports protocol version 0.9 for InfluxDB and allows you to transfer the necessary information in full.
Initialization is something like this:
In the future, use the usual Metrics API, which allows you to increase the transparency of what is being done in my software at any time.
This system allowed not only to monitor the operation of the system in the operating mode, but also to track changes caused by the changes - how the memory consumption, processing speed, data volume, etc., increased. Now, in principle, the page with the general dashboard is a bookmark on the kitchen laptop and the morning breakfast is always accompanied by events in the last 9 hours.
Thanks for attention!
Complex systems (distributed / large / with complex logic / complex data system) - as a living organism: mobile, changeable and independent. All this requires constant monitoring by developers / administrators / DevOps engineers.
I came to this conclusion when the system “bent” several times during its development, server tuning and operation. This prompted me to the idea that monitoring should be carried out not only at the stage of production operation, but also at the development stage.
')
Everything in order ...
When I came to the conclusion about the need to monitor the project (at least the server part), I decided that the ideal option for this would be the following scheme: “data collector → TSDB → web client for displaying data”.
TSDB selection
At the moment, there are a lot of articles dedicated to configuring Graphite as TSDB, but I chose a more modern and legacy-free solution based on InfluxDB . About InfluxDB has already been written on Habré in the blog of the company Selectel . I don’t want to copy someone else’s text, the only thing I can say is that some of the information is no longer true, but the basis is still true - the system is productive, flexible, accessible to work for different languages and supports different protocols of other TSDB and agents. Graphite, however, scared me away by the presence of several related demons written in Python (excessive complexity and additional components).
Puppet script to install and configure InfluxDB
class storyline_infra::influxdb () { include stdlib $params = lookup({"name" => "storyline_infra.influxdb", "merge" => {"strategy" => "deep"}}) $port_http = $params['port_http'] $port_rpc = $params['port_rpc'] $pid_file = $params['pid_file'] $init_script = $params['init_script'] $dir_data = $params['dir_data'] $dir_logs = $params['dir_logs'] $enabled_auth = $params['enabled_auth'] $enabled_startup = $params['enabled_startup'] $enabled_running = $params['enabled_running'] $version = $params['version'] $dist_name = $facts['os']['name'] user { 'influxdb': ensure => "present", managehome => true, } exec { "influxdb-mkdir": command => "/bin/mkdir -p /data/db && /bin/mkdir -p /data/logs", cwd => "/", unless => '/usr/bin/test -d /data/db -a -d /data/logs', } -> # working dir file { $dir_logs: ensure => "directory", recurse => "true", owner => "influxdb", group=> "influxdb", require => Exec['influxdb-mkdir'], } file { $dir_data: ensure => "directory", recurse => "true", owner => "influxdb", group=> "influxdb", require => Exec['influxdb-mkdir'], } # see by "gpg --verify keyfile" apt::key { 'influxdb-key': id => '05CE15085FC09D18E99EFB22684A14CF2582E0C5', source => 'https://repos.influxdata.com/influxdb.key', } -> # echo "deb https://repos.influxdata.com/${DISTRIB_ID,,} ${DISTRIB_CODENAME} stable" | sudo tee /etc/apt/sources.list.d/influxdb.list apt::source { 'influxdb-repo': comment => 'influxdb repo', location => "https://repos.influxdata.com/${downcase($dist_name)}", release => "${facts['os']['distro']['codename']}", repos => 'stable', include => { 'deb' => true, }, } -> package { 'influxdb': ensure => $version, } -> file { "/etc/influxdb/influxdb.conf": replace => true, content => epp('storyline_infra/influxdb.epp'), owner => "influxdb", group=> "influxdb", notify => Service['influxdb'], }-> file { $init_script: replace => true, content => epp('storyline_infra/influxdb_startup.epp'), mode=>"ug=rwx,o=r", notify => Service['influxdb'], }-> service { 'influxdb': ensure => $enabled_running, enable => $enabled_startup, start => "${init_script} start", stop => "${init_script} stop", status => "${init_script} status", restart => "${init_script} restart", hasrestart => true, hasstatus => true, } if $enabled_startup != true { exec { "disable_influxdb": command => "/bin/systemctl disable influxdb", cwd => "/", } } logrotate::rule { 'influxdb': path => "${dir_logs}/*.log", rotate => 10, missingok => true, copytruncate => true, dateext => true, size => '10M', rotate_every => 'day', } } Grafana
The choice of a web client to display data was made a long time ago (I saw it in action a long time ago and always wanted to use it in my project). Here are some screenshots from my project:
The features of grafana are:
- Nice appearance
- Dynamic update of all data
- Visual designer
- Connecting a large number of data source types (Graphite, InfluxDB, Prometheus, Elasticsearch ...)
- Many ways to authenticate
- Ability to send Alert `s (Slack, PagerDuty, VictorOps, OpsGenie ...)
- A large number of plug-ins to extend the functionality
And the link to ready-made dashboards is a wonderful opportunity to see how others form graphics and learn something for themselves (useful and / or beautiful). I podcherpnul :)
The client, bundled with InfluxDB itself - Chronograf is not so good in terms of functionality yet.
Puppet script for installing and configuring Grafana
class storyline_infra::grafana () { include stdlib $params = lookup({"name" => "storyline_infra.grafana", "merge" => {"strategy" => "deep"}}) $port = $params['port'] $pid_file = $params['pid_file'] $init_script = $params['init_script'] $dir_data = $params['dir_data'] $dir_logs = $params['dir_logs'] $enabled_startup = $params['enabled_startup'] $enabled_running = $params['enabled_running'] $version = $params['version'] user { 'grafana': ensure => "present", managehome => true, } exec { "grafana-mkdir": command => "/bin/mkdir -p /data/db && /bin/mkdir -p /data/logs", cwd => "/", unless => '/usr/bin/test -d /data/db -a -d /data/logs', } -> # working dir file { $dir_logs: ensure => "directory", recurse => "true", owner => "grafana", group=> "grafana", require => Exec['grafana-mkdir'], } file { $dir_data: ensure => "directory", recurse => "true", owner => "grafana", group=> "grafana", require => Exec['grafana-mkdir'], } # see by "gpg --verify keyfile" apt::key { 'grafana-key': id => '418A7F2FB0E1E6E7EABF6FE8C2E73424D59097AB', source => 'https://packagecloud.io/gpg.key', } -> # deb https://packagecloud.io/grafana/stable/debian/ jessie main apt::source { 'grafana-repo': comment => 'grafana repo', location => "https://packagecloud.io/grafana/stable/debian/", release => "jessie", repos => 'main', include => { 'deb' => true, }, } -> package { 'grafana': ensure => 'present', } file { '/etc/init.d/grafana-server': ensure => 'absent', } -> file { '/etc/grafana': ensure => "directory", } -> file { "/etc/grafana/grafana.ini": replace => true, content => epp('storyline_infra/grafana.epp'), owner => "grafana", group=> "grafana", notify => Service['grafana'], } -> file { $init_script: replace => true, content => epp('storyline_infra/grafana_startup.epp'), mode=>"ug=rwx,o=r", notify => Service['grafana'], }-> service { 'grafana': ensure => $enabled_running, enable => $enabled_startup, start => "${init_script} start", stop => "${init_script} stop", status => "${init_script} status", restart => "${init_script} restart", hasrestart => true, hasstatus => true, } if $enabled_startup != true { exec { "disable_grafana": command => "/bin/systemctl disable grafana", cwd => "/", } } } About data collection
The main source for displaying data is time-series data from InfluxDB, and into it they come from 2 sources: the collectd daemon and the java-library " com.github.davidb: metrics-influxdb ".
Collectd
Collectd is a daemon written in C that can transfer data to its network analog, the protocol of which InfluxDB can emulate. "Out of the box" it can collect a sufficiently large number of metrics in the server environment and in terms of services, the possibility of expansion is achieved through modules written in python or Java.
The collectd function of collecting information about the operation of the server (physical and virtual) quite suits me, but the additional settings required for collecting data from third-party services (in my case Elsticsearch, MongoDB and Apache Storm) are quite non-trivial and not always fully functional (for example, Elsticsearch does not correctly collect information on the speed of a query when there are several shard on different replicas). Most likely you should look in the direction of the native client InfluxDB - Telegraf .
Puppet script to install and configure Collectd
class storyline_infra::collectd () { include stdlib $params = lookup({"name" => "storyline_infra.collectd", "merge" => {"strategy" => "deep"}}) $server_port = $params['server_port'] $server_address = $params['server_address'] $pid_file = $params['pid_file'] $init_script = $params['init_script'] $dir_data = $params['dir_data'] $dir_logs = $params['dir_logs'] $enabled_startup = $params['enabled_startup'] $enabled_running = $params['enabled_running'] $version = $params['version'] # mongo db $enabled_mongodb = $params['enabled_mongodb'] $mongodb_user = $params['mongodb_user'] $mongodb_password = $params['mongodb_password'] # storm db $enabled_storm = $params['enabled_storm'] $storm_ui_url = $params['storm_ui_url'] # elasticsearch $enabled_elasticsearch = $params['enabled_elasticsearch'] $elasticsearch_host = $params['elasticsearch_host'] $elasticsearch_port = $params['elasticsearch_port'] $elasticsearch_cluster = $params['elasticsearch_cluster'] exec { "collectd-mkdir": command => "/bin/mkdir -p /data/db && /bin/mkdir -p /data/logs", cwd => "/", unless => '/usr/bin/test -d /data/db -a -d /data/logs', } -> # working dir file { $dir_logs: ensure => "directory", recurse => "true", require => Exec['collectd-mkdir'], } file { $dir_data: ensure => "directory", recurse => "true", require => Exec['collectd-mkdir'], } package { 'collectd': # ensure => $version, ensure => "present", } -> file { "/etc/collectd/collectd.conf": replace => true, content => epp('storyline_infra/collectd.epp'), notify => Service['collectd'], }-> file { $init_script: replace => true, content => epp('storyline_infra/collectd_startup.epp'), mode=>"ug=rwx,o=r", notify => Service['collectd'], }-> service { 'collectd': ensure => $enabled_running, enable => $enabled_startup, start => "${init_script} start", stop => "${init_script} stop", status => "${init_script} status", restart => "${init_script} restart", hasrestart => true, hasstatus => true, } if $enabled_startup != true { exec { "disable_collectd": command => "/bin/systemctl disable collectd & /bin/systemctl disable collectd.service", cwd => "/", } } if $enabled_mongodb { package { 'python-pip': ensure => "present", } -> exec { "install-pymongo": command => "/usr/bin/python -m pip install pymongo", cwd => "/", unless => '/usr/bin/python -m pip show pymongo', } -> file { "/usr/share/collectd/mongodb": ensure => "directory", }-> file { "/usr/share/collectd/mongodb.py": replace => true, content => epp('storyline_infra/collectd_mongodb_py.epp'), }-> file { "/usr/share/collectd/mongodb/types.db": replace => true, content => epp('storyline_infra/collectd_mongodb_types_db.epp'), }-> file { "/etc/collectd/collectd.conf.d/mongodb.conf": replace => true, content => epp('storyline_infra/collectd_mongodb_conf.epp'), notify => Service['collectd'], } } # if $enabled_mongodb { # https://github.com/srotya/storm-collectd if $enabled_storm { file { "/usr/share/collectd/java/storm-collectd.jar": replace => true, ensure => file, source => "puppet:///modules/storyline_infra/storm-collectd.jar", }-> file { "/etc/collectd/collectd.conf.d/storm.conf": replace => true, content => epp('storyline_infra/collectd_storm_conf.epp'), notify => Service['collectd'], } } # if $enabled_mongodb { # https://github.com/signalfx/integrations/tree/master/collectd-elasticsearch # https://github.com/signalfx/collectd-elasticsearch if $enabled_elasticsearch { file { "/usr/share/collectd/elasticsearch.py": replace => true, content => epp('storyline_infra/collectd_elasticsearch_py.epp'), }-> file { "/etc/collectd/collectd.conf.d/elasticsearch.conf": replace => true, content => epp('storyline_infra/collectd_elasticsearch_conf.epp'), notify => Service['collectd'], } } # if $enabled_mongodb { } com.github.davidb: metrics-influxdb
This library is actually an adapter for the widely known Metrics java-library of metrics. Supports protocol version 0.9 for InfluxDB and allows you to transfer the necessary information in full.
Initialization is something like this:
if (metricsConfiguration.enabled) { String hostName = InetAddress.getLocalHost().getCanonicalHostName(); final ScheduledReporter reporterInfluxDB = InfluxdbReporter.forRegistry(metricRegistry) .protocol(new HttpInfluxdbProtocol("http", metricsConfiguration.influxdbHost, metricsConfiguration.influxdbPort, metricsConfiguration.influxdbUser, metricsConfiguration.influxdbPassword, metricsConfiguration.influxdbDB)) // rate + dim conversions .convertRatesTo(TimeUnit.SECONDS).convertDurationsTo(TimeUnit.MILLISECONDS) // filter .filter(MetricFilter.ALL) // don't skip .skipIdleMetrics(false) // hostname tag .tag("host", hostName) // !!! converter // al metrics must be of form: "processed_links.site_ru .crawling" -> "crawling // source=site_ru, param=processed_links value=0.1" .transformer(new CategoriesMetricMeasurementTransformer("param", "source")) .build(); reporterInfluxDB.start(metricsConfiguration.reportingPeriod, TimeUnit.SECONDS); } In the future, use the usual Metrics API, which allows you to increase the transparency of what is being done in my software at any time.
This system allowed not only to monitor the operation of the system in the operating mode, but also to track changes caused by the changes - how the memory consumption, processing speed, data volume, etc., increased. Now, in principle, the page with the general dashboard is a bookmark on the kitchen laptop and the morning breakfast is always accompanied by events in the last 9 hours.
Thanks for attention!
Source: https://habr.com/ru/post/336650/
All Articles