Analysis of MS SQL Server, for those who see it for the first time (part 2)
Part 1
We continue to analyze what is happening on our MS SQL server. In this part, we will look at how to get information about the work of users: who does what and how much resources are spent on it.
I think the second part will be of interest not only to DBA administrators, but also to developers (maybe even more developers) who need to understand what is wrong with queries on the production server, which previously worked fine in the test.
')
The tasks of analyzing user actions can be divided into groups and we will consider each separately:
The first paragraph is quite simple, we’ll dwell on it briefly. Consider only some less obvious things.
SSMS , in addition to the results of the query, allows you to receive additional information about the execution of the query:
Let's summarize the first part:
For the second section we arm with profiler th. After starting and connecting to the server, it is necessary to select logged events. You can go a simple way - run profiling with a standard trace template. On the “General” tab, in the “Use the template” field, select “Standard (default)” and click “Run”.
A slightly more complicated way is to add (or subtract) filters or events to the selected template. These options on the second tab of the dialogue. To see the full set of possible events and columns for selection, select the “Show All Events” and “Show All Columns” checkboxes.
From the events we will need (it is better not to include the extra ones - in order to create less traffic):
These events log all external sql calls to the server. They arise, as the name implies (Completed), after the end of the processing of the request. There are similar events fixing the start of the sql call:
But they suit us less, because they do not contain information about server resources spent on the execution of the request. It is obvious that such information is available only at the end of execution. Accordingly, columns with data on CPU, Reads, Writes in * Starting events will be empty.
Still useful events that we will not include yet:
These events are convenient for tracking execution steps. For example, when using the debugger is impossible.
By columns
Which to choose, as a rule, is clear from the name of the column. We will need:
Add other columns to your taste.
By clicking the "Column Filters ..." button, you can open the event filter installation dialog. If you are interested in the activity of a particular user, set the filter by session number or username. Unfortunately, in the case of connecting the application through the app-server with the pool of connections, it is more difficult to track a specific user.
Filters can be used, for example, to select only "heavy" requests (Duration> X). Or requests that cause intensive writing (Writes> Y). Yes, even just the contents of the request.
What else do we need from the profiler? Of course the execution plan!
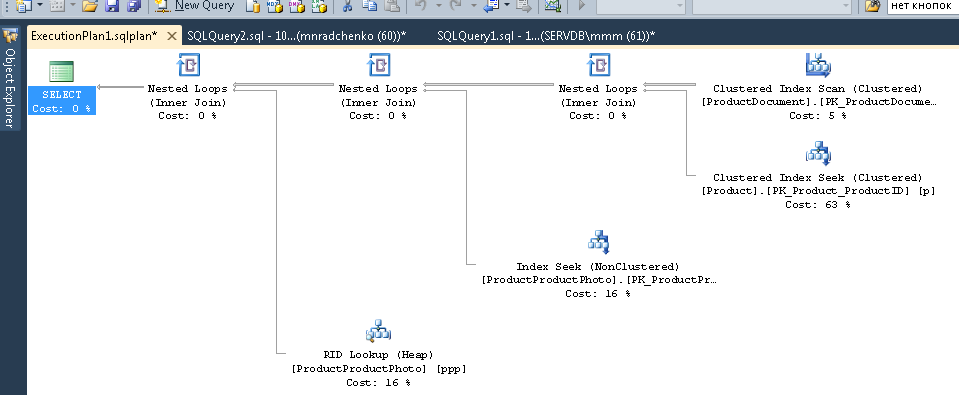
This possibility is available. You need to add the event "Performance \ Showplan XML Statistics Profile" to the trace. Fulfilling our request, we get about the following image.
And that is not all
The route can be saved to a file or a database table (and not just display it on the screen).
Trace settings can be saved as a personal template for quick launch.
Tracing can also be performed without a profiler using t-sql code using the following procedures: sp_trace_create, sp_trace_setevent, sp_trace_setstatus, sp_trace_getdata. An example of how to do this. This approach can be useful, for example, to automatically start recording tracks to a file on a schedule. How exactly to use these commands, you can peek at the profiler. It is enough to run two traces and in one to track what happens when the second starts. Pay attention to the filter on the column "ApplicationName" - check that there is no filter on the profiler itself.
The list of events recorded by the profiler is very extensive and is not limited only to receiving query texts. There are events fixing fullscan, recompilation, autogrow, deadlock and more.
Life situations are also such when the information from the sections above does not help:
Some kind of query hangs on the "execution" for a very long time and it is unclear whether it will ever end or not. Analyze the problem request separately - I would like to - but you must first determine what kind of request. The profiler is useless to catch - we have already missed the starting event, and the completed one is unclear how long to wait.
Or maybe not a user request at all, or maybe the server itself is actively doing something ...
Let's understand
All of you probably saw "Activity Monitor". In older studios, its functionality has become richer. How can he help us? There is a lot of useful and interesting information in the Activity Monitor, but the third section is not about it. All we need is to get directly from the system views and functions (and the Monitor itself is useful because you can set a profiler on it and see what requests it performs).
We will need:
Important notes
The above list is only a small part. A complete list of all system views and functions is described in the documentation . Also, there is a diagram of the links of the main objects in the form of a beautiful picture - you can print it on A1 and hang it on the wall.
The request text, its plan and execution statistics are the data stored in the procedural cache. At runtime, they are available. Once completed, accessibility is not guaranteed and depends on the pressure on the cache. Yes, you can clear the cache manually. Sometimes it is advised to do it when the execution plans “floated”, but there are a lot of nuances ... In general, “There are contraindications, it is recommended to consult with a specialist”.
The “command” field is practically meaningless for user requests - after all, we can get the full text ... But everything is not so simple. This field is very important for obtaining information about system processes. As a rule, they perform some internal tasks and do not have the text sql. For such processes, team information is the only hint at the type of activity. In the comments to the previous article there was a question about what the server is busy when, it seems, it should not be busy with anything - perhaps the answer will be in the meaning of this field. In my practice, the “command” field for active system processes always showed something quite understandable: autoshrink / autogrow / checkpoint / logwriter /, etc.
How to use it
Let's move on to the practical part. I will give a few examples of use, but do not limit your imagination. Server possibilities are not limited to this - you can invent something of your own.
Example 1: What process consumes cpu / reads / writes / memory
To begin with, let's see which sessions consume the most, for example, CPU. Information in sys.dm_exec_sessions. But data on CPU (and also reads, writes) - accumulative. That is, the number in the field contains "total" for all the time of connection. It is clear that the one who connected a month ago will most of all, but has never disconnected. This does not mean that he is loading the system right now.
A bit of code solves the problem, an algorithm like this:
In the code I use two tables: #tmp - for the first sample, # tmp1 - for the second. When you first start, the script creates and fills #tmp and # tmp1 with an interval of one second, and does the rest. On subsequent launches, the script uses the results of the previous execution as a base for comparison. Accordingly, the duration of paragraph 2 on subsequent launches will be equal to the duration of your waiting between script launches. Try to perform, you can immediately on the working server - the script creates only "temporary tables" (available only within the current session and self-destruct when disconnected) and does not carry a danger.
Those who do not like to fulfill a request in the studio can wrap it in an application written in their favorite programming language. I will show how to do this in MS Excel without a single line of code.
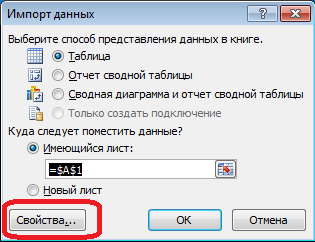
In the menu "Data" connect to the server. If you want to choose a table - choose an arbitrary - then change it. As always, click “Next” and “Finish” until we see the “Import Data” dialog - in it you need to click “Properties ...”. In the properties it is necessary to change the “command type” to the value “SQL” and insert our slightly modified query into the field “command text”.
The request will have to be changed a bit:
When the data is in Excel, you can sort it as you need. To update the information - click "Update". For convenience, in the settings of the book, you can set “auto-update” after a specified period of time and “update on opening”. File can save and transfer to colleagues. Thus, we have collected a convenient and simple tool frommanure and twigs of improvised means.
Example 2: What the session is spending resources on
So, in the previous example, we identified problem sessions. Now we define what they do. We use sys.dm_exec_requests, and also functions of obtaining the text and the plan of request.
Substitute the session number in the request and execute. After execution, there will be plans on the “Results” tab (two: the first for the entire request, the second for the current step - if there are several steps in the request), on the “Messages” tab - the query text. To view the plan - you need to click on the line on the text in the form of url. The plan will open in a separate tab. Sometimes it happens that the plan is not opened in graphic form, but in the form of xml-text. This is most likely due to the fact that the studio version is lower than the server. Try resaving the resulting xml to a file with the sqlplan extension, first deleting the “Version” and “Build” references from the first line, and then opening it separately. If this does not help, I remind you that 2016 studio is officially available for free on the MS website.
Obviously, the resulting plan will be "estimated", because The request is still running. But you can still get some statistics on execution. We use the sys.dm_exec_query_stats view with a filter by our handles.
We add to the end of the previous query
After execution, in the results we will receive information about the steps of the executed query: how many times they were executed and what resources were spent.Information in the statistics gets after execution - when you first run there, unfortunately, is empty. Statistics is not tied to the user, but is maintained throughout the entire server — if different users execute the same query — the statistics will be summary for all.
Example 3: And you can see all
Let's combine the system views and functions discussed in one request. This can be convenient for assessing the overall situation.
The request displays a list of active sessions and the texts of their requests. For system processes, I recall, usually the request is absent, but the “command” field is filled. Visible information about locks and waits. You can try to cross this query with example 1, and also sort by load. But be careful - the texts of the requests can be very large. Choosing them massively can be resource intensive. Yes, and traffic will be great. In the example, I limited the received request to the first 500 characters, but did not begin to make a plan.
Examples of requests laid out on githab .
It would still be nice to get Live Query Statistics for an arbitrary session. According to the manufacturer, at the moment, the constant collection of statistics requires significant resources and therefore, by default, is disabled. The inclusion is not a problem, but additional manipulations complicate the process and reduce the practical benefits. Perhaps we will try to do this in a separate article.
In this part, we reviewed the analysis of user actions. We tried several ways: using the capabilities of the studio itself, using the profiler, as well as direct access to system views. All these methods allow us to estimate the cost of executing the request and get the execution plan. There is no need to be limited to one of them - each method is convenient in its situation. Try to combine.
We still have an analysis of the load on memory and the network, as well as other nuances. Let's get to them. Material for a few articles.
Thanks to Vlad for help in creating the article.
We continue to analyze what is happening on our MS SQL server. In this part, we will look at how to get information about the work of users: who does what and how much resources are spent on it.
I think the second part will be of interest not only to DBA administrators, but also to developers (maybe even more developers) who need to understand what is wrong with queries on the production server, which previously worked fine in the test.
')
The tasks of analyzing user actions can be divided into groups and we will consider each separately:
- analyze a specific query
- analyze the load from the application in specific conditions (for example, when a user clicks a button in a third-party application working with the database)
- analysis of the current situation
A warning
Performance analysis requires a deep understanding of the device and the principles of the database server and operating system. Therefore, reading only these articles will not make you an expert.
Considered criteria and counters in real systems are complexly dependent on each other. For example, a high load HDD is often associated with the problem not of the HDD itself, but with a lack of RAM. Even if you take some of the measurements, this is not enough for a balanced assessment of problems.
The purpose of the articles is to introduce basic things using simple examples. Recommendations should not be considered as a “guide to action”, consider them as learning tasks (simply reflecting reality) and as “think about” options designed to clarify the train of thought.
I hope, on the basis of the articles, you will learn how to argue in numbers your conclusions about the server’s work. And instead of the words “server slows down” you will give specific values of specific indicators.
Analyzing a specific query
The first paragraph is quite simple, we’ll dwell on it briefly. Consider only some less obvious things.
SSMS , in addition to the results of the query, allows you to receive additional information about the execution of the query:
- Practically everyone knows that the query plan is obtained with the buttons “Display Estimated Execution Plan” (evaluation plan) and “Include Actual Execution Plan” (actual plan). They differ in that the evaluation plan is built without fulfilling the request. Accordingly, information on the number of processed lines in it will be only an estimate. In actual terms, there will be both estimated and actual data. Strong discrepancies between these values indicate that statistics are irrelevant. However, the analysis of the plan is a topic for a separate large article - until we go deep.
- A less well-known fact is that you can receive measurements of the cost of the processor and server disk operations. To do this, you must enable the SET options either in the dialog through the menu "Query" / "Query options ..."Screen

or directly with the SET commands in the request, for exampleSET STATISTICS IO ON SET STATISTICS TIME ON SELECT * FROM Production.Product p JOIN Production.ProductDocument pd ON p.ProductID = pd.ProductID JOIN Production.ProductProductPhoto ppp ON p.ProductID = ppp.ProductID
As a result of execution, we obtain data on the time spent on compiling and executing, as well as the number of disk operations.Sample outputSQL Server parse and compile time:
CPU time = 16 ms, elapsed time = 89 ms.
SQL Server running time:
CPU time = 0 ms, elapsed time = 0 ms.
SQL Server running time:
CPU time = 0 ms, elapsed time = 0 ms.
(32 row (s) affected)
Table "ProductProductPhoto". The number of views is 32, logical reads 96, physical reads 5, preemptive reads 0, lob logical reads 0, lob physical reads 0, lob prefetching reads 0.
Table "Product". The number of views 0, logical reads 64, physical reads 0, prefetch reads 0, lob logical reads 0, lob physical reads 0, lob prefetch reads 0.
Table "ProductDocument". The number of views 1, logical reads 3, physical reads 1, preemptive reads 0, lob logical reads 0, lob physical reads 0, lob prefetching reads 0.
SQL Server running time:
CPU time = 15 ms, elapsed time = 35 ms.
Here you should pay attention to the compilation time and the text of "logical readings 96, physical readings 5". With the second and subsequent executions of the same query, the physical reads may decrease, and re-compilation may not be necessary. Because of this, it often happens that the second and subsequent times the request is executed faster than the first. The reason, as you understand, is in caching data and compiled query plans. - Another useful button next to the buttons of the plans - “Include Client Statistics” - displays information on the network exchange, the number of operations performed and the total execution time, taking into account the costs of network exchange and processing by the client.An example that shows that the first execution takes more time.
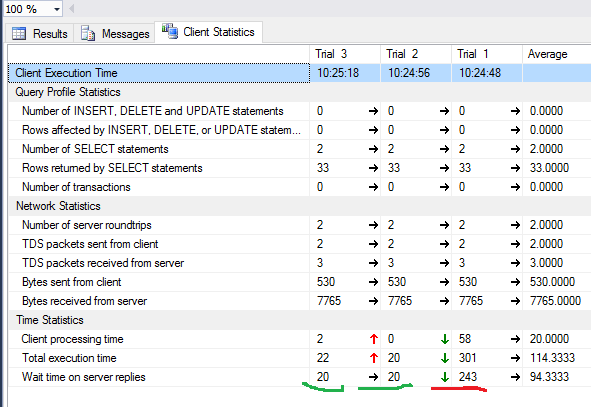
- In the SSMS 2016 version, the button "Include Live Query Statistics" appeared. Displays a picture as in the case with the request plan, only the numbers of the processed lines on it are not static, but change on the screen right in the process of executing the request. The picture is very clear - you can immediately see from the flashing arrows and running numbers where time is wasting. The button is in the 2016 studio, but works with servers since the 2014 version.
Let's summarize the first part:
- Processor costs are using SET STATISTICS TIME ON.
- Disk operations: SET STATISTICS IO ON. Do not forget that “logical read” is a read operation that ends in the disk cache without physically accessing the disk system. “Physical reading” takes significantly longer.
- We estimate the volume of network traffic using “Include Client Statistics”.
- We analyze the query execution algorithm in detail according to the “execution plan” using the “Include Actual Execution Plan” and “Include Live Query Statistics”.
Analyzing the load from the application
For the second section we arm with profiler th. After starting and connecting to the server, it is necessary to select logged events. You can go a simple way - run profiling with a standard trace template. On the “General” tab, in the “Use the template” field, select “Standard (default)” and click “Run”.
Picture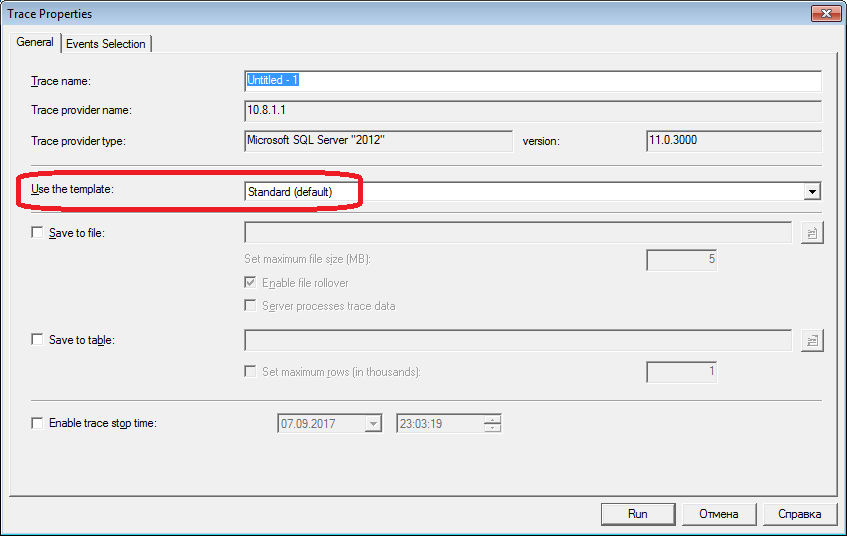
A slightly more complicated way is to add (or subtract) filters or events to the selected template. These options on the second tab of the dialogue. To see the full set of possible events and columns for selection, select the “Show All Events” and “Show All Columns” checkboxes.
Picture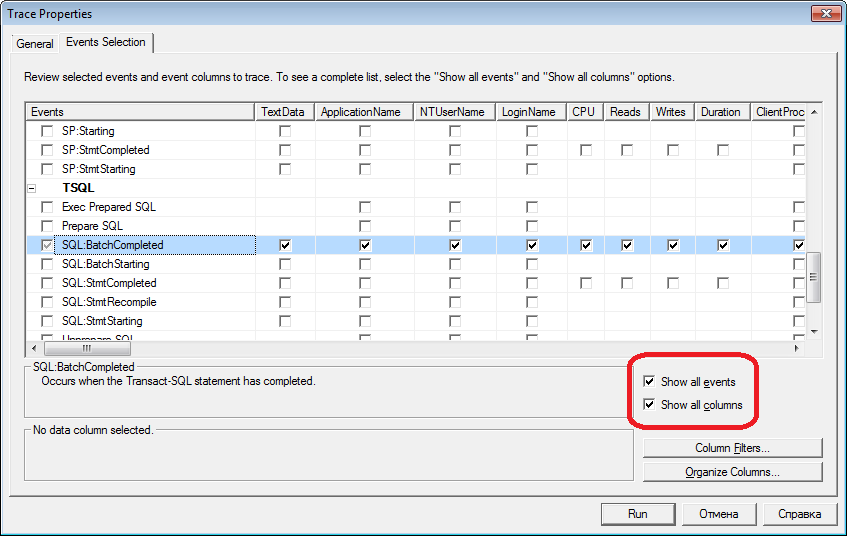
From the events we will need (it is better not to include the extra ones - in order to create less traffic):
- Stored Procedures \ RPC: Completed
- TSQL \ SQL: BatchCompleted
These events log all external sql calls to the server. They arise, as the name implies (Completed), after the end of the processing of the request. There are similar events fixing the start of the sql call:
- Stored Procedures \ RPC: Starting
- TSQL \ SQL: BatchStarting
But they suit us less, because they do not contain information about server resources spent on the execution of the request. It is obvious that such information is available only at the end of execution. Accordingly, columns with data on CPU, Reads, Writes in * Starting events will be empty.
Still useful events that we will not include yet:
- Stored Procedures \ SP: Starting (* Completed) - records an internal call to a stored procedure (not from the client, but within the current request or another procedure).
- Stored Procedures \ SP: StmtStarting (* Completed) - fixes the start of each expression inside the stored procedure. If there is a cycle in the procedure, there will be as many events for the commands within the cycle as there were iterations in the cycle.
- TSQL \ SQL: StmtStarting (* Completed) - fixes the start of each expression inside SQL-batch. If your request contains several commands, it will be an event for each. Those. similar to the previous one, only valid not for commands within procedures, but for commands within a request.
These events are convenient for tracking execution steps. For example, when using the debugger is impossible.
By columns
Which to choose, as a rule, is clear from the name of the column. We will need:
- TextData, BinaryData - for the events described above contain the request text itself.
- CPU, Reads, Writes, Duration - data on the cost of resources.
- StartTime, EndTime - start / end time. Convenient for sorting.
Add other columns to your taste.
By clicking the "Column Filters ..." button, you can open the event filter installation dialog. If you are interested in the activity of a particular user, set the filter by session number or username. Unfortunately, in the case of connecting the application through the app-server with the pool of connections, it is more difficult to track a specific user.
Filters can be used, for example, to select only "heavy" requests (Duration> X). Or requests that cause intensive writing (Writes> Y). Yes, even just the contents of the request.
What else do we need from the profiler? Of course the execution plan!
This possibility is available. You need to add the event "Performance \ Showplan XML Statistics Profile" to the trace. Fulfilling our request, we get about the following image.
Request text
Execution plan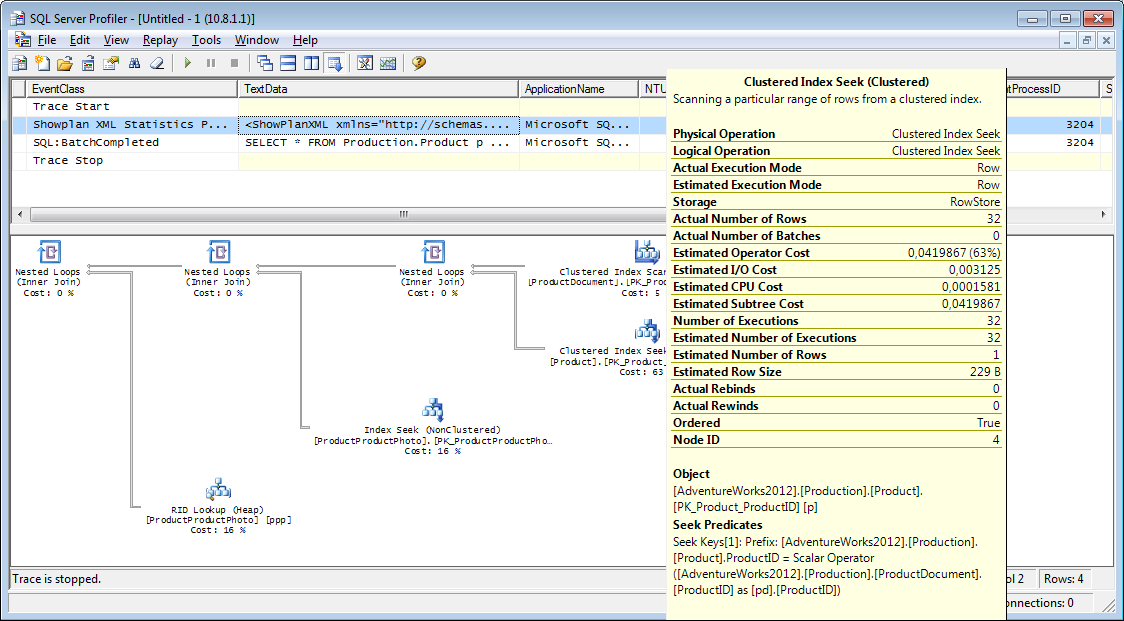
And that is not all
The route can be saved to a file or a database table (and not just display it on the screen).
Trace settings can be saved as a personal template for quick launch.
Tracing can also be performed without a profiler using t-sql code using the following procedures: sp_trace_create, sp_trace_setevent, sp_trace_setstatus, sp_trace_getdata. An example of how to do this. This approach can be useful, for example, to automatically start recording tracks to a file on a schedule. How exactly to use these commands, you can peek at the profiler. It is enough to run two traces and in one to track what happens when the second starts. Pay attention to the filter on the column "ApplicationName" - check that there is no filter on the profiler itself.
The list of events recorded by the profiler is very extensive and is not limited only to receiving query texts. There are events fixing fullscan, recompilation, autogrow, deadlock and more.
Analyzing the activity of users in the whole server
Life situations are also such when the information from the sections above does not help:
Some kind of query hangs on the "execution" for a very long time and it is unclear whether it will ever end or not. Analyze the problem request separately - I would like to - but you must first determine what kind of request. The profiler is useless to catch - we have already missed the starting event, and the completed one is unclear how long to wait.
Or maybe not a user request at all, or maybe the server itself is actively doing something ...
Let's understand
All of you probably saw "Activity Monitor". In older studios, its functionality has become richer. How can he help us? There is a lot of useful and interesting information in the Activity Monitor, but the third section is not about it. All we need is to get directly from the system views and functions (and the Monitor itself is useful because you can set a profiler on it and see what requests it performs).
We will need:
- sys.dm_exec_sessions - information about sessions. Displays information on connected users. Useful fields (within the framework of this article) - identifying the user (login_name, login_time, host_name, program_name, ...) and fields with information about the resources expended (cpu_time, reads, writes, memory_usage, ...)
- sys.dm_exec_requests - information about requests currently executing. There are also quite a few fields here, we will consider only a few:
- session_id - session code to communicate with the previous view
- start_time - request start time
- command - this field, contrary to the name, contains not the request, but the type of the command being executed. For user queries, this is usually something like select / update / delete /, etc. (also, important notes below)
- sql_handle, statement_start_offset, statement_end_offset - information for getting the query text: handle, as well as the starting and ending position in the query text - denoting the part currently being executed (for the case when your query contains several commands).
- plan_handle - the generated plan handle.
- blocking_session_id - when locks interfere with the execution of the request - indicates the session number that caused the blocking
- wait_type, wait_time, wait_resource - fields with information about the cause and duration of the wait. For some types of waiting, for example, data locking - the code of the blocked resource is additionally indicated.
- percent_complete - by name it is clear that this is the percentage of completion. Unfortunately, it is only available for commands that have clearly predictable progress (for example, backup or restore).
- cpu_time, reads, writes, logical_reads, granted_query_memory - resource usage.
- sys.dm_exec_sql_text (sql_handle | plan_handle) , sys.dm_exec_query_plan (plan_handle) - functions for retrieving text and a query plan. Below is an example of usage.
- sys.dm_exec_query_stats - aggregate statistics of execution by queries. Shows which query has been executed and how many resources have been spent on it.
Important notes
The above list is only a small part. A complete list of all system views and functions is described in the documentation . Also, there is a diagram of the links of the main objects in the form of a beautiful picture - you can print it on A1 and hang it on the wall.
The request text, its plan and execution statistics are the data stored in the procedural cache. At runtime, they are available. Once completed, accessibility is not guaranteed and depends on the pressure on the cache. Yes, you can clear the cache manually. Sometimes it is advised to do it when the execution plans “floated”, but there are a lot of nuances ... In general, “There are contraindications, it is recommended to consult with a specialist”.
The “command” field is practically meaningless for user requests - after all, we can get the full text ... But everything is not so simple. This field is very important for obtaining information about system processes. As a rule, they perform some internal tasks and do not have the text sql. For such processes, team information is the only hint at the type of activity. In the comments to the previous article there was a question about what the server is busy when, it seems, it should not be busy with anything - perhaps the answer will be in the meaning of this field. In my practice, the “command” field for active system processes always showed something quite understandable: autoshrink / autogrow / checkpoint / logwriter /, etc.
How to use it
Let's move on to the practical part. I will give a few examples of use, but do not limit your imagination. Server possibilities are not limited to this - you can invent something of your own.
Example 1: What process consumes cpu / reads / writes / memory
To begin with, let's see which sessions consume the most, for example, CPU. Information in sys.dm_exec_sessions. But data on CPU (and also reads, writes) - accumulative. That is, the number in the field contains "total" for all the time of connection. It is clear that the one who connected a month ago will most of all, but has never disconnected. This does not mean that he is loading the system right now.
A bit of code solves the problem, an algorithm like this:
- First, make a selection and save to a temporary table.
- then wait a bit
- do a second sample
- we compare the results of the first and second samples - the difference will be the costs incurred in step 2
- for convenience, the difference can be divided by the duration of paragraph 2, to get the average "cost per second."
Script example
if object_id('tempdb..#tmp') is NULL BEGIN SELECT * into #tmp from sys.dm_exec_sessions s PRINT ' ' -- , .. WAITFOR DELAY '00:00:01'; END if object_id('tempdb..#tmp1') is not null drop table #tmp1 declare @d datetime declare @dd float select @d = crdate from tempdb.dbo.sysobjects where id=object_id('tempdb..#tmp') select * into #tmp1 from sys.dm_exec_sessions s select @dd=datediff(ms,@d,getdate()) select @dd AS [ , ] SELECT TOP 30 s.session_id, s.host_name, db_name(s.database_id) as db, s.login_name,s.login_time,s.program_name, s.cpu_time-isnull(t.cpu_time,0) as cpu_Diff, convert(numeric(16,2),(s.cpu_time-isnull(t.cpu_time,0))/@dd*1000) as cpu_sec, s.reads+s.writes-isnull(t.reads,0)-isnull(t.writes,0) as totIO_Diff, convert(numeric(16,2),(s.reads+s.writes-isnull(t.reads,0)-isnull(t.writes,0))/@dd*1000) as totIO_sec, s.reads-isnull(t.reads,0) as reads_Diff, convert(numeric(16,2),(s.reads-isnull(t.reads,0))/@dd*1000) as reads_sec, s.writes-isnull(t.writes,0) as writes_Diff, convert(numeric(16,2),(s.writes-isnull(t.writes,0))/@dd*1000) as writes_sec, s.logical_reads-isnull(t.logical_reads,0) as logical_reads_Diff, convert(numeric(16,2),(s.logical_reads-isnull(t.logical_reads,0))/@dd*1000) as logical_reads_sec, s.memory_usage, s.memory_usage-isnull(t.memory_usage,0) as [mem_D], s.nt_user_name,s.nt_domain from #tmp1 s LEFT join #tmp t on s.session_id=t.session_id order BY cpu_Diff desc --totIO_Diff desc --logical_reads_Diff desc drop table #tmp GO select * into #tmp from #tmp1 drop table #tmp1 In the code I use two tables: #tmp - for the first sample, # tmp1 - for the second. When you first start, the script creates and fills #tmp and # tmp1 with an interval of one second, and does the rest. On subsequent launches, the script uses the results of the previous execution as a base for comparison. Accordingly, the duration of paragraph 2 on subsequent launches will be equal to the duration of your waiting between script launches. Try to perform, you can immediately on the working server - the script creates only "temporary tables" (available only within the current session and self-destruct when disconnected) and does not carry a danger.
Those who do not like to fulfill a request in the studio can wrap it in an application written in their favorite programming language. I will show how to do this in MS Excel without a single line of code.
In the menu "Data" connect to the server. If you want to choose a table - choose an arbitrary - then change it. As always, click “Next” and “Finish” until we see the “Import Data” dialog - in it you need to click “Properties ...”. In the properties it is necessary to change the “command type” to the value “SQL” and insert our slightly modified query into the field “command text”.
The request will have to be changed a bit:
- add "SET NOCOUNT ON" - because Excel does not like the cut-off number of lines;
- “Temporary tables” are replaced by “variable tables”;
- the delay will always be 1s - fields with averaged values are not needed
Modified Query for Excel
SET NOCOUNT ON; declare @tmp table(session_id smallint primary key,login_time datetime,host_name nvarchar(256),program_name nvarchar(256),login_name nvarchar(256),nt_user_name nvarchar(256),cpu_time int,memory_usage int,reads bigint,writes bigint,logical_reads bigint,database_id smallint) declare @d datetime; select @d=GETDATE() INSERT INTO @tmp(session_id,login_time,host_name,program_name,login_name,nt_user_name,cpu_time,memory_usage,reads,writes,logical_reads,database_id) SELECT session_id,login_time,host_name,program_name,login_name,nt_user_name,cpu_time,memory_usage,reads,writes,logical_reads,database_id from sys.dm_exec_sessions s; WAITFOR DELAY '00:00:01'; declare @dd float; select @dd=datediff(ms,@d,getdate()); SELECT s.session_id, s.host_name, db_name(s.database_id) as db, s.login_name,s.login_time,s.program_name, s.cpu_time-isnull(t.cpu_time,0) as cpu_Diff, s.reads+s.writes-isnull(t.reads,0)-isnull(t.writes,0) as totIO_Diff, s.reads-isnull(t.reads,0) as reads_Diff, s.writes-isnull(t.writes,0) as writes_Diff, s.logical_reads-isnull(t.logical_reads,0) as logical_reads_Diff, s.memory_usage, s.memory_usage-isnull(t.memory_usage,0) as [mem_Diff], s.nt_user_name,s.nt_domain from sys.dm_exec_sessions s left join @tmp t on s.session_id=t.session_id Process pictures

Result
When the data is in Excel, you can sort it as you need. To update the information - click "Update". For convenience, in the settings of the book, you can set “auto-update” after a specified period of time and “update on opening”. File can save and transfer to colleagues. Thus, we have collected a convenient and simple tool from
Example 2: What the session is spending resources on
So, in the previous example, we identified problem sessions. Now we define what they do. We use sys.dm_exec_requests, and also functions of obtaining the text and the plan of request.
Request text and plan by session number
DECLARE @sql_handle varbinary(64) DECLARE @plan_handle varbinary(64) DECLARE @sid INT Declare @statement_start_offset int, @statement_end_offset INT, @session_id SMALLINT -- - SELECT @sid=182 -- IF @sid IS NOT NULL SELECT @sql_handle=der.sql_handle, @plan_handle=der.plan_handle, @statement_start_offset=der.statement_start_offset, @statement_end_offset=der.statement_end_offset, @session_id = der.session_id FROM sys.dm_exec_requests der WHERE der.session_id=@sid -- DECLARE @txt VARCHAR(max) IF @sql_handle IS NOT NULL SELECT @txt=[text] FROM sys.dm_exec_sql_text(@sql_handle) PRINT @txt -- / IF @plan_handle IS NOT NULL select * from sys.dm_exec_query_plan(@plan_handle) -- / IF @plan_handle IS NOT NULL SELECT dbid, objectid, number, encrypted, CAST(query_plan AS XML) AS planxml from sys.dm_exec_text_query_plan(@plan_handle, @statement_start_offset, @statement_end_offset) Substitute the session number in the request and execute. After execution, there will be plans on the “Results” tab (two: the first for the entire request, the second for the current step - if there are several steps in the request), on the “Messages” tab - the query text. To view the plan - you need to click on the line on the text in the form of url. The plan will open in a separate tab. Sometimes it happens that the plan is not opened in graphic form, but in the form of xml-text. This is most likely due to the fact that the studio version is lower than the server. Try resaving the resulting xml to a file with the sqlplan extension, first deleting the “Version” and “Build” references from the first line, and then opening it separately. If this does not help, I remind you that 2016 studio is officially available for free on the MS website.
Pictures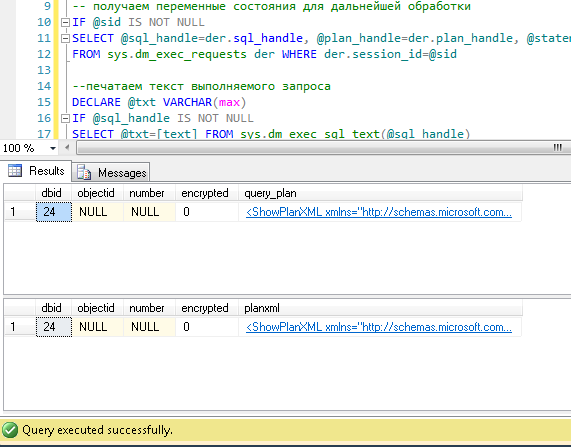

Obviously, the resulting plan will be "estimated", because The request is still running. But you can still get some statistics on execution. We use the sys.dm_exec_query_stats view with a filter by our handles.
We add to the end of the previous query
-- IF @sql_handle IS NOT NULL SELECT * FROM sys.dm_exec_query_stats QS WHERE QS.sql_handle=@sql_handle After execution, in the results we will receive information about the steps of the executed query: how many times they were executed and what resources were spent.Information in the statistics gets after execution - when you first run there, unfortunately, is empty. Statistics is not tied to the user, but is maintained throughout the entire server — if different users execute the same query — the statistics will be summary for all.
Example 3: And you can see all
Let's combine the system views and functions discussed in one request. This can be convenient for assessing the overall situation.
-- SELECT LEFT((SELECT [text] FROM sys.dm_exec_sql_text(der.sql_handle)),500) AS txt --,(select top 1 1 from sys.dm_exec_query_profiles where session_id=der.session_id) as HasLiveStat ,der.blocking_session_id as blocker, DB_NAME(der.database_id) AS , s.login_name, * from sys.dm_exec_requests der left join sys.dm_exec_sessions s ON s.session_id = der.session_id WHERE der.session_id<>@@SPID -- AND der.session_id>50 The request displays a list of active sessions and the texts of their requests. For system processes, I recall, usually the request is absent, but the “command” field is filled. Visible information about locks and waits. You can try to cross this query with example 1, and also sort by load. But be careful - the texts of the requests can be very large. Choosing them massively can be resource intensive. Yes, and traffic will be great. In the example, I limited the received request to the first 500 characters, but did not begin to make a plan.
Examples of requests laid out on githab .
Conclusion
It would still be nice to get Live Query Statistics for an arbitrary session. According to the manufacturer, at the moment, the constant collection of statistics requires significant resources and therefore, by default, is disabled. The inclusion is not a problem, but additional manipulations complicate the process and reduce the practical benefits. Perhaps we will try to do this in a separate article.
In this part, we reviewed the analysis of user actions. We tried several ways: using the capabilities of the studio itself, using the profiler, as well as direct access to system views. All these methods allow us to estimate the cost of executing the request and get the execution plan. There is no need to be limited to one of them - each method is convenient in its situation. Try to combine.
We still have an analysis of the load on memory and the network, as well as other nuances. Let's get to them. Material for a few articles.
Thanks to Vlad for help in creating the article.
Source: https://habr.com/ru/post/336586/
All Articles