Using the Chrome profiler frontend in your own projects
You may know that Google Chrome has a built-in profiler . But even from those people who saw it, the majority believes that it can only be used for debugging Javascript or drawing frames in the browser. But in fact, it can be quite simply screwed as a means of visualizing profiling data in your project.
I will not reveal any unique secrets here, for example, Colt McAnlis wrote about the similar use of the Chrome profiler in game projects back in 2012 . Everything written there is still true, and I will write one more material - just for better dissemination of knowledge about such a useful tool.
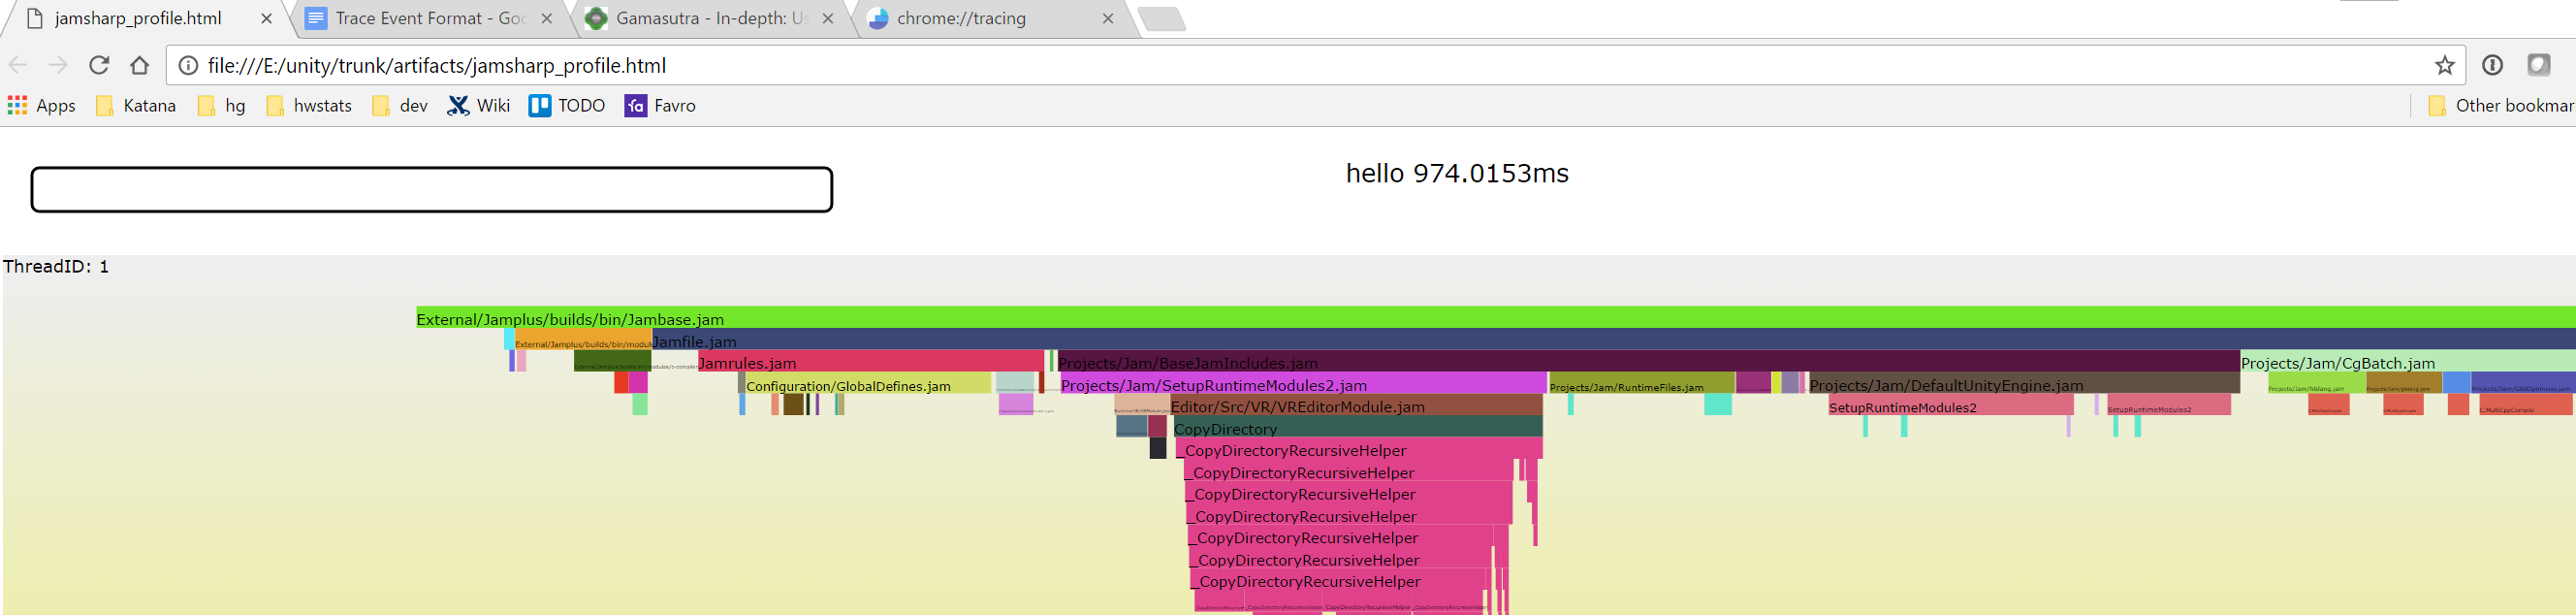
For some part of our code-building system, we once wrote a simple profiler (called TinyProfiler). It is rather trivial - it measures the execution time of certain blocks of code and creates a set of HTML + SVG files that visualize this data in the style of flame-graphs :
')
This, in principle, worked well, but the resulting HTML was not very interactive. It was possible to bring the mouse to a specific block and see its name in the tooltip, but that’s all the amenities and ended. There was no zoom, no filtering, no scrolling, no search - in general, nothing that I would like to receive from a more or less professional tool. All this could, of course, sit down and write, but ... why do it if you can not do this? After all, there is already someone (Chrome developers) who have already done all this.
All we have to do is:
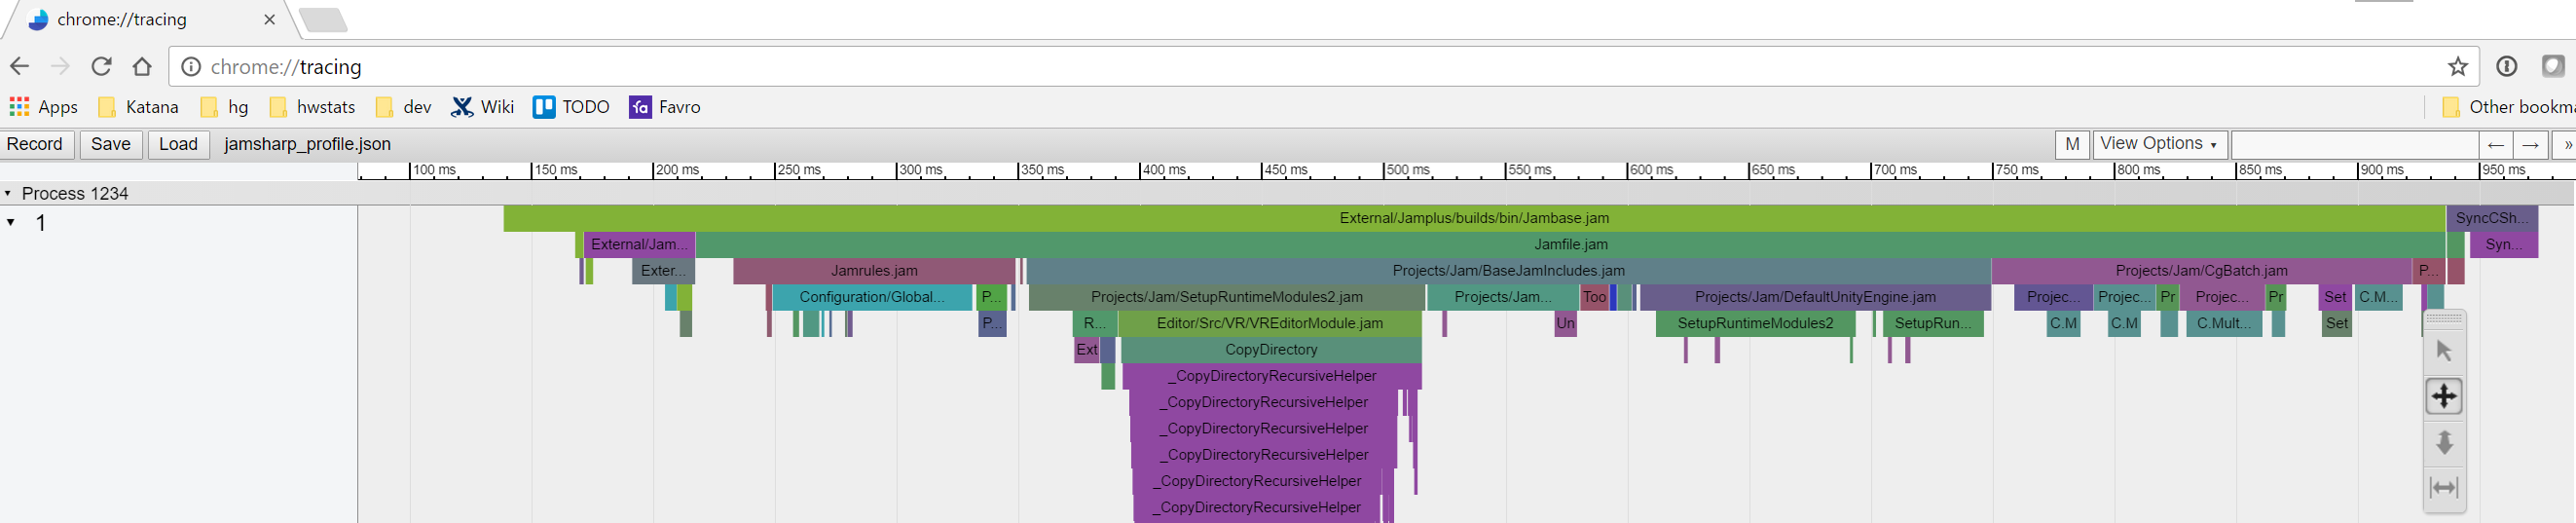
The result is visually quite similar to the picture of our mini profiler:
The advantages of this approach:
But there are a few drawbacks:
It seems to me that the advantages outweigh the disadvantages.
This format is quite simple in and of itself, and is well documented . The basic structure looks like this:
traceEvents are the events that will be shown in the UI. Anything that is not an event is considered “metadata” that will be displayed in the metadata dialog (in this case, meta_user and meta_cpu_count). The above JSON file will look like this in Chrome Tracing:
The events that are described in it are quite simple. They are called “completed” (type ph: X) - for their description we will need to specify the start time and the duration in microseconds (attributes ts and dur). The attributes of the process ID and thread ID, as well as the name of the event are specified. There is no need to specify the parent-child relationship - the UI will determine it itself based on the start time and duration of each event.
You can also attach some data to the events (the args attribute), which, when you select this event, will be displayed in the bottom panel. There is a small nuance - in order for an event to be chosen at all, it must have non-empty args. That is, at least something (even if unnecessary) is better to put there. You can not think of anything - duplicate the event duration there (perhaps converting it from microseconds to milliseconds or seconds).
That's all that I wanted to tell you about the basic use of this tool. Perhaps the article turned out to be somewhat rustic - but this is because the tool itself is simple and convenient. For advanced uses, read the documentation . Successful profiling.
I will not reveal any unique secrets here, for example, Colt McAnlis wrote about the similar use of the Chrome profiler in game projects back in 2012 . Everything written there is still true, and I will write one more material - just for better dissemination of knowledge about such a useful tool.
Prehistory
For some part of our code-building system, we once wrote a simple profiler (called TinyProfiler). It is rather trivial - it measures the execution time of certain blocks of code and creates a set of HTML + SVG files that visualize this data in the style of flame-graphs :
')
This, in principle, worked well, but the resulting HTML was not very interactive. It was possible to bring the mouse to a specific block and see its name in the tooltip, but that’s all the amenities and ended. There was no zoom, no filtering, no scrolling, no search - in general, nothing that I would like to receive from a more or less professional tool. All this could, of course, sit down and write, but ... why do it if you can not do this? After all, there is already someone (Chrome developers) who have already done all this.
Using Chrome Tracing
All we have to do is:
- Create a JSON file of a specific format containing data about the events being profiled
- Open chrome in chrome: // tracing
- Drag JSON file to this page
The result is visually quite similar to the picture of our mini profiler:
The advantages of this approach:
- Significantly improved UI: zoom, scrolling, filtering, statistics, etc.
- We no longer need to write our (even if simple) code for the UI
- Significantly simplified data collection and processing code (JSON is easier to create than SVG)
But there are a few drawbacks:
- There is no easy way to click on the report file to open it. Chrome does not allow you to open files with trace data from the command line. It is necessary to open the chrome: // tracing page every time and only to open the necessary file from it.
- This can be corrected if you take the trace2html utility from the Chrome repository - it can create ready-made HTML with everything you need. But for this you have to pull down to yourself, store and collect 1 GB of sources (there is not only this utility there). And this is somehow too much for a similar task. Perhaps, it would be possible to cut out from the repository only what is needed to build this utility - but this would take time, and even with further compatibility support, problems would arise.
- We are tied to another third-party tool. However, it seems to be fairly stable (for example, the 2012 article mentioned above is still literally true in 2017), is open, and some serious tools (like Facebook Buck ) are already using it.
It seems to me that the advantages outweigh the disadvantages.
JSON file format
This format is quite simple in and of itself, and is well documented . The basic structure looks like this:
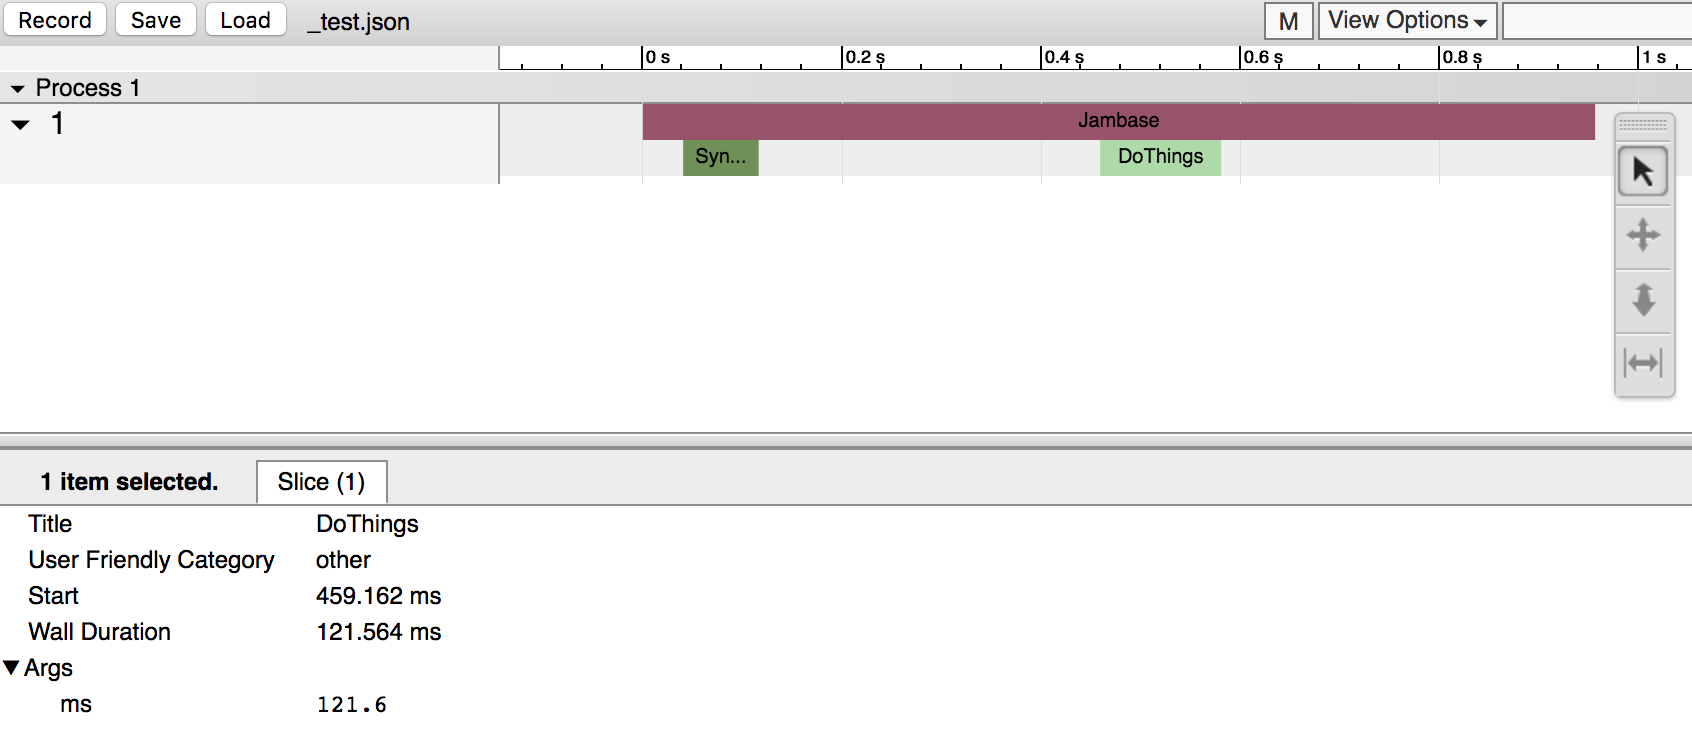
{ "traceEvents": [ { "pid":1, "tid":1, "ts":87705, "dur":956189, "ph":"X", "name":"Jambase", "args":{ "ms":956.2 } }, { "pid":1, "tid":1, "ts":128154, "dur":75867, "ph":"X", "name":"SyncTargets", "args":{ "ms":75.9 } }, { "pid":1, "tid":1, "ts":546867, "dur":121564, "ph":"X", "name":"DoThings", "args":{ "ms":121.6 } } ], "meta_user": "aras", "meta_cpu_count": "8" } traceEvents are the events that will be shown in the UI. Anything that is not an event is considered “metadata” that will be displayed in the metadata dialog (in this case, meta_user and meta_cpu_count). The above JSON file will look like this in Chrome Tracing:
The events that are described in it are quite simple. They are called “completed” (type ph: X) - for their description we will need to specify the start time and the duration in microseconds (attributes ts and dur). The attributes of the process ID and thread ID, as well as the name of the event are specified. There is no need to specify the parent-child relationship - the UI will determine it itself based on the start time and duration of each event.
You can also attach some data to the events (the args attribute), which, when you select this event, will be displayed in the bottom panel. There is a small nuance - in order for an event to be chosen at all, it must have non-empty args. That is, at least something (even if unnecessary) is better to put there. You can not think of anything - duplicate the event duration there (perhaps converting it from microseconds to milliseconds or seconds).
That's all that I wanted to tell you about the basic use of this tool. Perhaps the article turned out to be somewhat rustic - but this is because the tool itself is simple and convenient. For advanced uses, read the documentation . Successful profiling.
Source: https://habr.com/ru/post/336584/
All Articles