As a rule of thumb, “winner takes all” works and does not work in development.
I propose a revised version of my speech at the developers conference, in which I decided to distract from technology frameworks and speculate on compatibility in development.

Under the cut slides with an explanation.
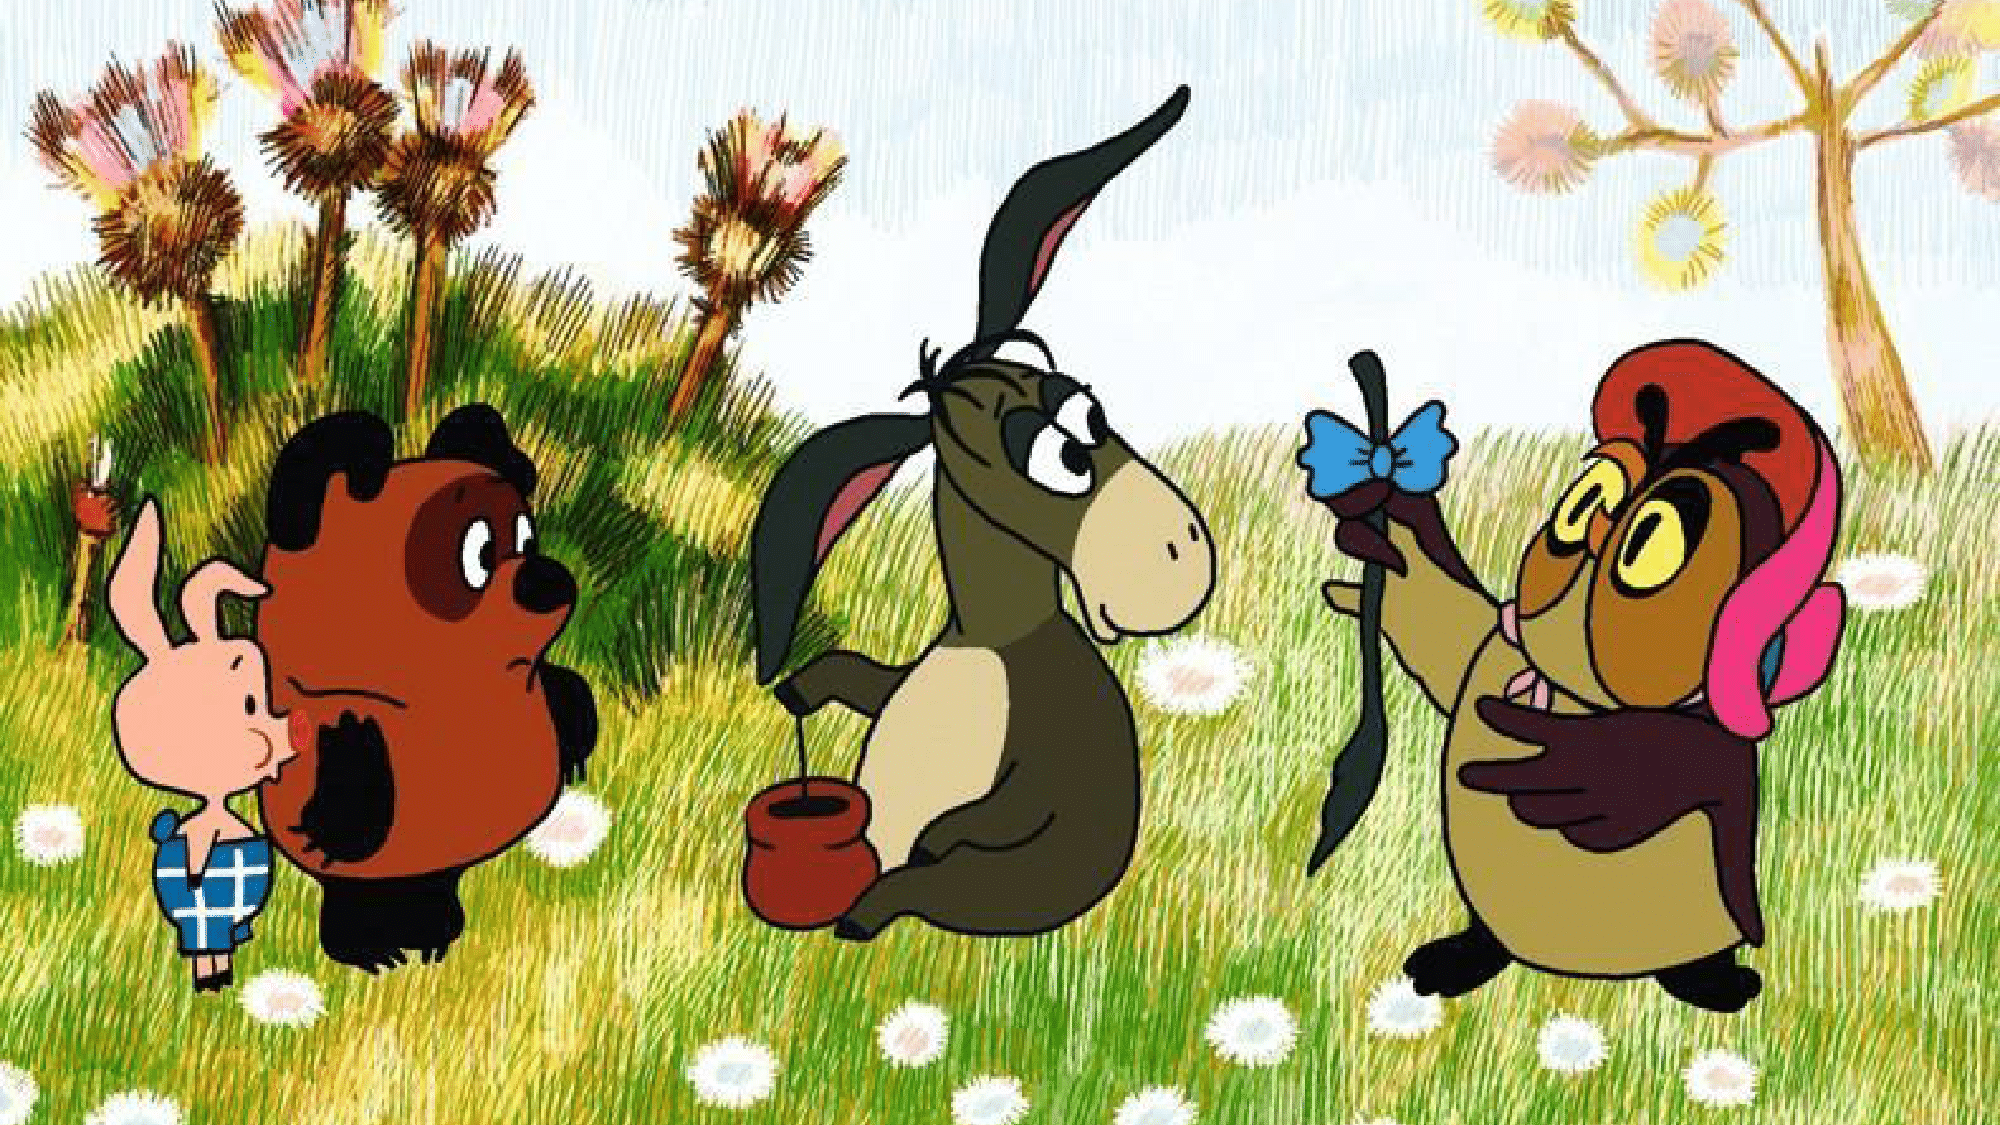
In childhood, our perceptions are especially deceptive. I remember, walking past the clock tower, I was very surprised when my father said that the length of the arrow is equal to five steps. What is it like? Then it seemed that all the things around us were about the same size. Then the cartoons were such as Winnie the Pooh. Indeed, it is now difficult to imagine an owl, the size of a bear.
')
Then, when we grow up to develop a love for the natural sciences, we are given a book about the planets. You can believe this kind of book exists in all languages in almost all countries.
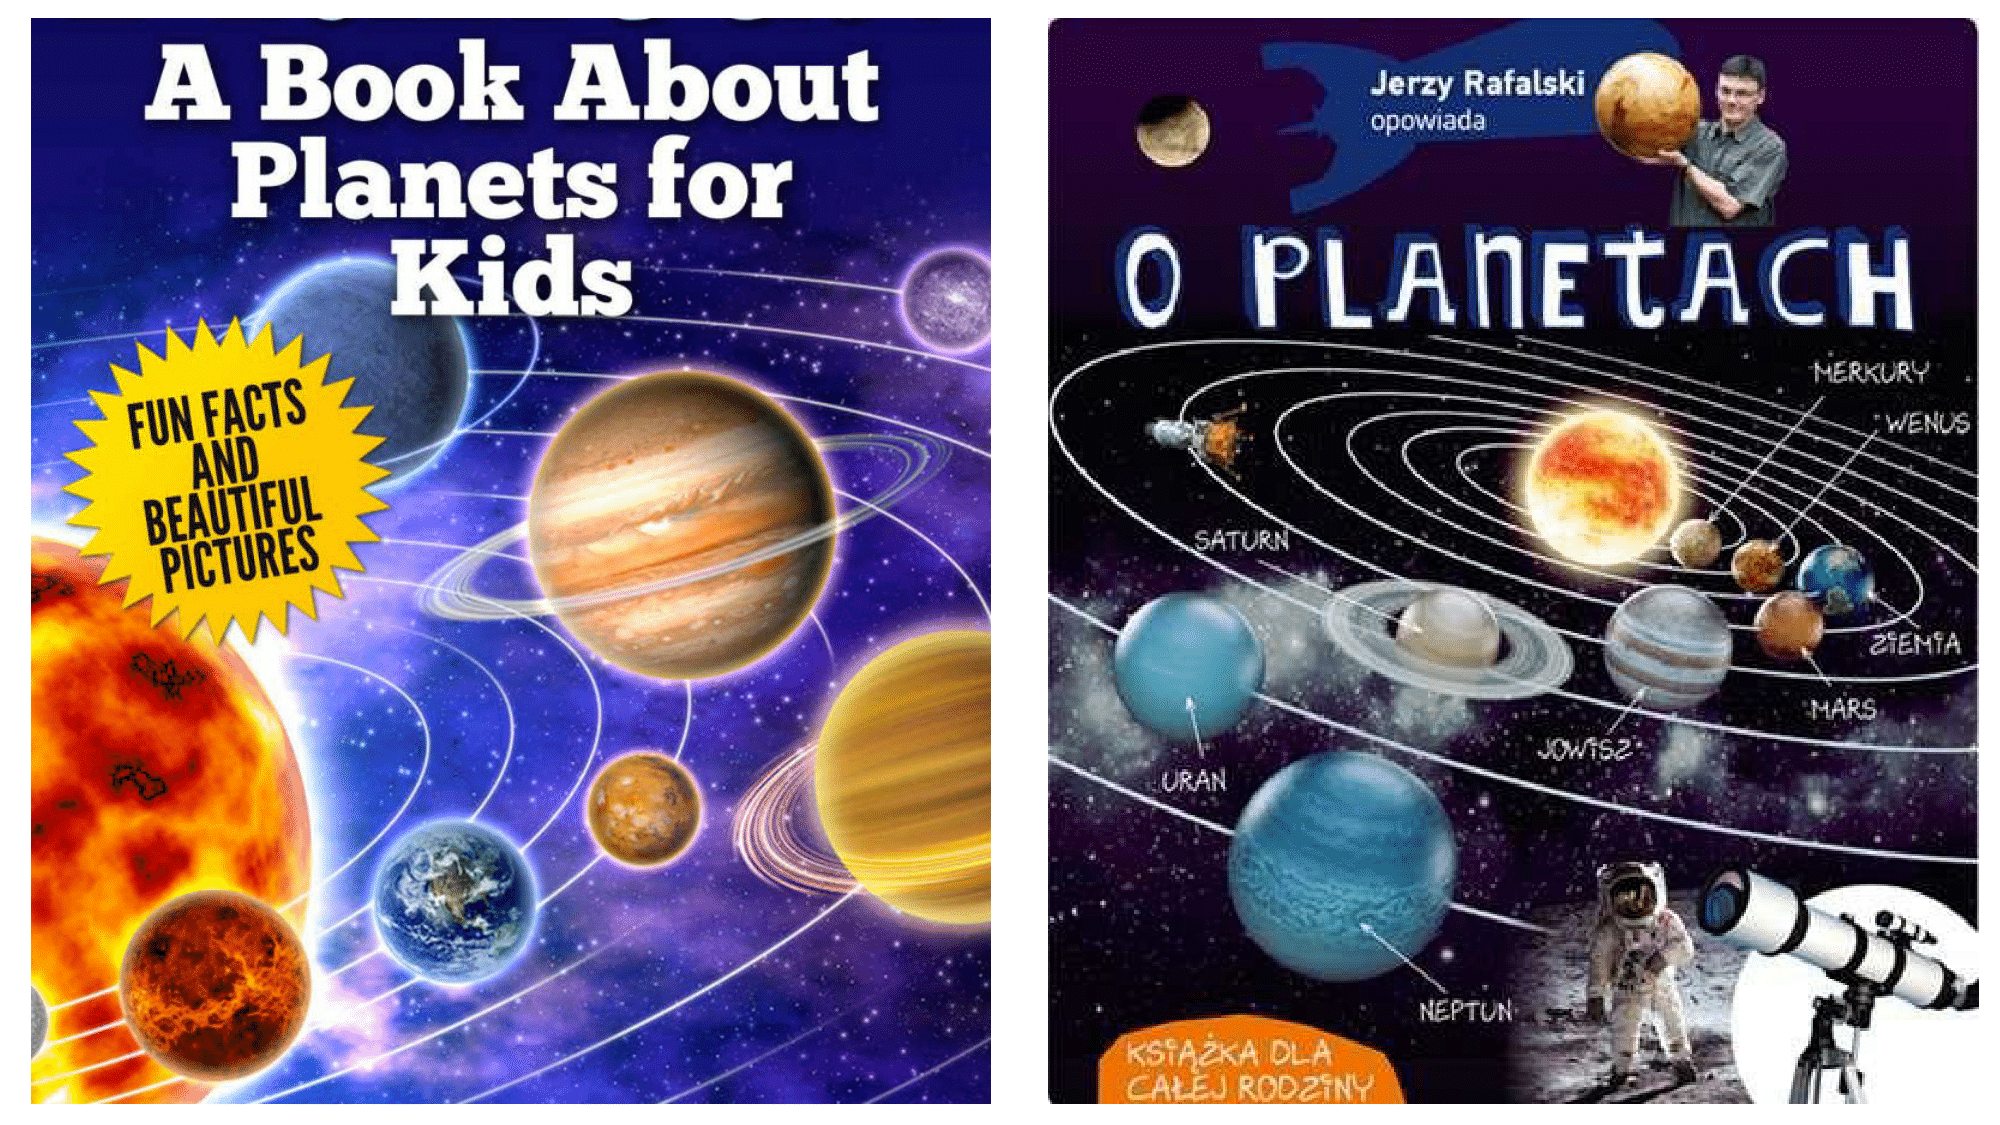
Looking at the cover, you might think that all the planets are approximately of comparable size and if they differ from each other, then by percentages, and not by several times or even by several orders of magnitude.
And now let's see how comparable in size the planets in our system really are.

It is so that in a single scale it is impossible to depict all the planets together so that at least the red color of Mars was visible and it was clear that Jupiter is 300+ times larger than the Earth, with 1000 times smaller than the Sun. In this scheme, the distances from the Sun are not taken into account, if the Earth is left at such a distance, then the screen is clearly not enough for Uranus, and Neptune will already be in another room.
By the way, the ancient Greeks did not know about the dimensions of the planets, but they had a legend, as Zeus (Jupiter in a new way) competed with ALL the other gods. They drew the gold chain and Zeus won, that is, he is stronger than all of them together, but not omnipotent. That much later, physicists and astronomers showed. It seems that these were the giants on whose shoulders Newton stood.
The children's habit of seeing in front of them something comparable, brings unjustified, to say the least, results. In real life, we see how the population and area of countries, the population of cities, astronomical objects, population spending, income by industry, and much more, are also distributed. The most important thing for us now is that almost all the observations in our work are distributed as well. Now we will consider an example with cats. We will find in the instagram images with the tag # catphoto.

Instagram after processing processes images, leading them to the size of 640X640 pixels, compressing the jpeg format. It seems that after this all the images should occupy approximately the same size, and if they are different, then not by several times, but by several percent. And now, look at the size of the photos.

It can be seen that the size of the largest file is 2.5 times different from the smallest. Even more “dramatic” is the situation when we begin to look at files of different types, but, for example, belonging to the same project. This is what a very rich company page load profiler looks like.
Here the downloaded files are sorted by size. And immediately you will notice that 5 files take up more size than the 180 remaining ones. If it seems to you that this is a special site, then try clearing the cache, load any site and make sure that 5% of the largest files take up more space than 50% of the smallest for almost any site.
Want to tell about the average (conditionally your) project. There is a database on the project, in which there are 30 - 90 tables, in the two largest lines there are more than half of the smallest ones. The repository contains thousands of code files, 1% of the largest of which takes up more space than 50% of the smallest. There is a site that loads a few seconds, and during this time 80 - 300 files are loaded, of which again 1% of the largest takes up more space than 50% of the smallest. I can also tell you about the files on your computer. In the Downloads folder (unless it is regularly cleaned), the two largest files take up more space than half the smallest ones.
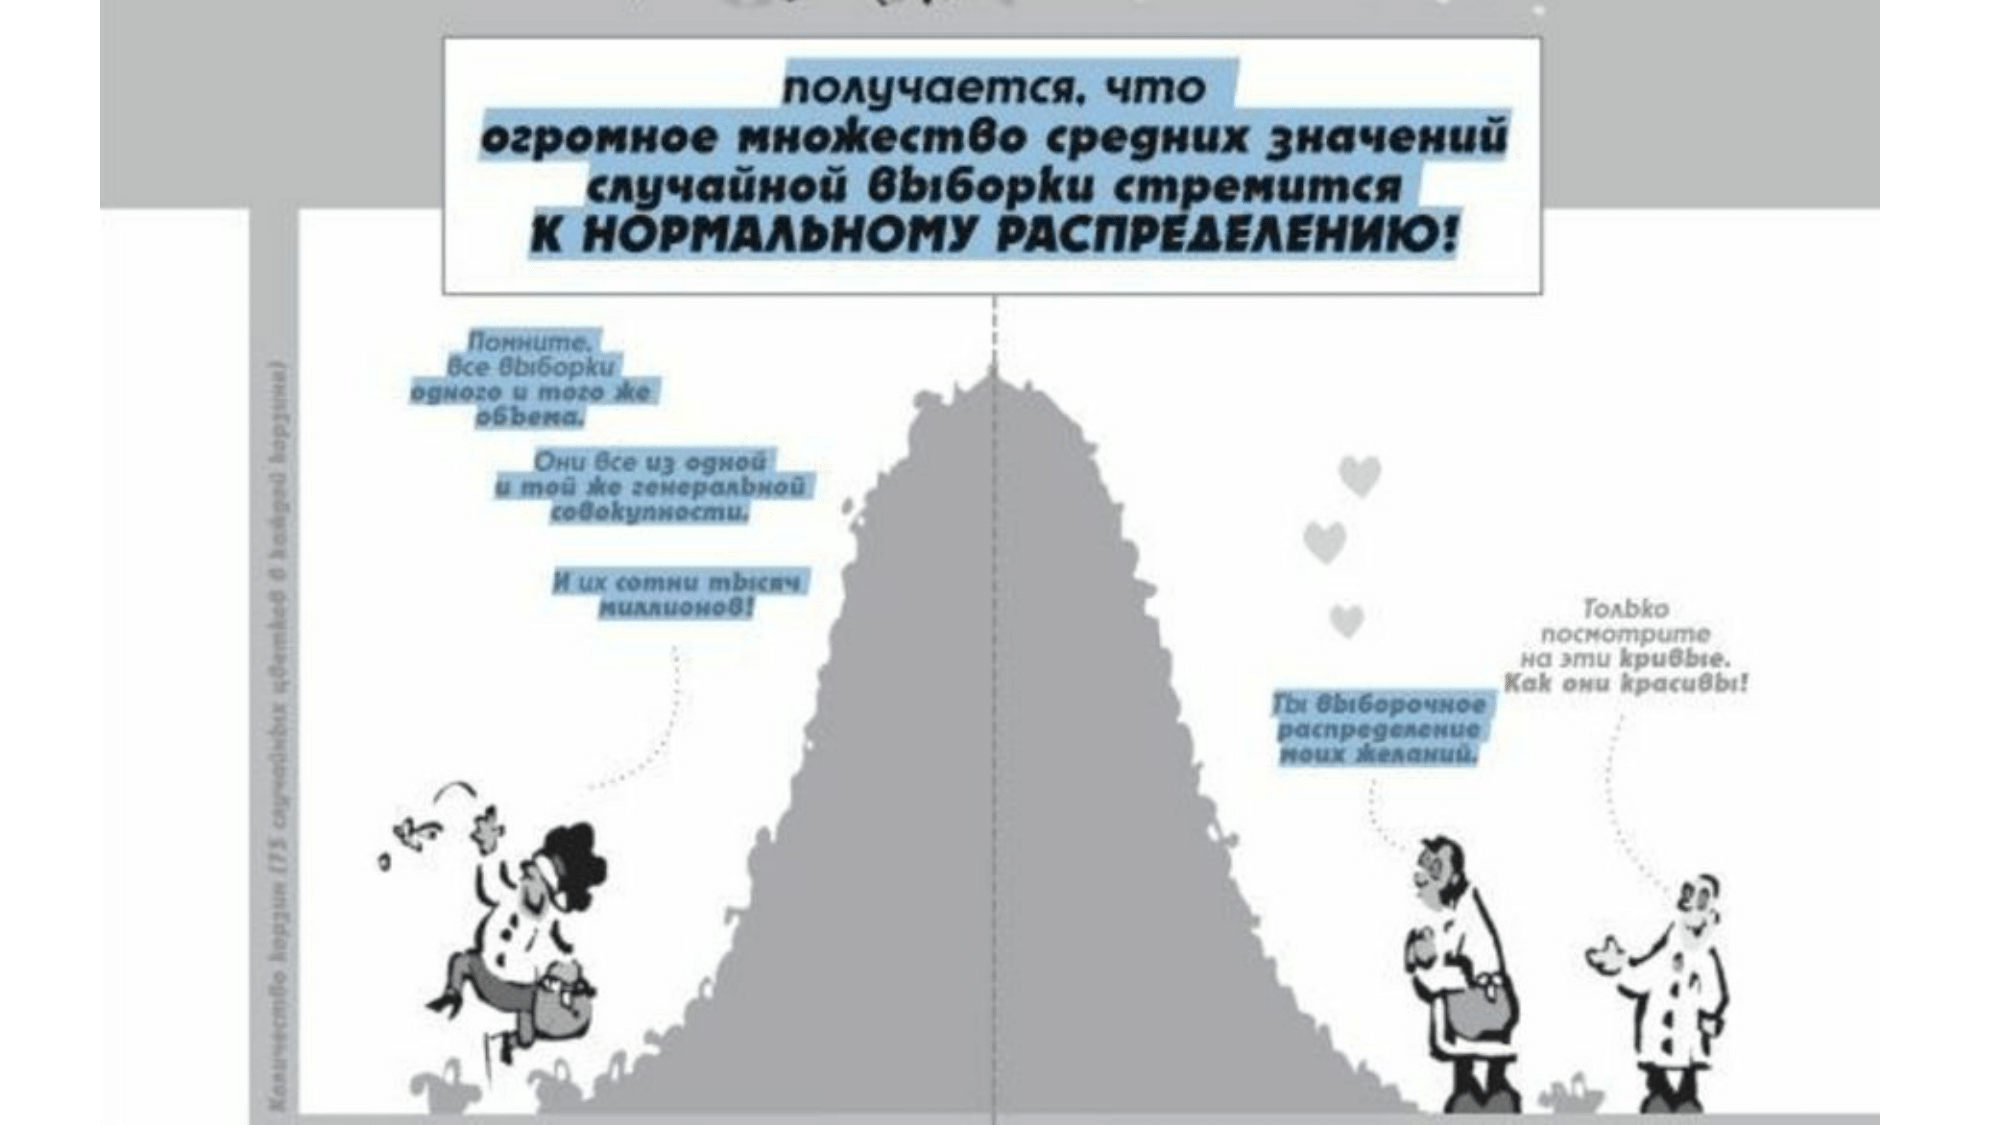
However, the habits of observation of the outside world and the central limit theorem of the theory of probability lead to the fact that when working with a very large number of observations, the averaged result should not converge to some value that is not very different from the average. About this, even comics are, unfortunately, with omitted necessary conditions.
Long observations of measurable data in telecommunications and engineering led me to the conclusion that it was almost impossible to meet the normal distribution. What happens in reality.

Observed values have outliers. These are such observations that clearly deviate from the total mass ( tyts ). If we recall the statistics, then when processing the results of the experiment, such values can be discarded. In our case, they are too important and they must be taken into account.
Also, these observations have significant asymmetry and a heavy tail .
There are many explanations for this phenomenon, among which there are contradictory ones, so that we will not waste time trying to figure them out. It is simply obvious that the distributions under consideration have no variance, and therefore the condition of the CLT is not satisfied.

Do not take the picture too seriously. Let's better think about what can be done with this. And what to do is clear: optimize. That is, it is necessary to optimize the size of the files, the number of function calls, the page load time, that is, all that takes the resources that have the best use.
And now is the time to tell about the key and most famous phrase from computer science related to optimization.
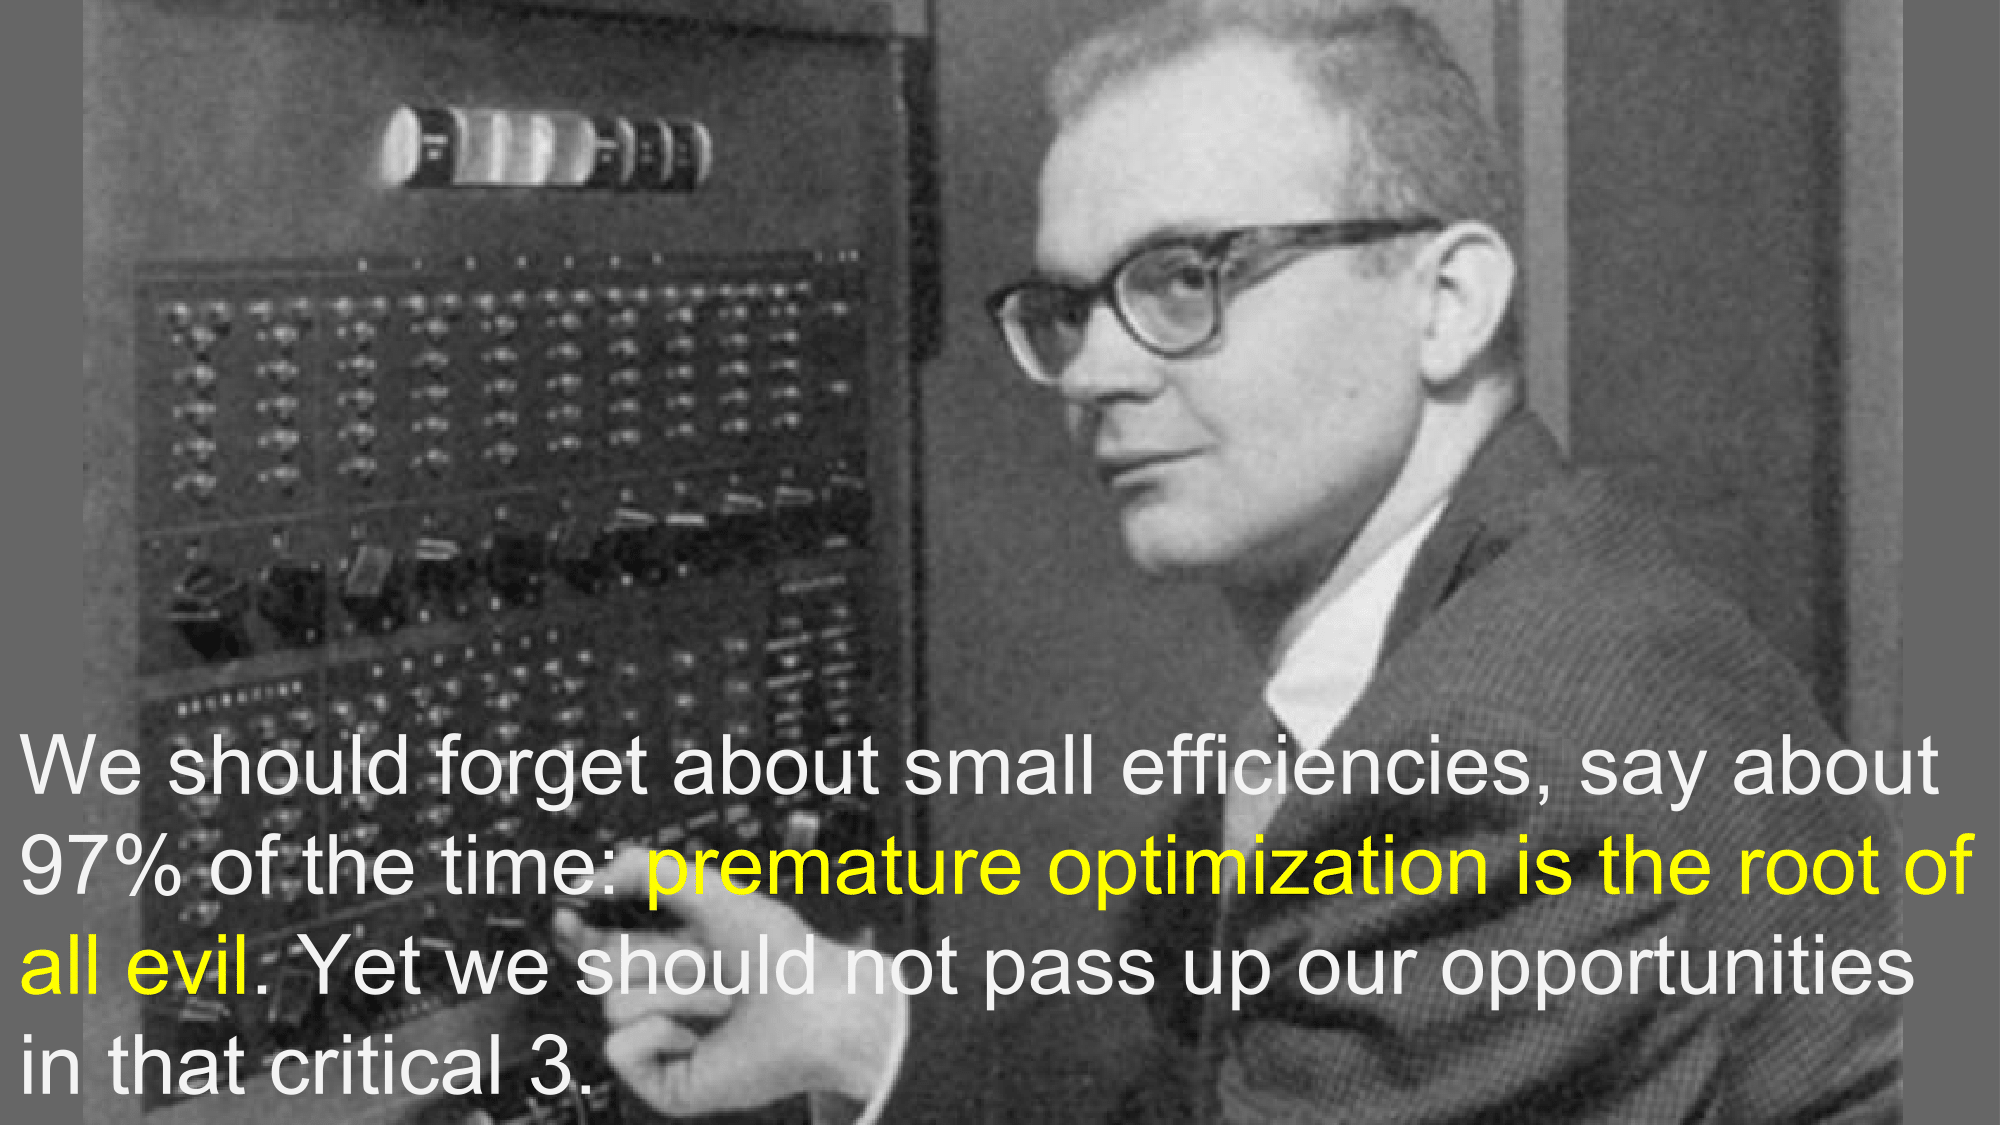
I specifically found the image of a young Donald Knut, since this phrase was already said back in 1974 and has so many interpretations that even Knut himself repeatedly explained (how funny: not a method in the interface, but a whole phrase has polymorphism). Yes, premature optimization is the root of all ills . In 97% of cases it will not lead to anything. But the remaining 3% can not be discounted.
In those old times, when there were no convenient profilers, IDE, iPhones, browsers, Internet, personal computers, OOP, and the total power of all computers in the world was equal to several modern smartphones. Even then, in a discussion article with Dykstra on the applicability of GO TO in structured programming, Knut remarked that in most cases optimization does not produce results, but rather takes the time and makes the code less readable.
And now a more illustrative example. But we are already armed with technologies and can see what optimization the site is offered by the automatic utility PageSpeed from Google (I chose the sinopec group, as one of the richest in the world, should be on the site).

So, the total size of the site when loading 2.1M, and the utility finds that you can compress styles, from which to win 9.2K. That is less than half a percent. You have to agree that the end user will not notice such optimization, and it will not create problems with loading and transportation.
And what then to optimize? Let's take a look at another profiler page for a change.

There is no longer file size, but performance. That is, how much time was spent on the execution of functions in the application for a short period of time, and then sorted by this very time. The picture contains 12 functions from 600+, taking into account the large font. As always, one percent of the most costly functions consume more resources than 50% of the most non-cost. So, when optimizing performance, seeing such a table will never hide it further - without optimizing anything from the first 3 to 8 functions, the visible improvement will not come. Such a simple truth, but because of its misunderstanding, it takes a lot of time.
And now the second important point related to this, which is no longer so obvious. I came to this conclusion by observing several years of various statistics in IT, just as Kliment Timiryazev had been watching the leaves in flasks for years. You will not be able to reduce the real project to a state where the allocation of resources will be normal or at least comparable. No number of iterations of optimization. A well-optimized project will still have the distribution of the execution time of functions as shown in the picture above, only the total time for their execution after optimization will be noticeably lower.
<humor> That is, our Sun- like dream to normalize IT people is not possible mathematically. </ humor>
This is all on the main report. Now a small bonus on the topic of "who is to blame," that is, the theoretical part. All the distributions observed in the article do not satisfy the CLT due to the absence of dispersion, but still there is a general form of the distribution laws for them. These are stable distributions associated with Levi-Khinchin representations. The theory of such distributions is well studied in finance, theory of physics, demography. According to my observations, it fits perfectly in IT. Moreover, she entered computer science together with the name of Mandelbrot, who was a student of the aforementioned Levi and, by studying processes with infinite variance, discovered fractals. Notice how beautiful it is, a fractal can be not just a picture or a data structure, like a tree of folders and files, but also a statistical data set. Further, these distributions obey the Benford law, acquaintance with which simply will not allow you to calmly look at the sets of numbers (as, for example, in the above screenshots of the profilers, where it is obvious). And this is not all; fans of pure mathematics in these distributions will find use of fractional derivatives, the method of characteristic function, method of moments (the two Laplace and Chebyshev discovered by studying such distributions), signal conversion and much more. What I have already written about in previous articles or else I will write in future ones.
Under the cut slides with an explanation.
In childhood, our perceptions are especially deceptive. I remember, walking past the clock tower, I was very surprised when my father said that the length of the arrow is equal to five steps. What is it like? Then it seemed that all the things around us were about the same size. Then the cartoons were such as Winnie the Pooh. Indeed, it is now difficult to imagine an owl, the size of a bear.
')
Then, when we grow up to develop a love for the natural sciences, we are given a book about the planets. You can believe this kind of book exists in all languages in almost all countries.
Looking at the cover, you might think that all the planets are approximately of comparable size and if they differ from each other, then by percentages, and not by several times or even by several orders of magnitude.
And now let's see how comparable in size the planets in our system really are.
It is so that in a single scale it is impossible to depict all the planets together so that at least the red color of Mars was visible and it was clear that Jupiter is 300+ times larger than the Earth, with 1000 times smaller than the Sun. In this scheme, the distances from the Sun are not taken into account, if the Earth is left at such a distance, then the screen is clearly not enough for Uranus, and Neptune will already be in another room.
By the way, the ancient Greeks did not know about the dimensions of the planets, but they had a legend, as Zeus (Jupiter in a new way) competed with ALL the other gods. They drew the gold chain and Zeus won, that is, he is stronger than all of them together, but not omnipotent. That much later, physicists and astronomers showed. It seems that these were the giants on whose shoulders Newton stood.
The children's habit of seeing in front of them something comparable, brings unjustified, to say the least, results. In real life, we see how the population and area of countries, the population of cities, astronomical objects, population spending, income by industry, and much more, are also distributed. The most important thing for us now is that almost all the observations in our work are distributed as well. Now we will consider an example with cats. We will find in the instagram images with the tag # catphoto.
Instagram after processing processes images, leading them to the size of 640X640 pixels, compressing the jpeg format. It seems that after this all the images should occupy approximately the same size, and if they are different, then not by several times, but by several percent. And now, look at the size of the photos.
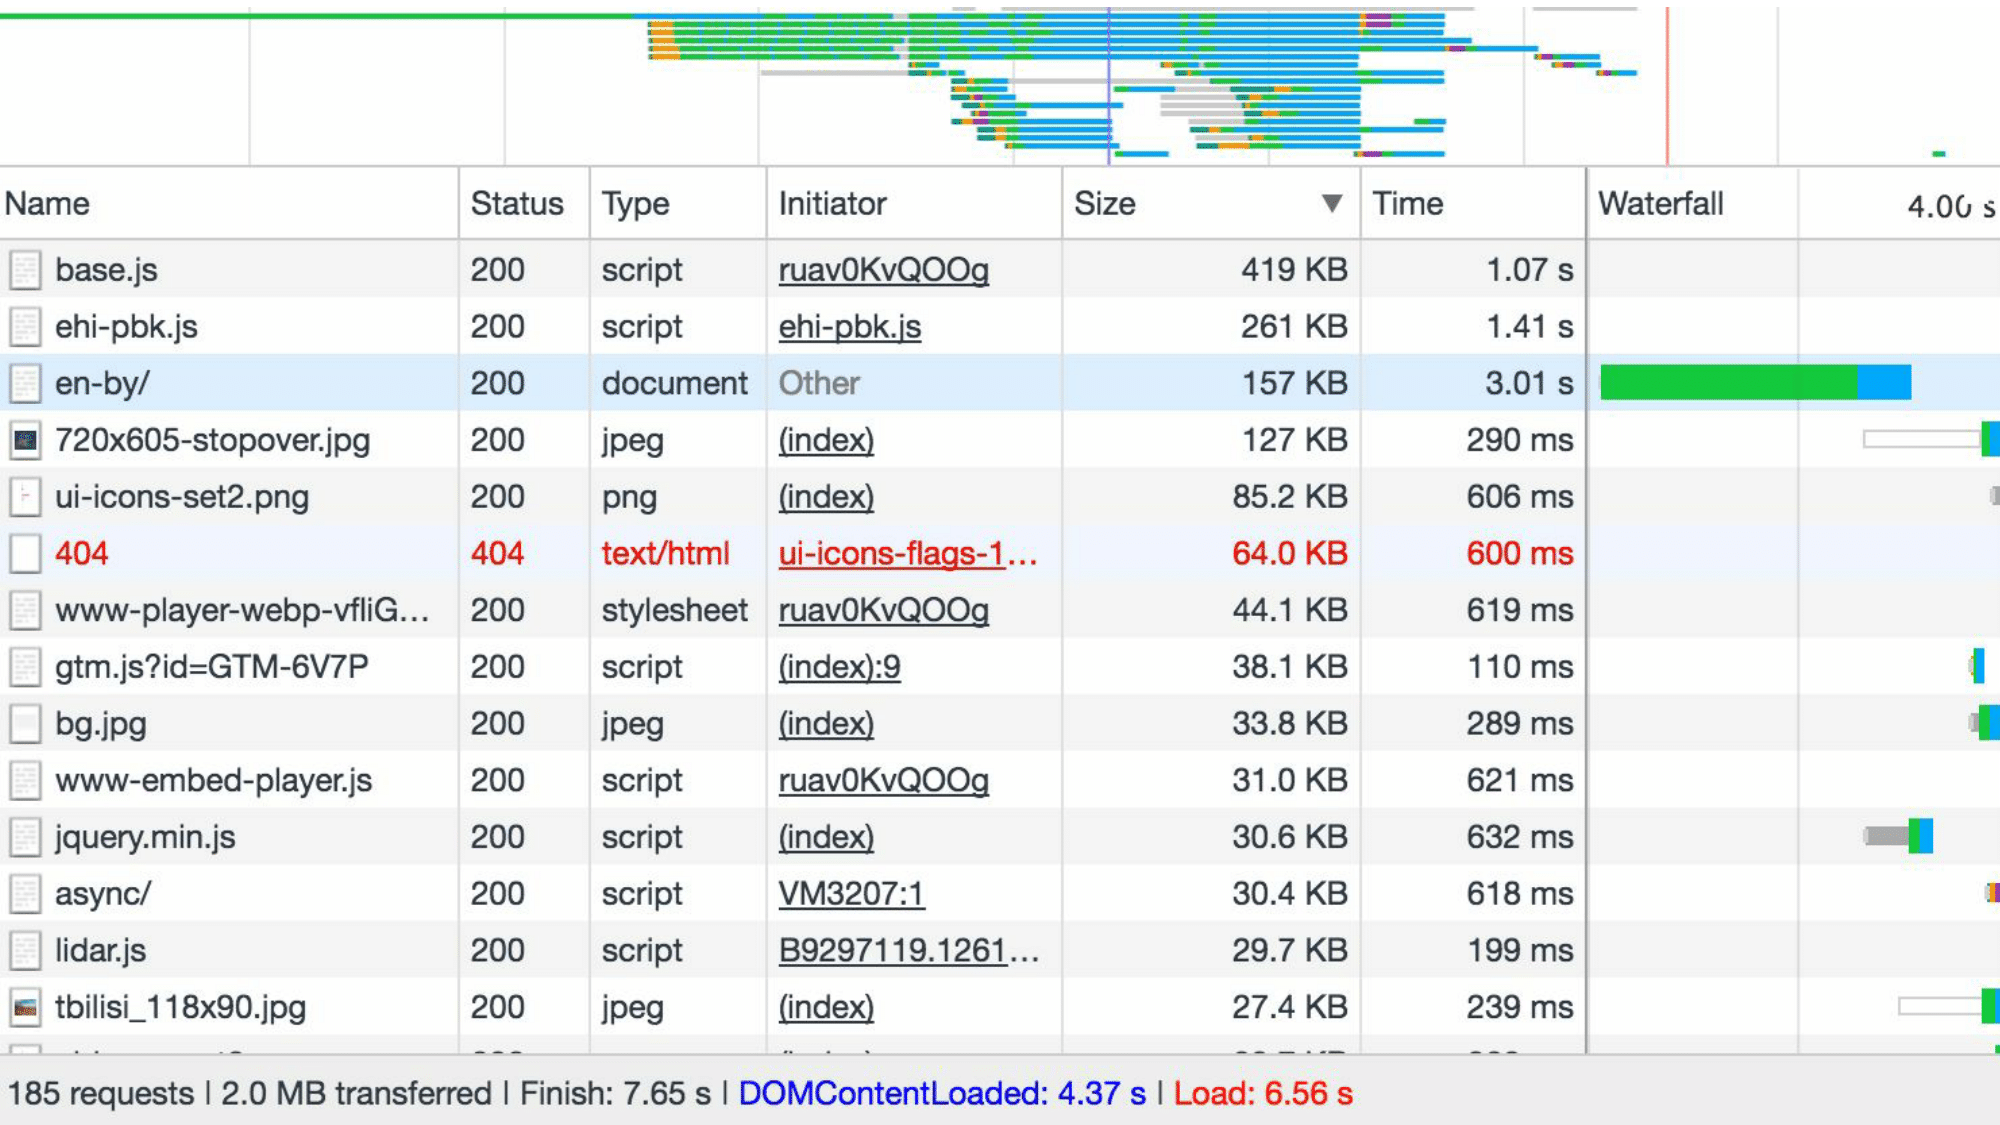
It can be seen that the size of the largest file is 2.5 times different from the smallest. Even more “dramatic” is the situation when we begin to look at files of different types, but, for example, belonging to the same project. This is what a very rich company page load profiler looks like.
Here the downloaded files are sorted by size. And immediately you will notice that 5 files take up more size than the 180 remaining ones. If it seems to you that this is a special site, then try clearing the cache, load any site and make sure that 5% of the largest files take up more space than 50% of the smallest for almost any site.
Want to tell about the average (conditionally your) project. There is a database on the project, in which there are 30 - 90 tables, in the two largest lines there are more than half of the smallest ones. The repository contains thousands of code files, 1% of the largest of which takes up more space than 50% of the smallest. There is a site that loads a few seconds, and during this time 80 - 300 files are loaded, of which again 1% of the largest takes up more space than 50% of the smallest. I can also tell you about the files on your computer. In the Downloads folder (unless it is regularly cleaned), the two largest files take up more space than half the smallest ones.
However, the habits of observation of the outside world and the central limit theorem of the theory of probability lead to the fact that when working with a very large number of observations, the averaged result should not converge to some value that is not very different from the average. About this, even comics are, unfortunately, with omitted necessary conditions.
Long observations of measurable data in telecommunications and engineering led me to the conclusion that it was almost impossible to meet the normal distribution. What happens in reality.
Observed values have outliers. These are such observations that clearly deviate from the total mass ( tyts ). If we recall the statistics, then when processing the results of the experiment, such values can be discarded. In our case, they are too important and they must be taken into account.
Also, these observations have significant asymmetry and a heavy tail .
There are many explanations for this phenomenon, among which there are contradictory ones, so that we will not waste time trying to figure them out. It is simply obvious that the distributions under consideration have no variance, and therefore the condition of the CLT is not satisfied.
Do not take the picture too seriously. Let's better think about what can be done with this. And what to do is clear: optimize. That is, it is necessary to optimize the size of the files, the number of function calls, the page load time, that is, all that takes the resources that have the best use.
And now is the time to tell about the key and most famous phrase from computer science related to optimization.
I specifically found the image of a young Donald Knut, since this phrase was already said back in 1974 and has so many interpretations that even Knut himself repeatedly explained (how funny: not a method in the interface, but a whole phrase has polymorphism). Yes, premature optimization is the root of all ills . In 97% of cases it will not lead to anything. But the remaining 3% can not be discounted.
In those old times, when there were no convenient profilers, IDE, iPhones, browsers, Internet, personal computers, OOP, and the total power of all computers in the world was equal to several modern smartphones. Even then, in a discussion article with Dykstra on the applicability of GO TO in structured programming, Knut remarked that in most cases optimization does not produce results, but rather takes the time and makes the code less readable.
And now a more illustrative example. But we are already armed with technologies and can see what optimization the site is offered by the automatic utility PageSpeed from Google (I chose the sinopec group, as one of the richest in the world, should be on the site).
So, the total size of the site when loading 2.1M, and the utility finds that you can compress styles, from which to win 9.2K. That is less than half a percent. You have to agree that the end user will not notice such optimization, and it will not create problems with loading and transportation.
And what then to optimize? Let's take a look at another profiler page for a change.
There is no longer file size, but performance. That is, how much time was spent on the execution of functions in the application for a short period of time, and then sorted by this very time. The picture contains 12 functions from 600+, taking into account the large font. As always, one percent of the most costly functions consume more resources than 50% of the most non-cost. So, when optimizing performance, seeing such a table will never hide it further - without optimizing anything from the first 3 to 8 functions, the visible improvement will not come. Such a simple truth, but because of its misunderstanding, it takes a lot of time.
And now the second important point related to this, which is no longer so obvious. I came to this conclusion by observing several years of various statistics in IT, just as Kliment Timiryazev had been watching the leaves in flasks for years. You will not be able to reduce the real project to a state where the allocation of resources will be normal or at least comparable. No number of iterations of optimization. A well-optimized project will still have the distribution of the execution time of functions as shown in the picture above, only the total time for their execution after optimization will be noticeably lower.
<humor> That is, our Sun- like dream to normalize IT people is not possible mathematically. </ humor>
This is all on the main report. Now a small bonus on the topic of "who is to blame," that is, the theoretical part. All the distributions observed in the article do not satisfy the CLT due to the absence of dispersion, but still there is a general form of the distribution laws for them. These are stable distributions associated with Levi-Khinchin representations. The theory of such distributions is well studied in finance, theory of physics, demography. According to my observations, it fits perfectly in IT. Moreover, she entered computer science together with the name of Mandelbrot, who was a student of the aforementioned Levi and, by studying processes with infinite variance, discovered fractals. Notice how beautiful it is, a fractal can be not just a picture or a data structure, like a tree of folders and files, but also a statistical data set. Further, these distributions obey the Benford law, acquaintance with which simply will not allow you to calmly look at the sets of numbers (as, for example, in the above screenshots of the profilers, where it is obvious). And this is not all; fans of pure mathematics in these distributions will find use of fractional derivatives, the method of characteristic function, method of moments (the two Laplace and Chebyshev discovered by studying such distributions), signal conversion and much more. What I have already written about in previous articles or else I will write in future ones.
Source: https://habr.com/ru/post/336524/
All Articles