Reporting in 1C: Data Composition System (ACS), idea and architecture
One of the most important areas of business software is reporting. How easy it is to adjust an existing report to a changing business needs (and legislation) or make a new one may depend (and not in a figurative sense!) The fate of the business, whether it is a report for the tax inspectorate or a chart of the demand for goods from the season and other factors . A powerful and flexible reporting system that allows you to easily extract the necessary data from the system, present it in an easy-to-understand form, allowing the end user to reconfigure the standard report to see the data in a new light - this is the ideal every business system should strive for.
In the 1C: Enterprise platform, a mechanism called Data Composition System (abbreviated to ACS) is responsible for generating reports. In this article we will try to give a brief description of the idea and architecture of the SKD mechanism and its capabilities.
ACS is a mechanism based on a declarative report description. SKD is designed to build reports and to display information that has a complex structure. By the way, in addition to developing reports, the ACS mechanism is also used in 1C: Enterprise in a dynamic list , a means of displaying list information with rich functionality (showing flat and hierarchical lists, conditional design of lines, grouping, etc.).
')
In the very first version of the 1C: Enterprise 8 platform, version 8.0, the reports were made as follows:
The approach is straightforward, but not the most convenient - at least visual settings, everything has to be programmed by "hand-to-hand". At that time, one of the trump cards of the completely new platform “1C: Enterprise 8” is the minimization of the amount of code that you need to write manually in an application solution, in particular, due to visual design. It would be logical to go the same way in the reporting engine. This was done by developing a new mechanism - the Data Composition System.
One of the ideas that formed the basis of the SKD was the flexibility and customizability of reports, which was available both to the developer and to the end user. Ideally, I would like to give the end user access to the same set of tools for report design as the developer. It would be logical to make a single set of tools available to all. Well, since the tools require the participation of the end user, it means that you need to use programming in them to the minimum (the best thing is to eliminate it completely), and to use the visual settings to the maximum.
The task for the development team was to create a reporting system based not on an algorithmic (ie, through writing code), but on a declarative approach to creating reports. And we believe that the problem was successfully solved. In our experience, about 80% of the required reporting can be implemented using ACS without a single line of code (except for writing formulas for calculated fields), mostly through visual settings.
The development of the first version of SKD took about 5 man-years.
Two languages are involved in creating reports. One is the query language used to fetch the data. The second, a data composition expression language, is intended to record expressions used in various parts of the system, for example, in data composition settings, to describe expressions of user fields.
The query language is based on SQL and is easily mastered by those who know SQL. Request example:
It is easy to see analogs of sections standard for SQL query - SELECT, FROM, GROUP BY, ORDER BY.
At the same time, the query language contains a significant number of extensions aimed at reflecting the specifics of financial and economic tasks and at maximally reducing efforts to develop application solutions:
The request mechanism automatically modifies the request taking into account the roles to which the user belongs, on whose behalf the request is executed (that is, the user will see only the data that he has the right to see) and the functional options (that is, according to the functionality).
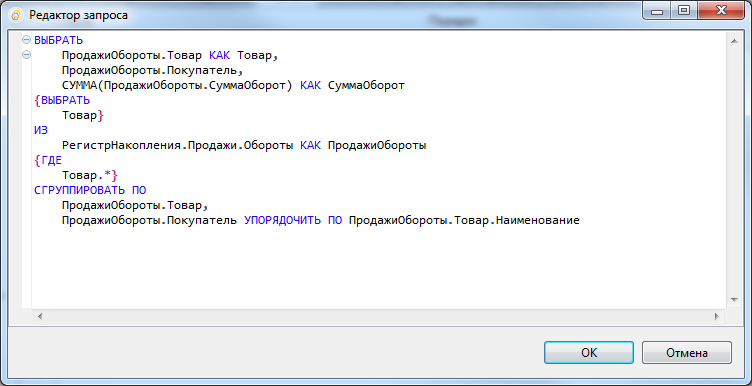
There are also special query language extensions for ACS. The extension is carried out using special syntactic instructions, enclosed in braces and placed directly in the query text. Using extensions, the developer determines which operations the end user will be able to perform by customizing the report.
For example:
An example of using extensions:
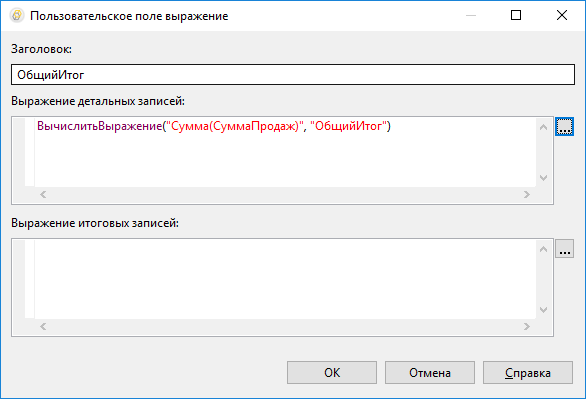
The data composition expression language is designed to record expressions used, in particular, to describe custom field expressions. ACS allows you to define custom fields in the report using either your own expressions or a set of options with the conditions of their choice (similar to CASE in SQL). Custom fields are analogous to calculated fields. They can be set both in the configurator and in the “1C: Enterprise” mode, but in the expressions of custom fields the functions of common modules cannot be used. Therefore, user fields are intended for the user rather than the developer.
Example:
When creating a report, we need to create a layout that determines how the data will be displayed in the report. You can create a layout based on the data composition schema. The data composition scheme describes the essence of the data that is provided to the report (where to get the data from and how its composition can be managed). The data composition scheme is a base from which various reports can be generated. The data composition scheme may contain:
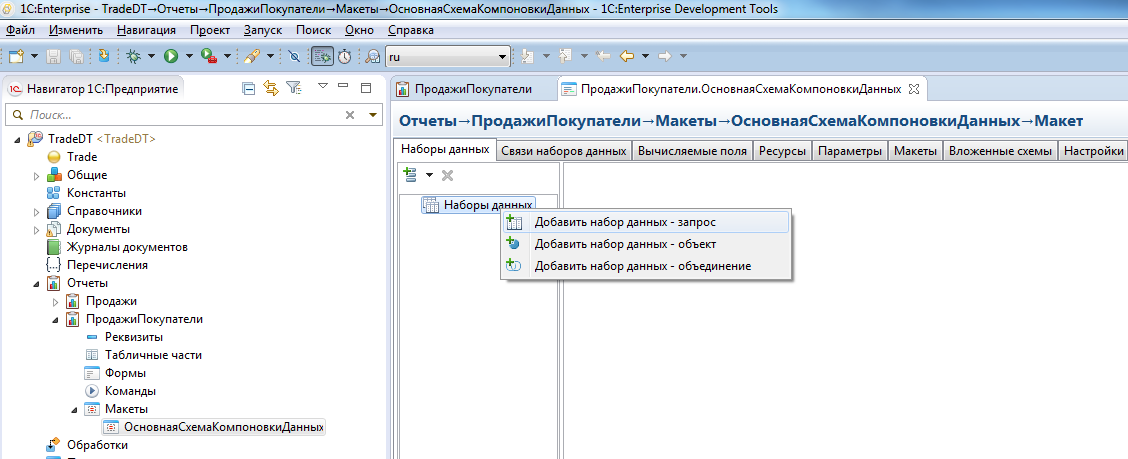
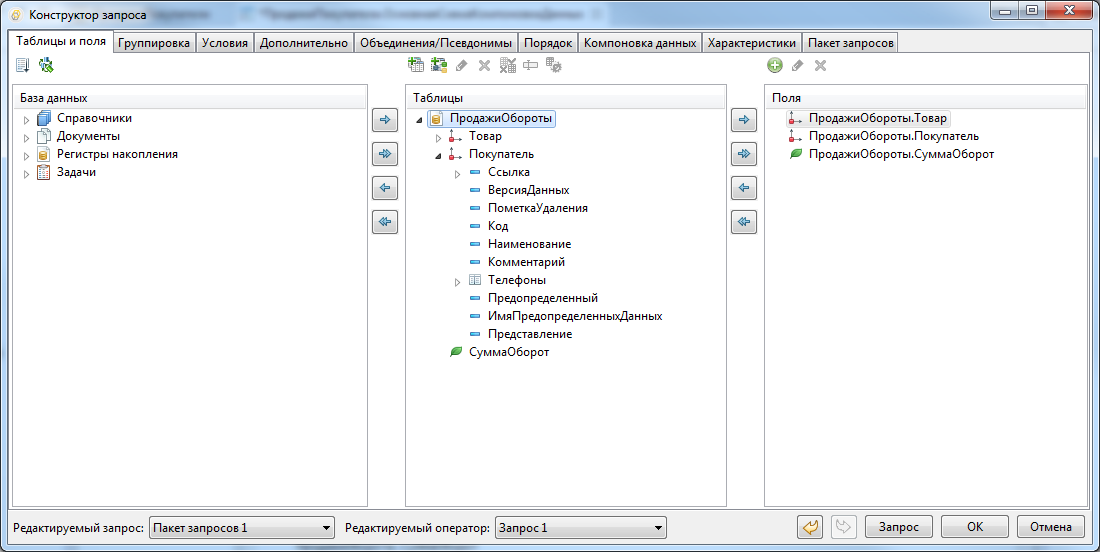
For example, you can add a query to the data composition scheme as a data set, and call the query designer, which allows you to graphically create a query of arbitrary complexity:
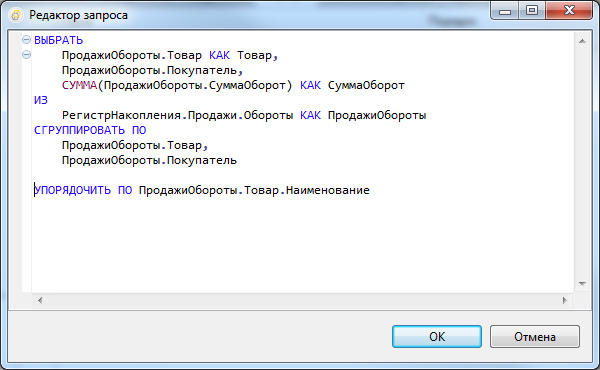
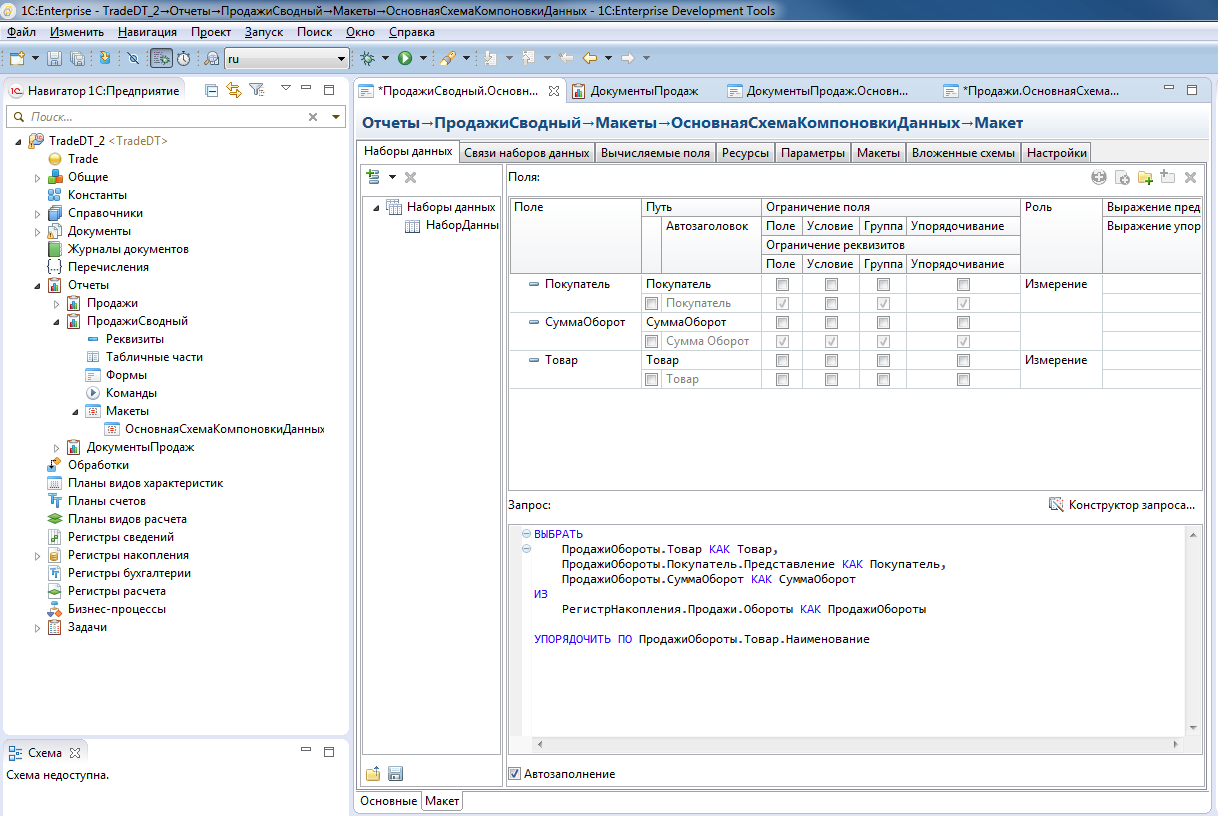
The result of the launch of the query designer will be the query text (in the query language “1C: Enterprise”). This text can be manually corrected if necessary:
There can be several data sets in the data composition scheme, data sets can be arbitrarily linked in the layout, calculated fields can be added, report parameters are set, etc. It is worth mentioning an interesting feature of the query mechanism in 1C: Enterprise. Queries are ultimately translated into a SQL dialect specific to the DBMS, with which the application works directly. We generally try to use the capabilities of the database servers to the maximum (we are limited by the fact that we use only those capabilities that are simultaneously in all supported by the 1C: Enterprise platform DBMS - MS SQL, Oracle, IBM DB2, PostgreSQL). Thus, at the query level in the calculated fields, we can use only those functions that are translated to SQL.
But at the level of the data composition scheme, we can already add custom fields and use functions in them in the built-in 1C development language (including those written by us), which greatly expands the capabilities of the reports. Technically, it looks like this - everything that can be translated into SQL is translated into SQL, the query is executed at the DBMS level, the query results are placed in the memory of the 1C application server and the ACS calculates the values of the calculated fields for each record, whose formulas are written in 1C.
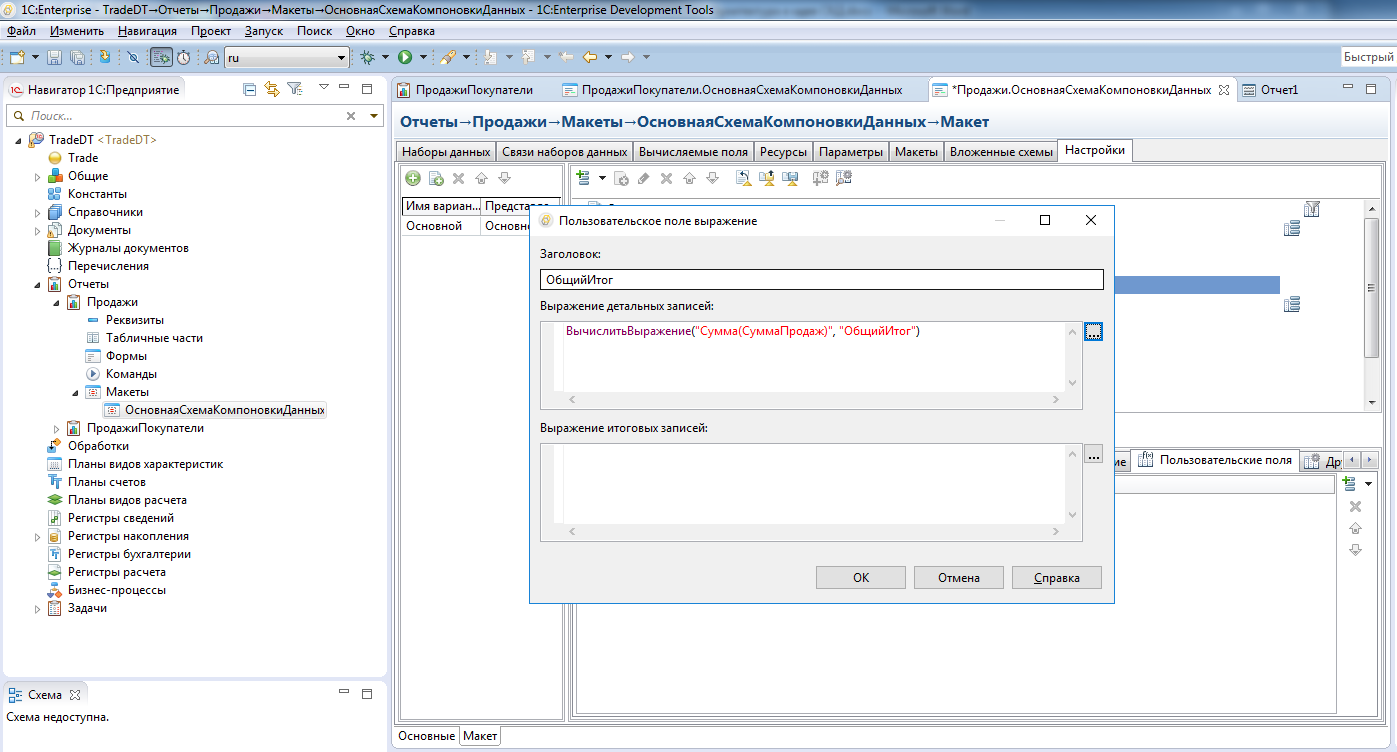
Add custom fields
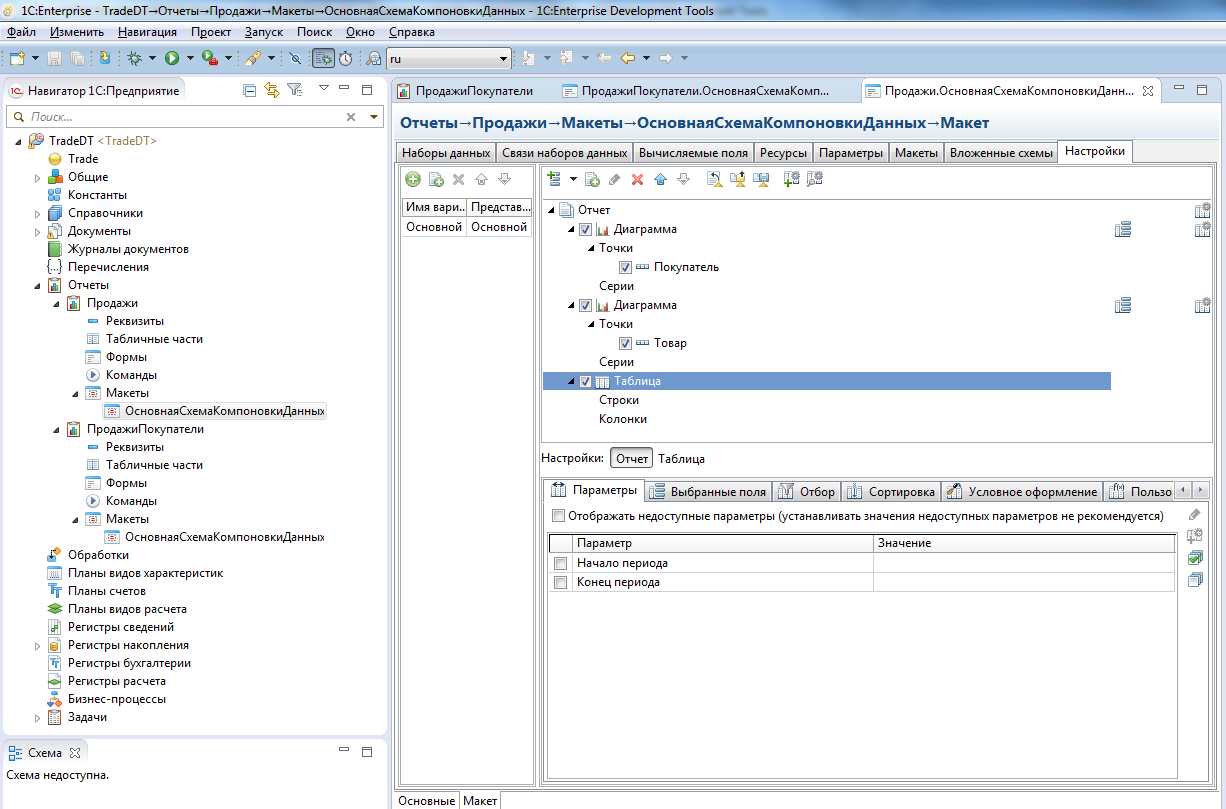
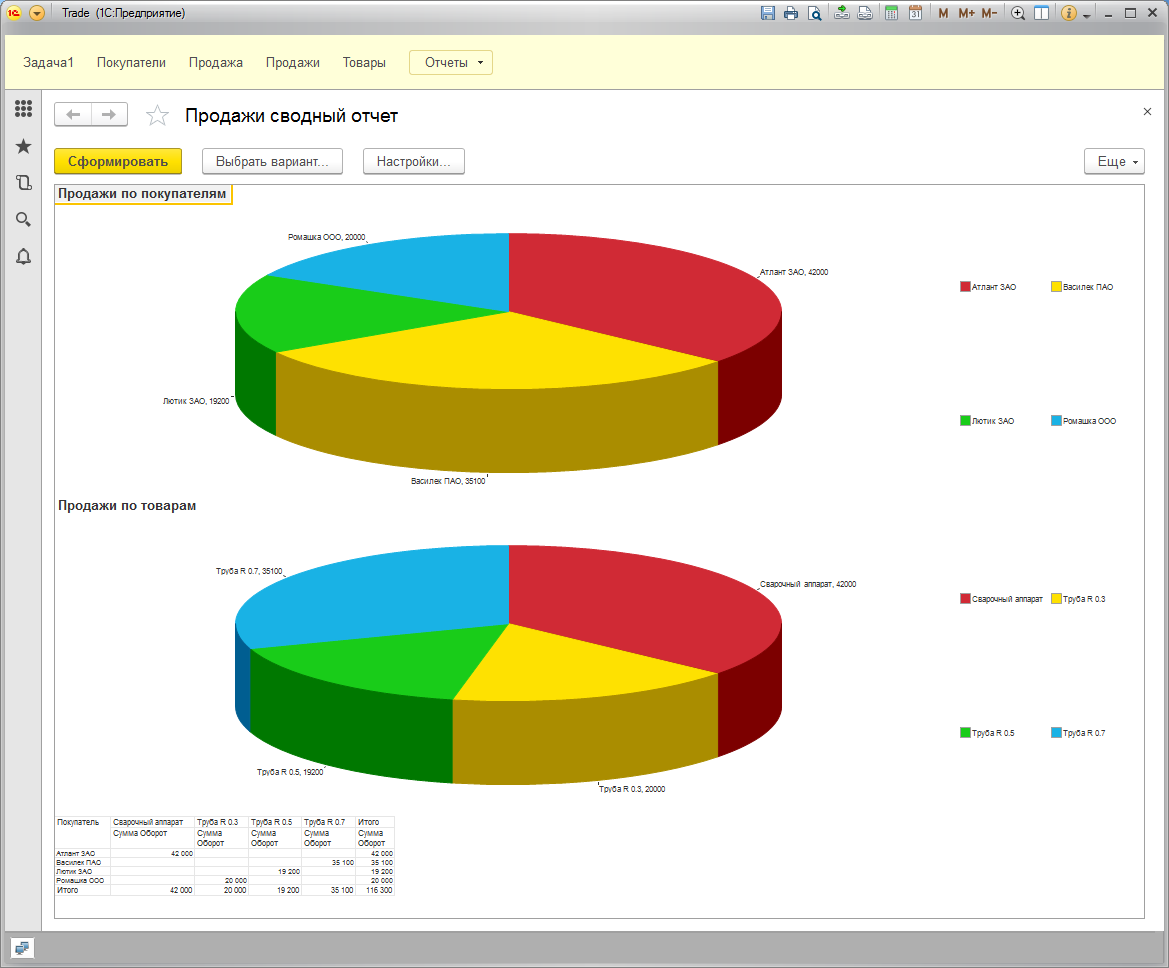
An arbitrary number of tables and charts can be added to the report:
Report Designer
Runtime Report
With the help of ACS, the user can add complex selections to the report (which will be added to the request in the right places), conditional design (allowing different formatting - with font, color, etc. - displayed fields depending on their values) and much more .
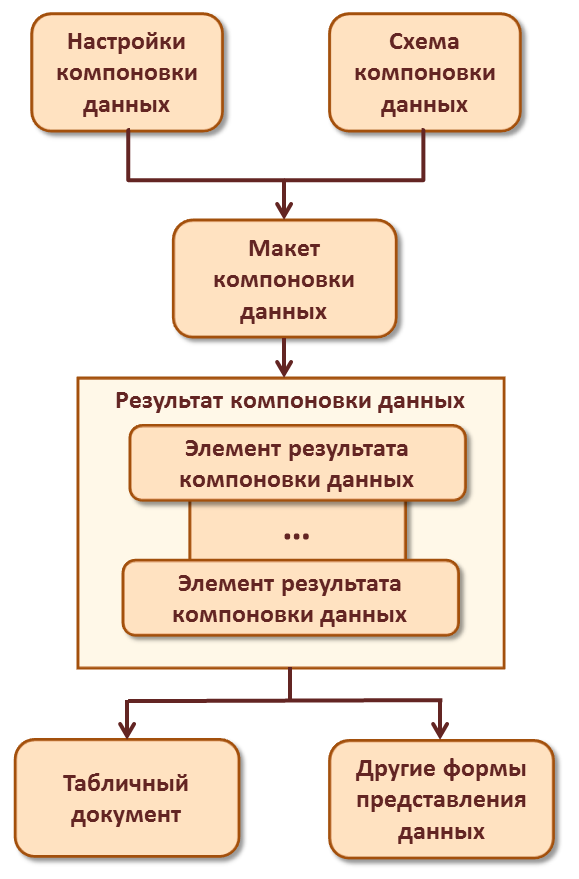
Briefly describe the process of building and generating a report as follows:
The process of forming the report mechanism SKD
We try to minimize the amount of data reports transmitted from the server to the client application. When displaying data in a tabular document when opening a tabular document, we send only those lines from the server that the user sees at the beginning of the document. As the user moves along the lines of the document to the client, the missing data is downloaded from the server.
All SKD tools are available to both the developer and the end user. But practice has shown that the end user is often intimidated by the abundance of capabilities of the tool. Moreover, in most cases all the power of settings to the end user is not needed - it is enough for him to have quick access to setting up one or two report parameters (for example, period and counterparty). Starting from a certain version of the platform, the report developer has the opportunity to note which report settings are available to the user. This is done using the checkbox "Include in user settings." Also, the report settings now have a “Display Mode” flag, which accepts one of three values:
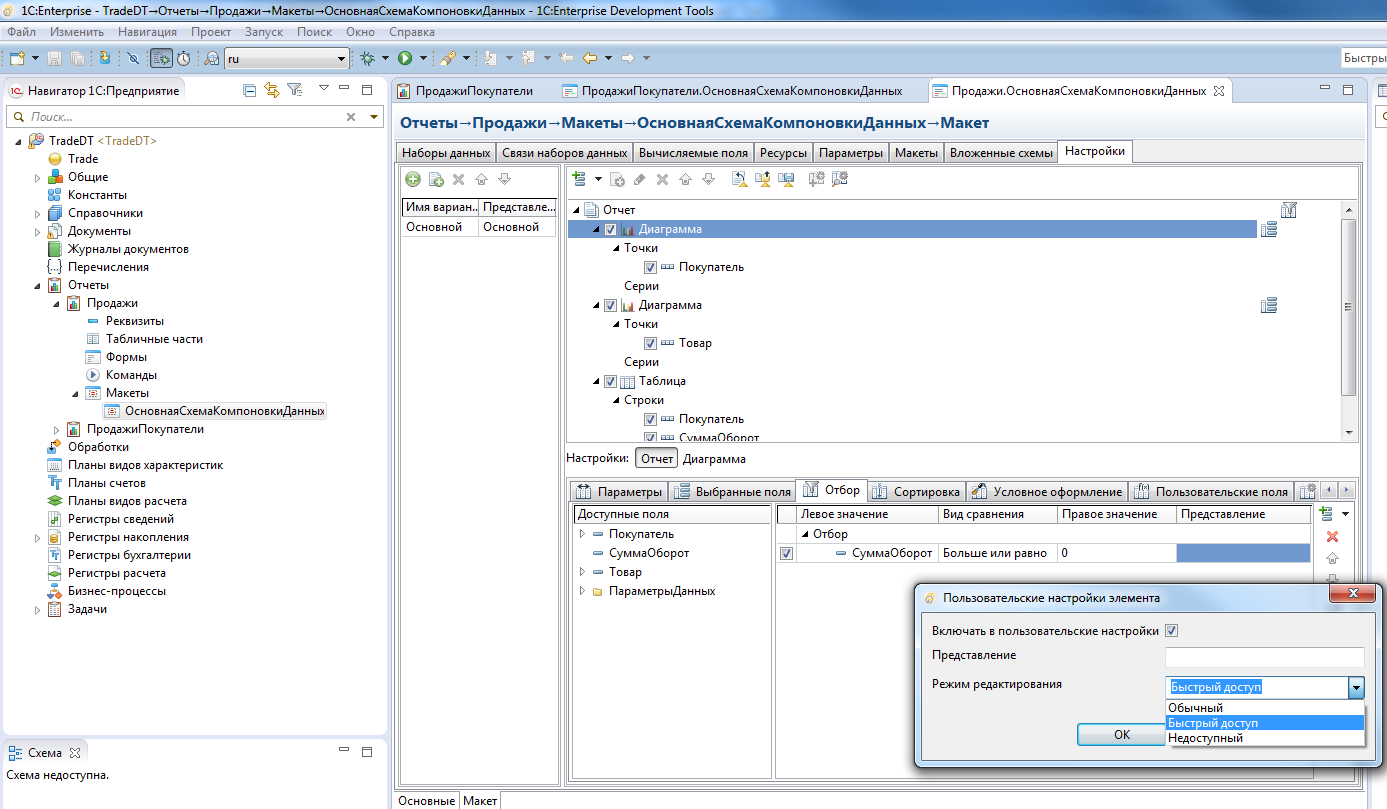
Setting display mode at design time
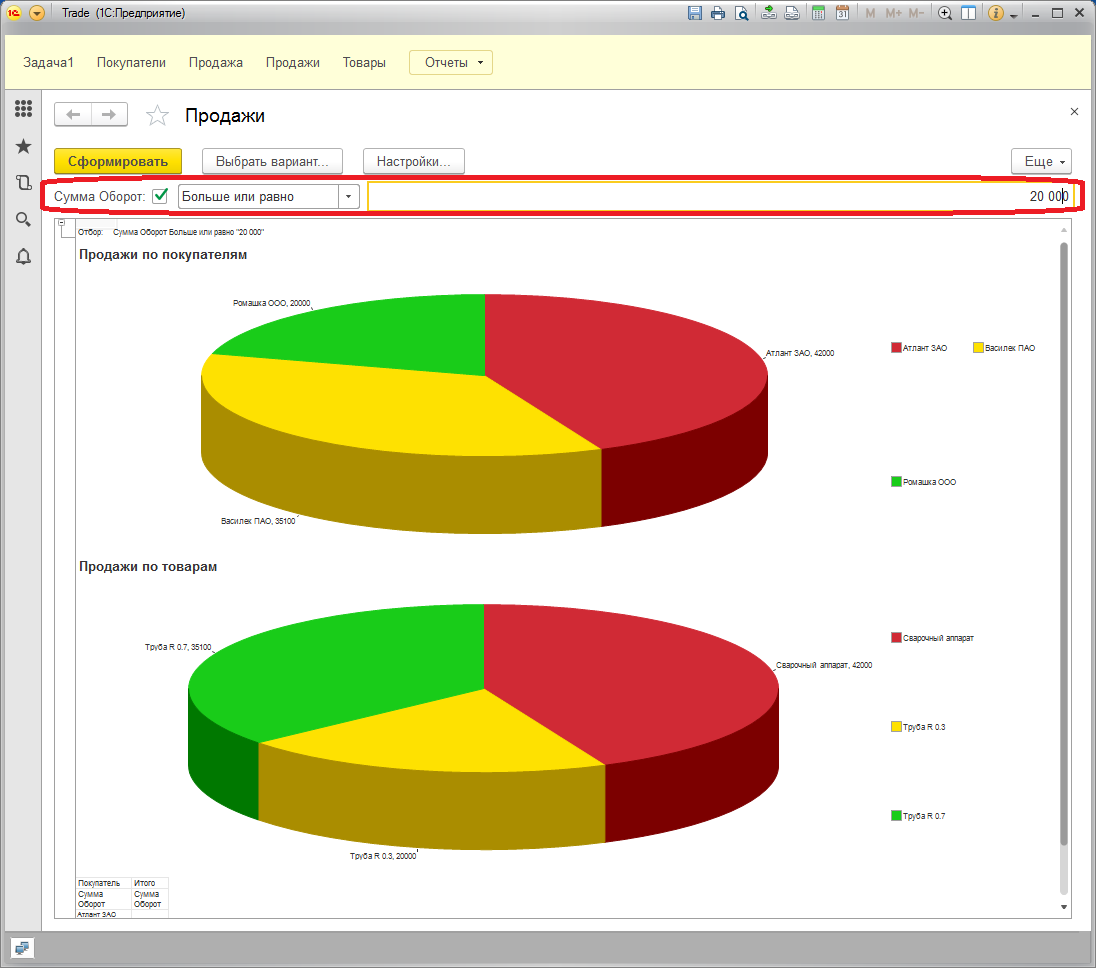
Display settings in the mode "Quick Access" at run time (under the button "Generate")
One of the priorities in the development of ACS for us is to simplify user settings. Our experience shows that for some end users, working with user preferences is still a serious work. We take this into account and work in this direction. Accordingly, it will also be easier for developers to work with ACS, since we, as before, want to provide a single report customization toolkit for both the developer and the end user.
In the 1C: Enterprise platform, a mechanism called Data Composition System (abbreviated to ACS) is responsible for generating reports. In this article we will try to give a brief description of the idea and architecture of the SKD mechanism and its capabilities.
ACS is a mechanism based on a declarative report description. SKD is designed to build reports and to display information that has a complex structure. By the way, in addition to developing reports, the ACS mechanism is also used in 1C: Enterprise in a dynamic list , a means of displaying list information with rich functionality (showing flat and hierarchical lists, conditional design of lines, grouping, etc.).
')
A bit of history
In the very first version of the 1C: Enterprise 8 platform, version 8.0, the reports were made as follows:
- One or several queries were written in the 1 query language (SQL-like language, more about it below).
- A code was written that transferred the results of executed queries to a tabular document or to a chart. The code could also do work that could not be done in the request — for example, calculated values using the built-in 1C language.
The approach is straightforward, but not the most convenient - at least visual settings, everything has to be programmed by "hand-to-hand". At that time, one of the trump cards of the completely new platform “1C: Enterprise 8” is the minimization of the amount of code that you need to write manually in an application solution, in particular, due to visual design. It would be logical to go the same way in the reporting engine. This was done by developing a new mechanism - the Data Composition System.
One of the ideas that formed the basis of the SKD was the flexibility and customizability of reports, which was available both to the developer and to the end user. Ideally, I would like to give the end user access to the same set of tools for report design as the developer. It would be logical to make a single set of tools available to all. Well, since the tools require the participation of the end user, it means that you need to use programming in them to the minimum (the best thing is to eliminate it completely), and to use the visual settings to the maximum.
Formulation of the problem
The task for the development team was to create a reporting system based not on an algorithmic (ie, through writing code), but on a declarative approach to creating reports. And we believe that the problem was successfully solved. In our experience, about 80% of the required reporting can be implemented using ACS without a single line of code (except for writing formulas for calculated fields), mostly through visual settings.
The development of the first version of SKD took about 5 man-years.
Two languages
Two languages are involved in creating reports. One is the query language used to fetch the data. The second, a data composition expression language, is intended to record expressions used in various parts of the system, for example, in data composition settings, to describe expressions of user fields.
Query language
The query language is based on SQL and is easily mastered by those who know SQL. Request example:
It is easy to see analogs of sections standard for SQL query - SELECT, FROM, GROUP BY, ORDER BY.
At the same time, the query language contains a significant number of extensions aimed at reflecting the specifics of financial and economic tasks and at maximally reducing efforts to develop application solutions:
- Appeal to the fields through the point. If the fields of a table have a reference type (they store references to objects of another table), the developer can refer to them in the query text using ".", And the system does not limit the number of nesting levels for such links (for example, Customer’s Order. Agreement. Organization. Phone).
- Multidimensional and multi-level formation of the results. Totals and subtotals are formed taking into account grouping and hierarchy, the levels can be traversed in random order with subtotals summarized, the correct construction of totals by time measurements is ensured.
- Support for virtual tables. The virtual tables provided by the system provide practically ready data for most application tasks without the need for complex queries. Thus, a virtual table can provide data on the balance of goods in the context of periods at some point in time. At the same time, virtual tables make maximum use of stored information, for example, previously calculated totals, etc.
- Temporary tables. Query language allows you to use temporary tables in queries. With their help, you can improve query performance, in some cases, reduce the number of locks and make the text of the query easier to read.
- Batch requests. For more convenient work with temporary tables, query work is supported with batch queries — thus, the creation of a temporary table and its use are placed in one query. A batch request is a sequence of requests separated by a semicolon (";"). Requests in the package are executed one by one. The result of a batch query, depending on the method used, will be either the result returned by the last packet request, or an array of the results of all the batch requests in the sequence followed by the queries in the batch.
- Getting views of reference fields. Each object table (in which the directory or document is stored) has a virtual field - “Presentation”. This field contains a textual representation of the object and facilitates the work of the report creator. So, for a document, this field contains all the key information - the name of the document type, its number and date (for example, “Sale 000000003 of 07/06/2017 17:49:14”), saving the developer from writing a calculated field.
- and etc.
The request mechanism automatically modifies the request taking into account the roles to which the user belongs, on whose behalf the request is executed (that is, the user will see only the data that he has the right to see) and the functional options (that is, according to the functionality).
There are also special query language extensions for ACS. The extension is carried out using special syntactic instructions, enclosed in braces and placed directly in the query text. Using extensions, the developer determines which operations the end user will be able to perform by customizing the report.
For example:
- CHOOSE. This sentence describes the fields that the user can select to display. After this keyword, comma-separated lists of the aliases of the fields from the main query selection list that will be available for customization. Example: {SELECT Nomenclature, Warehouse}
- WHERE. Describes the fields on which the user will be able to impose a selection. This offer uses table fields. Using aliases in the select list fields is not allowed. Each part of the union may contain its own element WHERE. Examples: {WHERE Nomenclature. *, Warehouse}, {WHERE Document.Date> = & StartDate, Document.Date <= &DateAnd}
- and etc.
An example of using extensions:
Data Layout Expression Language
The data composition expression language is designed to record expressions used, in particular, to describe custom field expressions. ACS allows you to define custom fields in the report using either your own expressions or a set of options with the conditions of their choice (similar to CASE in SQL). Custom fields are analogous to calculated fields. They can be set both in the configurator and in the “1C: Enterprise” mode, but in the expressions of custom fields the functions of common modules cannot be used. Therefore, user fields are intended for the user rather than the developer.
Example:
The process of creating a report on ACS
When creating a report, we need to create a layout that determines how the data will be displayed in the report. You can create a layout based on the data composition schema. The data composition scheme describes the essence of the data that is provided to the report (where to get the data from and how its composition can be managed). The data composition scheme is a base from which various reports can be generated. The data composition scheme may contain:
- query text with data composition system instructions;
- description of several data sets;
- detailed description of the available fields;
- a description of the relationships between multiple data sets;
- description of data acquisition parameters;
- description of field and group layouts;
- and etc.
For example, you can add a query to the data composition scheme as a data set, and call the query designer, which allows you to graphically create a query of arbitrary complexity:
The result of the launch of the query designer will be the query text (in the query language “1C: Enterprise”). This text can be manually corrected if necessary:
There can be several data sets in the data composition scheme, data sets can be arbitrarily linked in the layout, calculated fields can be added, report parameters are set, etc. It is worth mentioning an interesting feature of the query mechanism in 1C: Enterprise. Queries are ultimately translated into a SQL dialect specific to the DBMS, with which the application works directly. We generally try to use the capabilities of the database servers to the maximum (we are limited by the fact that we use only those capabilities that are simultaneously in all supported by the 1C: Enterprise platform DBMS - MS SQL, Oracle, IBM DB2, PostgreSQL). Thus, at the query level in the calculated fields, we can use only those functions that are translated to SQL.
But at the level of the data composition scheme, we can already add custom fields and use functions in them in the built-in 1C development language (including those written by us), which greatly expands the capabilities of the reports. Technically, it looks like this - everything that can be translated into SQL is translated into SQL, the query is executed at the DBMS level, the query results are placed in the memory of the 1C application server and the ACS calculates the values of the calculated fields for each record, whose formulas are written in 1C.
Add custom fields
An arbitrary number of tables and charts can be added to the report:
Report Designer
Runtime Report
With the help of ACS, the user can add complex selections to the report (which will be added to the request in the right places), conditional design (allowing different formatting - with font, color, etc. - displayed fields depending on their values) and much more .
Briefly describe the process of building and generating a report as follows:
- The developer at design time using the designer (or at runtime using code) determines the data composition scheme:
- Text of request / requests
- Description of calculated fields
- Links between queries (if there are several)
- Report options
- Default settings
- Etc.
- The above settings are saved in the layout.
- User opens report
- Possibly makes additional settings (for example, changes parameter values)
- Press the button "Generate"
- User settings are applied to the data composition schema defined by the developer.
- An intermediate layout of the data layout is formed, containing instructions on where to receive the data. In particular, the queries specified in the layout are adjusted. So, fields that are not used in the report are removed from the request (this is done in order to minimize the amount of data received). All fields participating in the formulas of the calculated fields are added to the query.
- A data composition processor is involved. The layout processor performs queries, communicates data sets, calculates the values of calculated fields and resources, performs grouping. In short, it does all the calculations that were not performed at the DBMS level.
- The data output processor launches the execution request and outputs the data to a tabular document, chart, etc.
The process of forming the report mechanism SKD
We try to minimize the amount of data reports transmitted from the server to the client application. When displaying data in a tabular document when opening a tabular document, we send only those lines from the server that the user sees at the beginning of the document. As the user moves along the lines of the document to the client, the missing data is downloaded from the server.
Custom settings
All SKD tools are available to both the developer and the end user. But practice has shown that the end user is often intimidated by the abundance of capabilities of the tool. Moreover, in most cases all the power of settings to the end user is not needed - it is enough for him to have quick access to setting up one or two report parameters (for example, period and counterparty). Starting from a certain version of the platform, the report developer has the opportunity to note which report settings are available to the user. This is done using the checkbox "Include in user settings." Also, the report settings now have a “Display Mode” flag, which accepts one of three values:
- Fast access. The setting will be displayed directly in the upper part of the report window.
- Usual. The setting will be available through the "Settings" button.
- Not available. The setting will not be available to the end user.
Setting display mode at design time
Display settings in the mode "Quick Access" at run time (under the button "Generate")
Development plans
One of the priorities in the development of ACS for us is to simplify user settings. Our experience shows that for some end users, working with user preferences is still a serious work. We take this into account and work in this direction. Accordingly, it will also be easier for developers to work with ACS, since we, as before, want to provide a single report customization toolkit for both the developer and the end user.
Source: https://habr.com/ru/post/336258/
All Articles