Engineering systems of our data centers and their monitoring, part two
The continuation of the publication, here is the first part
In this final part, I will talk about the software component of our monitoring system.
4. Trace Mode and what it is eaten with.
5. Cool metrics and all-all-all
6. Summing up
')
Again, initially there was no pronounced monitoring in the first data center, but there was a need for it. And they decided to embody this need first on the basis of Miran-2, which is already under construction, which was also planned to be modular. Designers and integrators suggested using domestic Trace Mode as SCADA . This product at that time could satisfy all Wishlist in terms of monitoring, was relatively simple in further development (if such a need arose ... and it did arise) and seemed to cost a lot of money. In general, a good option for a simple system.
ARM duty center "Miran-2". Clickable
Trace Mode is a completely classic example of SCADA, it has a core server that polls all the necessary hardware on the network and the client console on ARMs on duty, which output all the vital information from the server in the form of various mnemonic schemes. This version was used for monitoring the Miran-2 as a whole. For modular data centers inside (there are two of them so far) - the version with thin clients was used (java applet in the browser).

Photo of the panel with the “thin” client in the browser and the panel with the client-console. Clickable
Briefly tell about the internal structure of projects. There are conditionally two levels:

Trace Mode IDE. "Sources / Receivers". Clickable
Trace Mode IDE. "Channels". Clickable
This is the core of SCADA.
Of course, in Trace Mode there is also the possibility to write subroutines in generally accepted industrial languages (ST, LD, FBD), create reports, send SMS and E-mail.
Initially, monitoring from the integrator was pretty simple. The bare minimum: data on the status of input and auxiliary machines, data on energy consumption, readings of temperature sensors and humidity sensors, condition of air conditioners and UPS, and also (one of the most important parameters) - post-rack energy consumption calculation.
Since The system, of course, was imperfect and suffered from all kinds of flaws, it needed to be maintained and improved. Here on stage and your humble servant appears. My main task was to reduce the number of errors in the system to a minimum, and in the future, to add newfeature glitches , which should facilitate the operation of the entire engineering infrastructure of our data centers.
First of all, the monitoring system was “combed and licked”, namely: all kinds of “ochepyatki” were corrected, the order of numbers was adjusted (200 degrees Celsius in the cold corridor turn into 20.0), a consensus was found, what we measure in racks - in kW or nevertheless in kVA. Spoiler!
The second tier were strategic corrections. For example, in the initial version of the project of the first modular data center there was no indication of the status of its UPS, whether they were normal or disconnected in an emergency condition due to a breakdown. The list of possible emergencies and reports on many data center nodes was expanded. Mnemonic schemes are overgrown with various icons, indicators, and additional parameters, in general, with everything that should help to understand whether the data center is healthy or not.
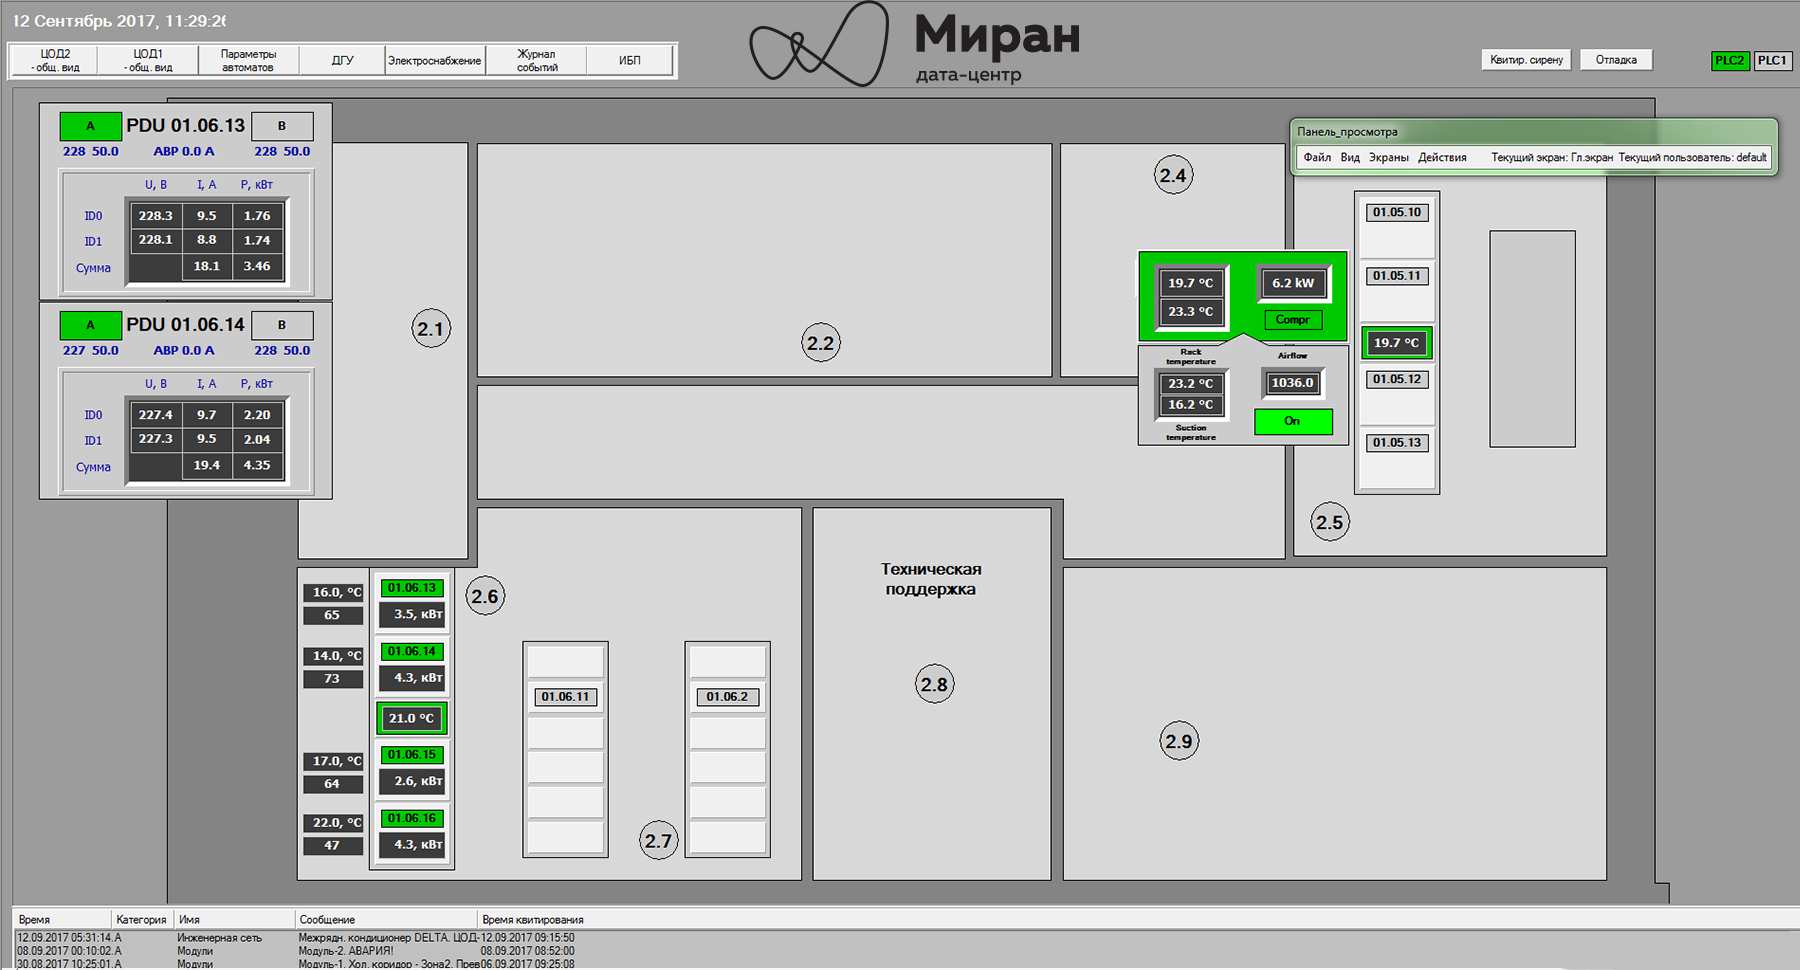
The main mnemonic of the data center Miran-2
The main mnemonic of the data center Miran-1

Mnemonic diagram of UPS status of Miran-2 communication center
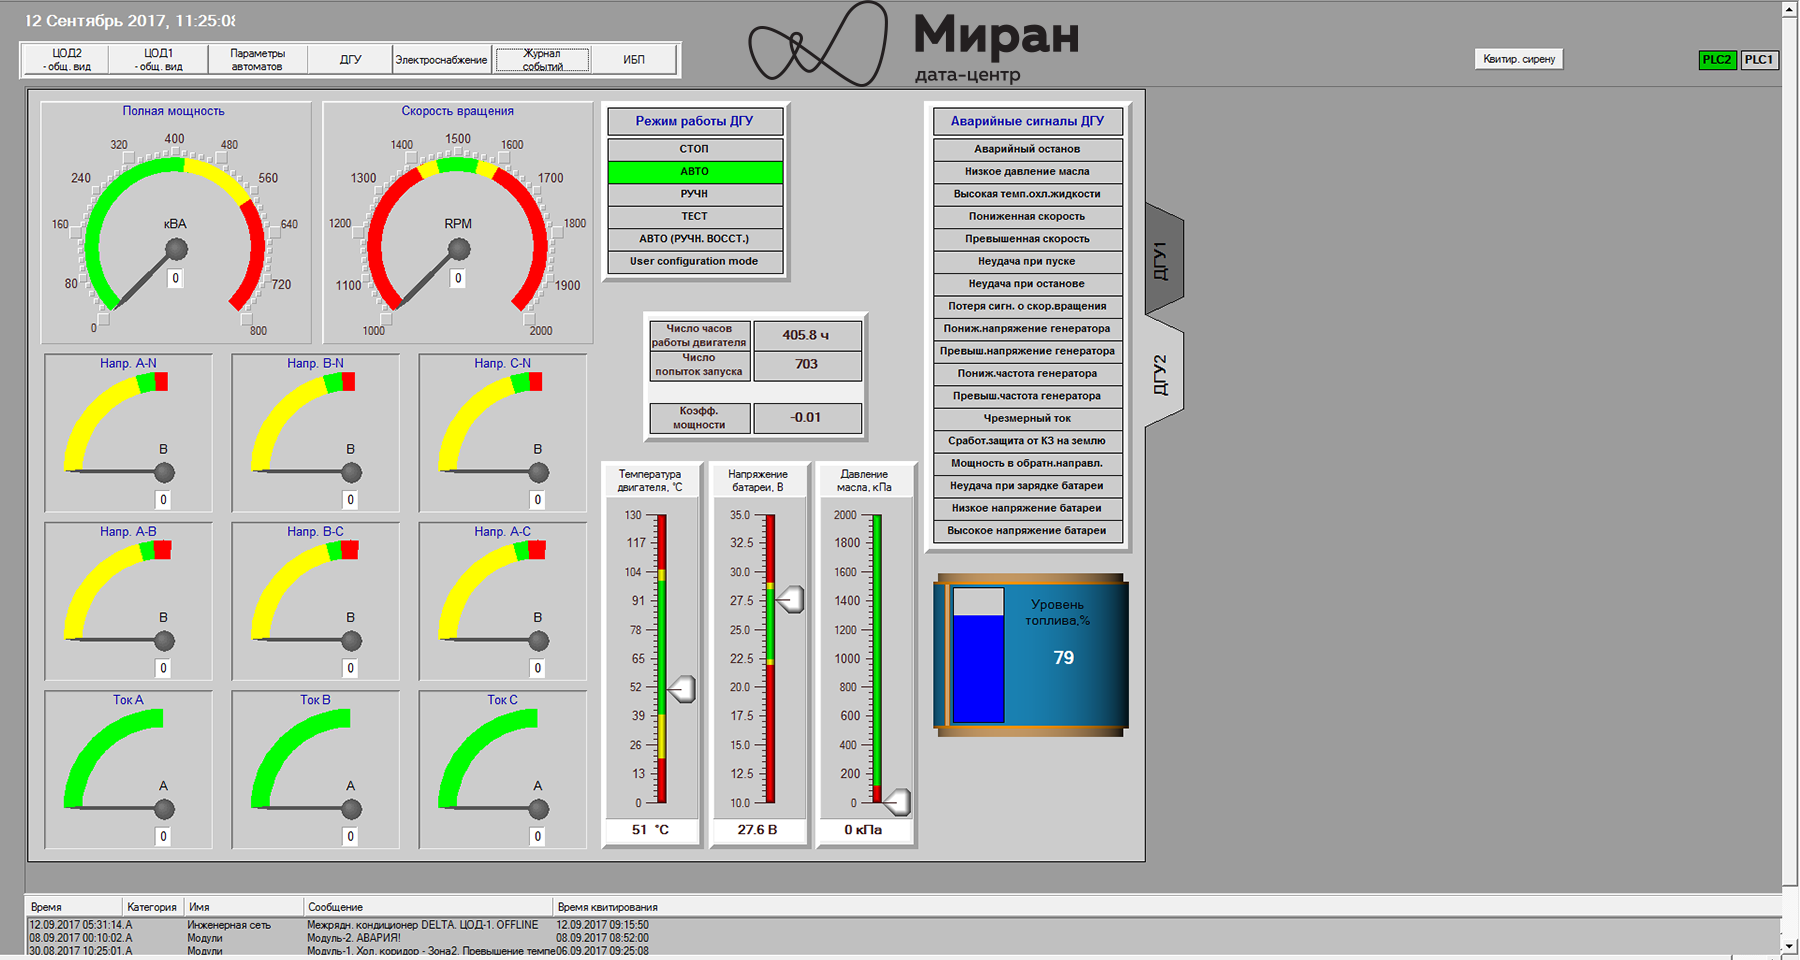
Mnemoshema DGU-1 "Miran-2"
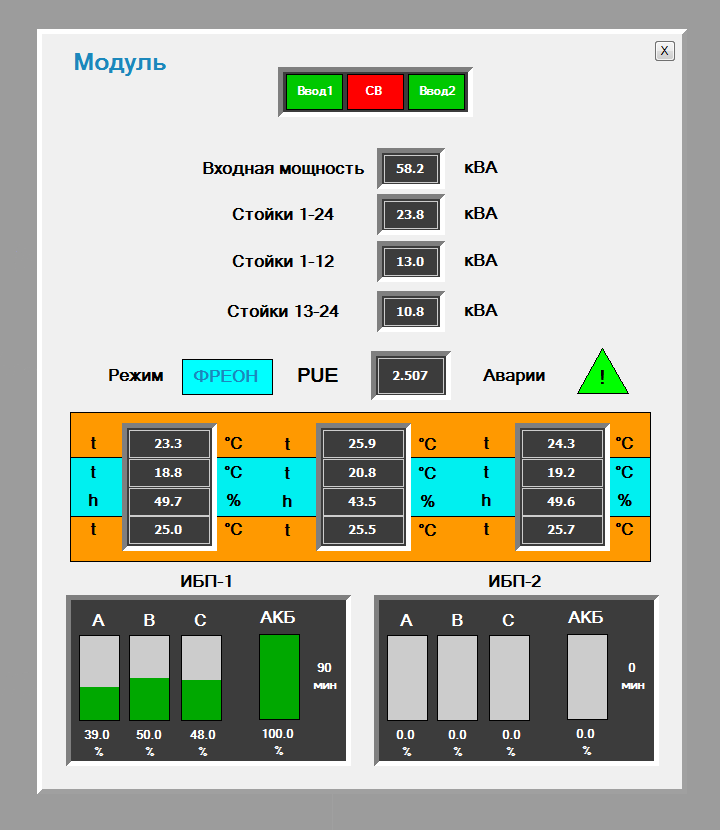
Pop-up mnemonic of modular data center "Module-2"
Huge panels with flashing mnemonic schemes are very cool and good, but the person on duty is still a person who is tired, forgotten and not noticed. Unfortunately, the mobile data center systems do not have an alarm log, so it was decided to implement the distribution of emergency letters, both to the service of the chief engineer and to the ticketing system of our technical support. Later, an alert siren was added to this.
After a year of polishing Trace Mode projects, some kind of digestible compromise was reached between “we want beautiful, modern and cool” and “realized how we could and how it happened”. In general, the system coped with monitoring and alerting on the current state, but I also wanted to have the possibility of the simplest analysis of climate and power consumption.
Since Modular data center systems were equipped only with thin clients and they did not support graphs and trends (again), at least some analysis was performed in the form of daily reports to E-mails of the service of the chief engineer (with the simplest signs filled with mines). / max values for temperature and energy consumption racks). Visibility, however, still left much to be desired. In addition, the unstable work of Trace Mode's own archives from which this data was extracted became another stumbling block.
After going through several options for solving all this disgrace, it was decided to stop at the option with the shipment of data from Trace Mode to an external database for further processing.
When I wanted to start implementing the above option, our chief engineer came across the grafana site on the Internet . Together, having sighed over the beauty of the graphs, we agreed on the fact that to realize this for our needs on the current platform is difficult. Nevertheless, grafana firmly stuck in my head and I began to look for any guides with a description of the implemented solutions with her participation. Several articles on Habré became critical: 1 and 2 (Habrinspires help!) With mention of the collectd daemon and its plugins.
Now the idea of how to implement all this for our needs has matured.
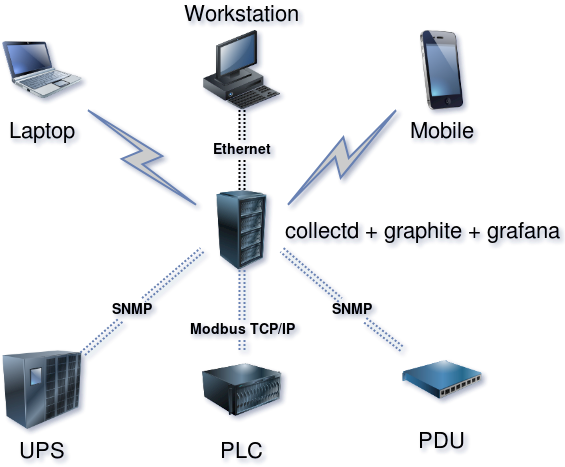
Under this whole case, a low-load blade server was allocated and a test Ubuntu with all the necessary software was deployed. After that, the turn came to fill in the collectd config for what and how to interrogate it. Below are some excerpts from the config. Nothing special, everything is strictly in accordance with the documentation on the daemon and plugins:
Dashboard main ASU "Miran-2". Clickable

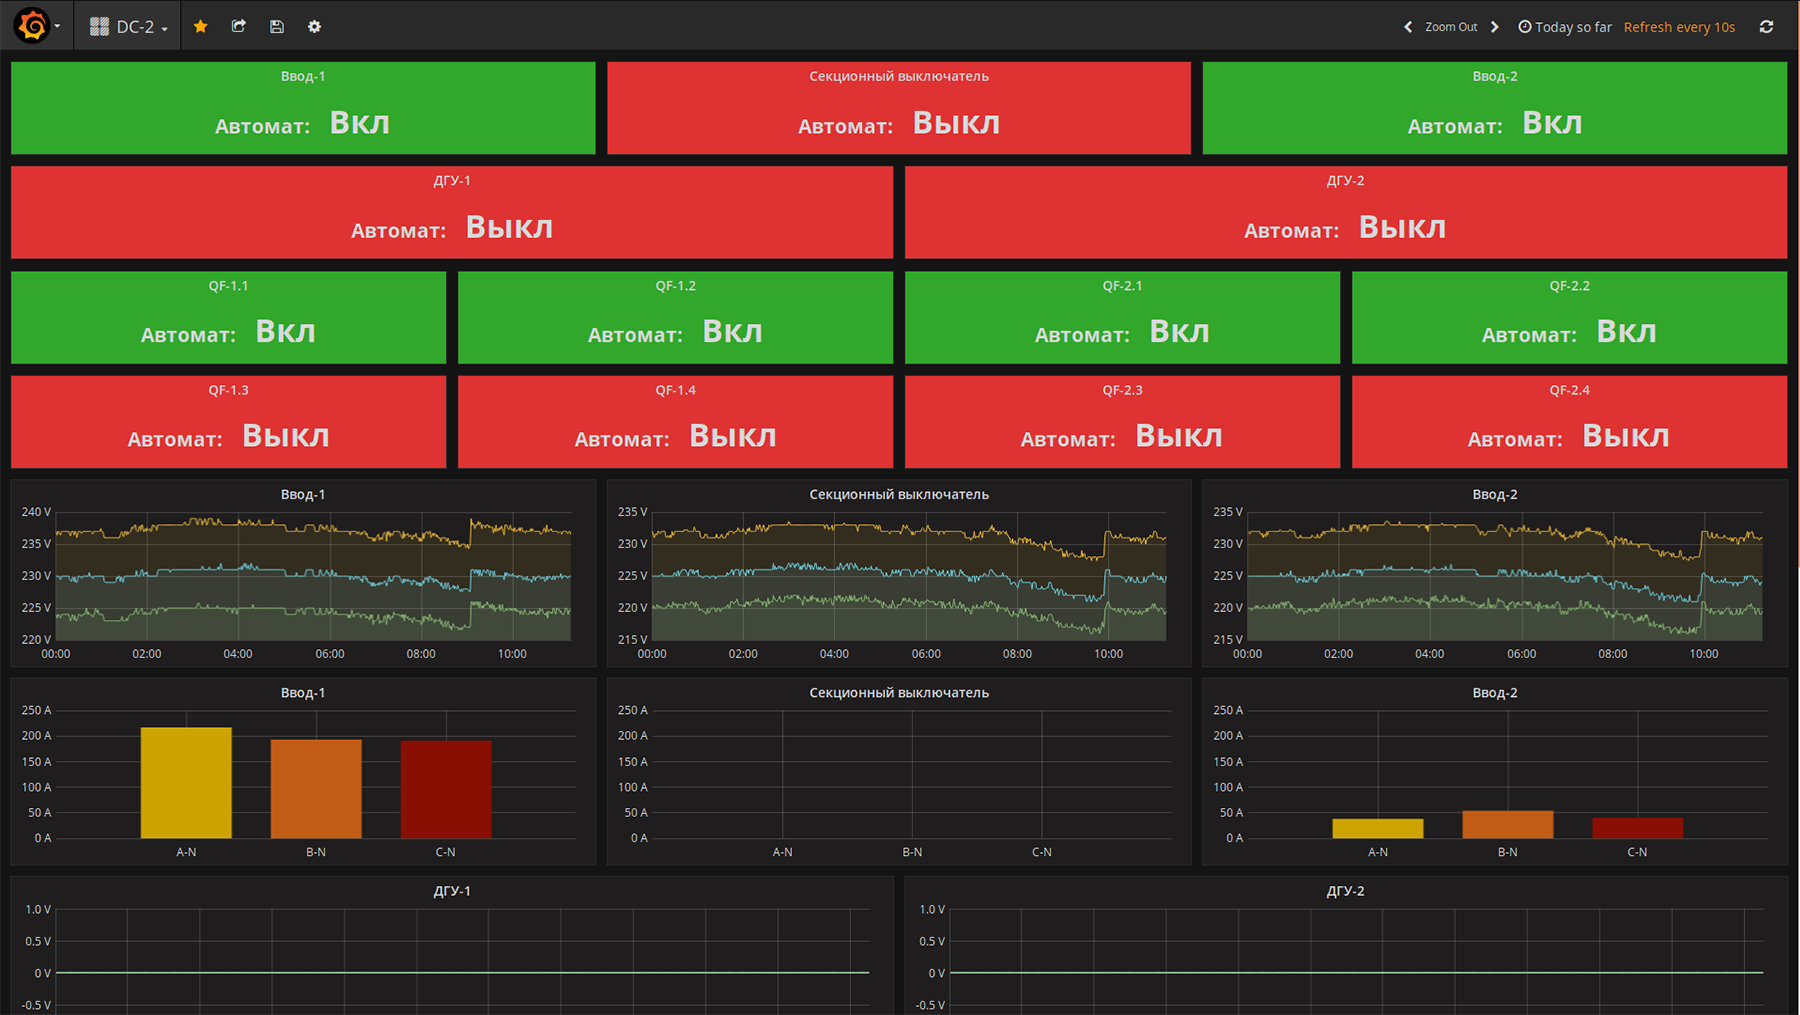
Dashboards with the most important parameters "Module-2". Clickable
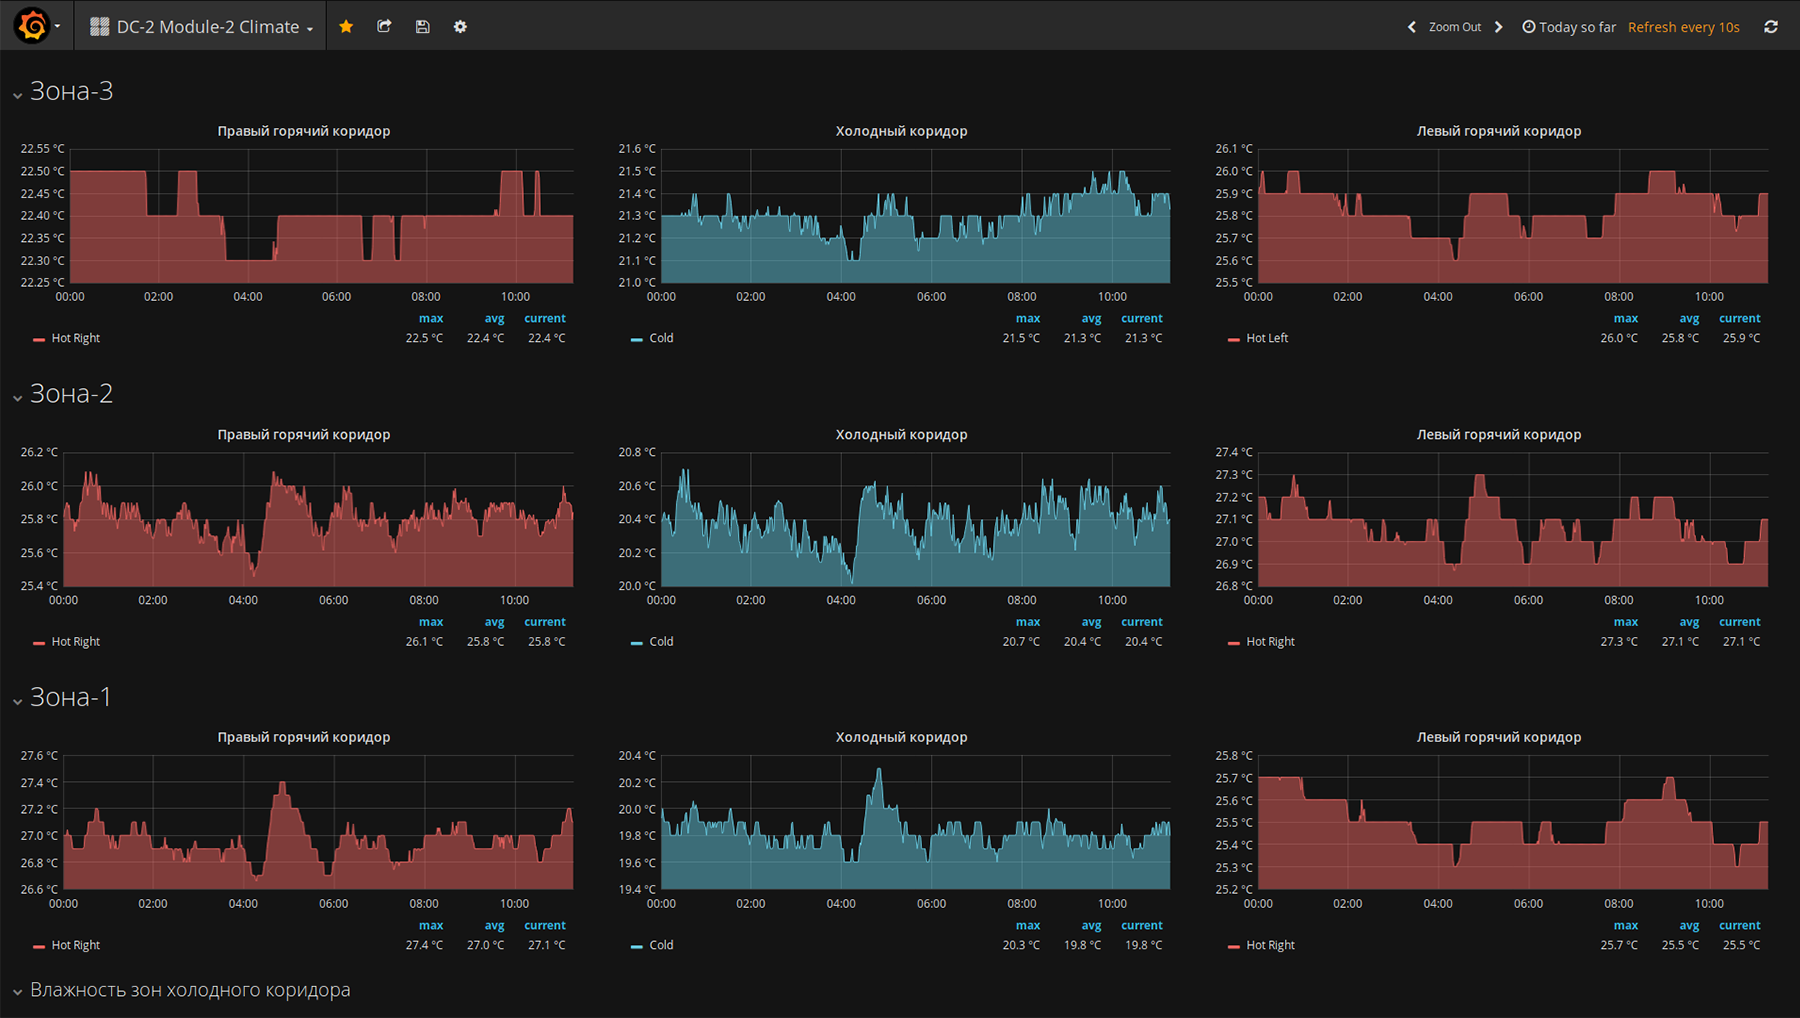
Dashboards with climatic trends “Modul-2”. Clickable
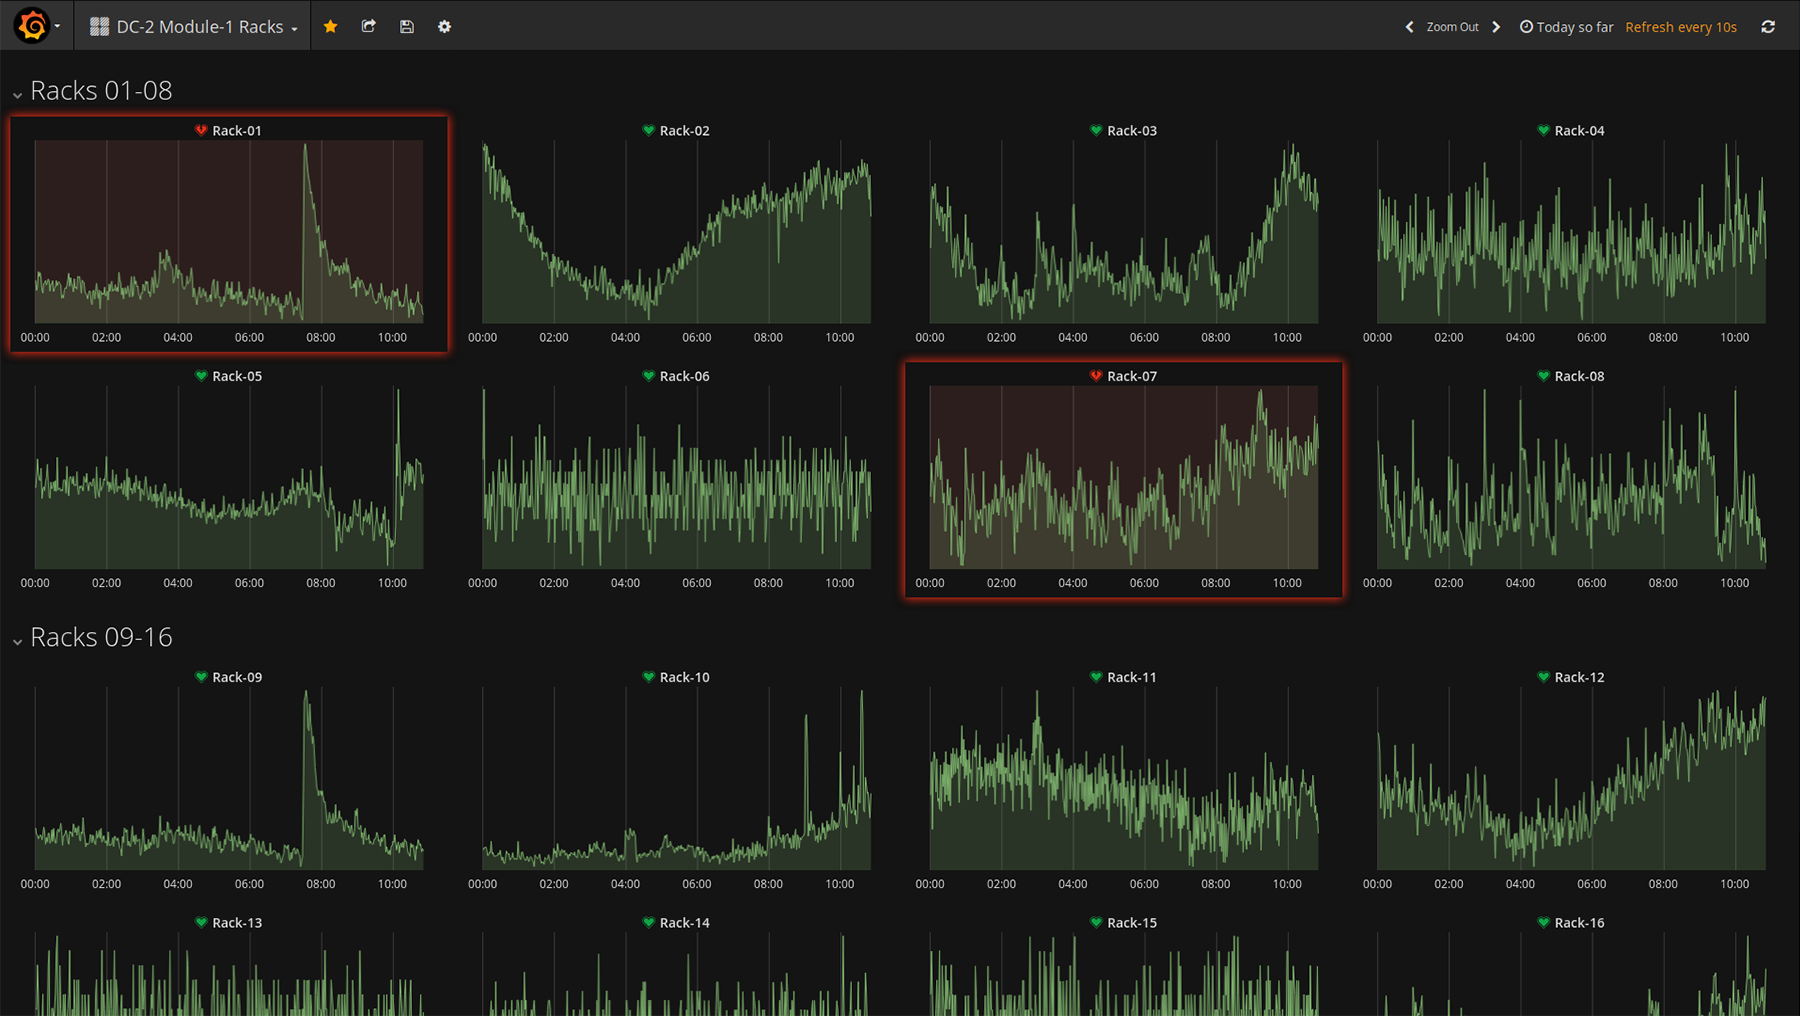
Dashboards with trends in consumption of racks "Module-1". Clickable
So, the current advantages of the decision on collectd + graphite + grafana in comparison with Trace Mode :
Minuses:
So far, it has been decided to leave the monitoring system with a kind of hybrid from the classic SCADA Trace Mode with its client applications and servers as hidden from unauthorized cores with ACS and AFM and the outer wrapper grafana with beautiful and convenient metrics accessible to everyone within the corporate network. What we will come to in the end - time will tell, there are still enough engineering tasks.
I will be glad to questions. Thanks for attention!
In this final part, I will talk about the software component of our monitoring system.
4. Trace Mode and what it is eaten with.
5. Cool metrics and all-all-all
6. Summing up
')
Trace Mode and what it eats
Again, initially there was no pronounced monitoring in the first data center, but there was a need for it. And they decided to embody this need first on the basis of Miran-2, which is already under construction, which was also planned to be modular. Designers and integrators suggested using domestic Trace Mode as SCADA . This product at that time could satisfy all Wishlist in terms of monitoring, was relatively simple in further development (if such a need arose ... and it did arise) and seemed to cost a lot of money. In general, a good option for a simple system.
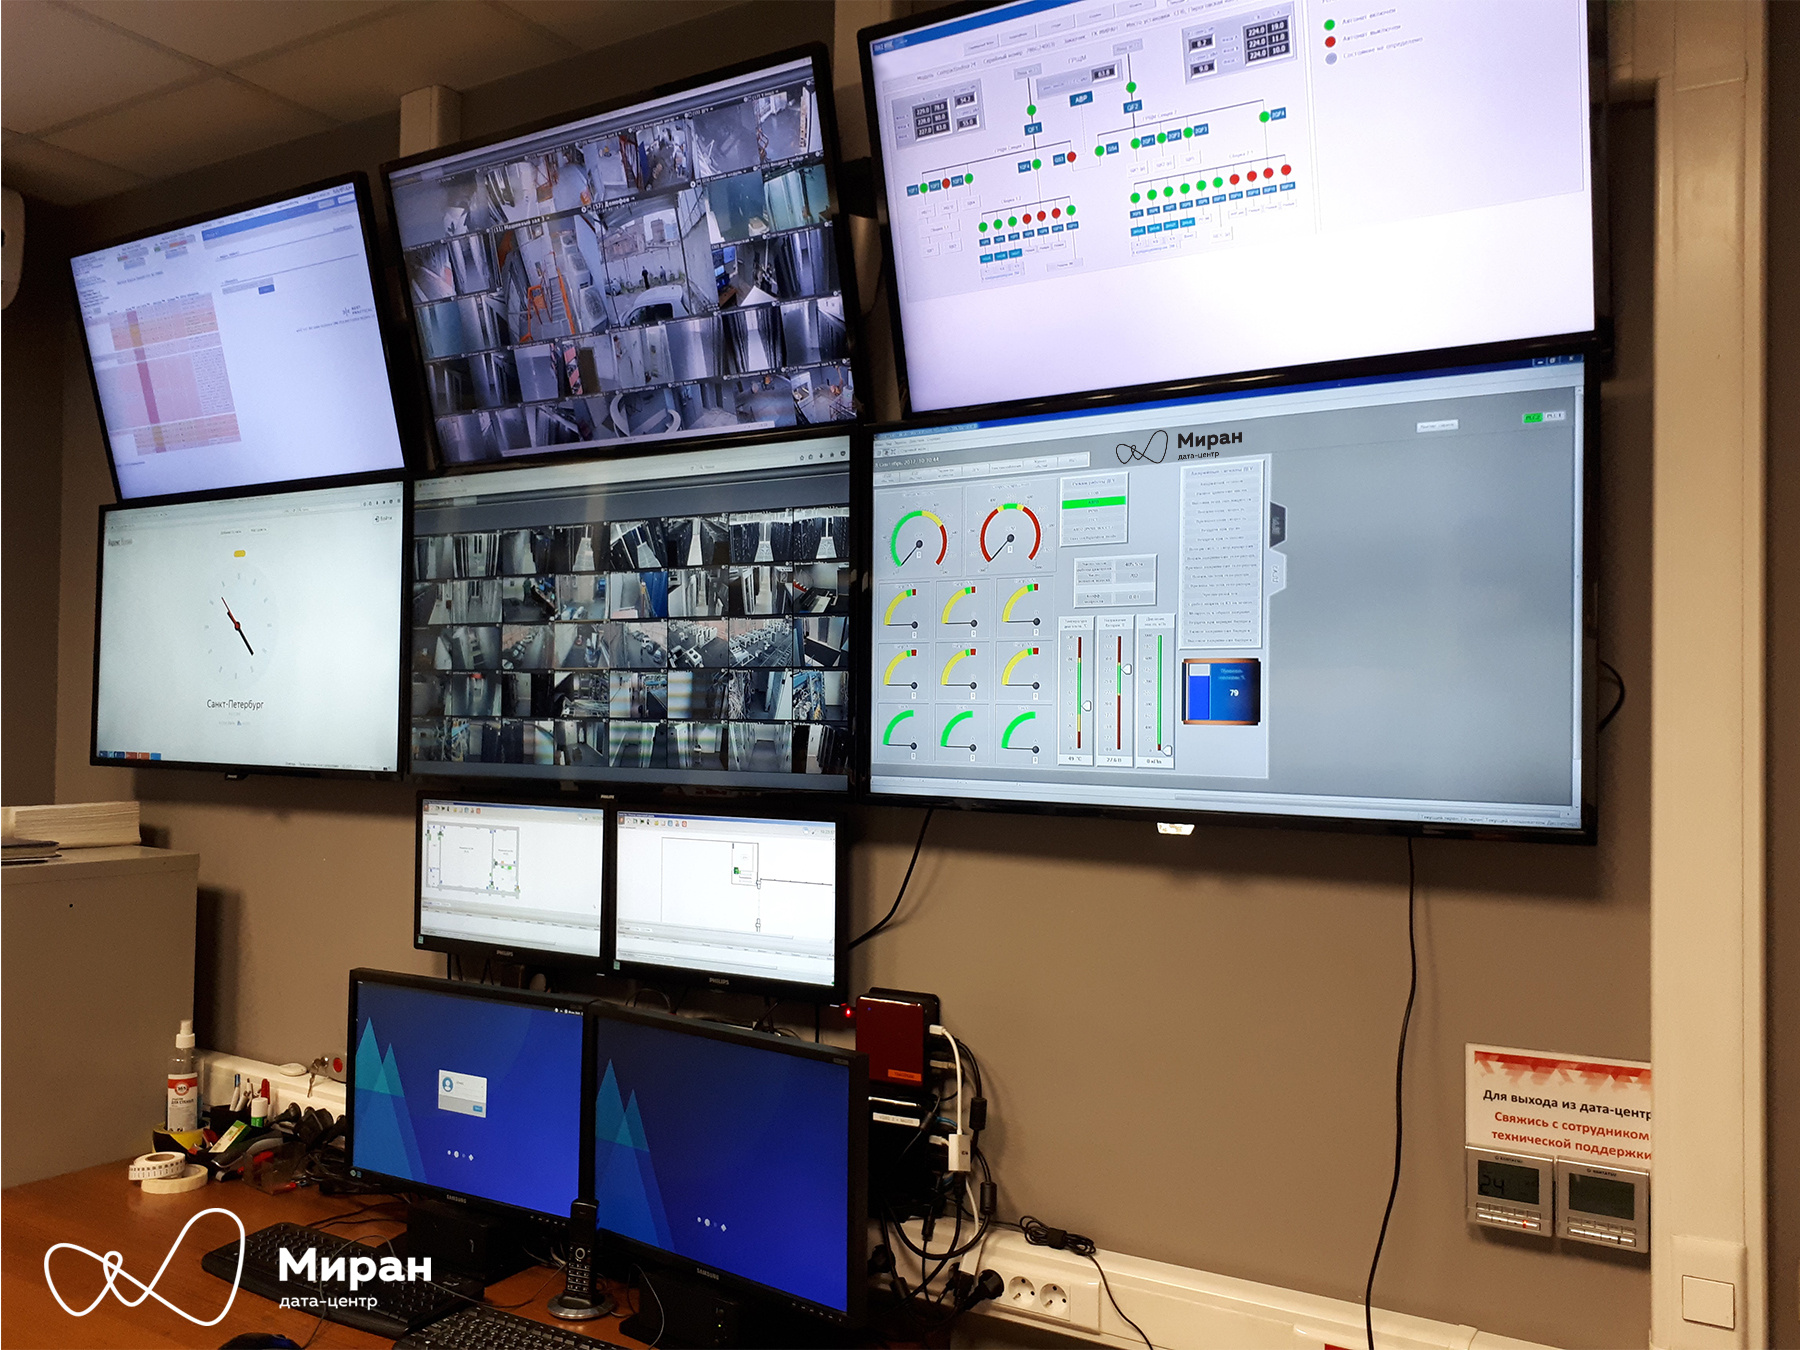
ARM duty center "Miran-2". Clickable
Trace Mode is a completely classic example of SCADA, it has a core server that polls all the necessary hardware on the network and the client console on ARMs on duty, which output all the vital information from the server in the form of various mnemonic schemes. This version was used for monitoring the Miran-2 as a whole. For modular data centers inside (there are two of them so far) - the version with thin clients was used (java applet in the browser).
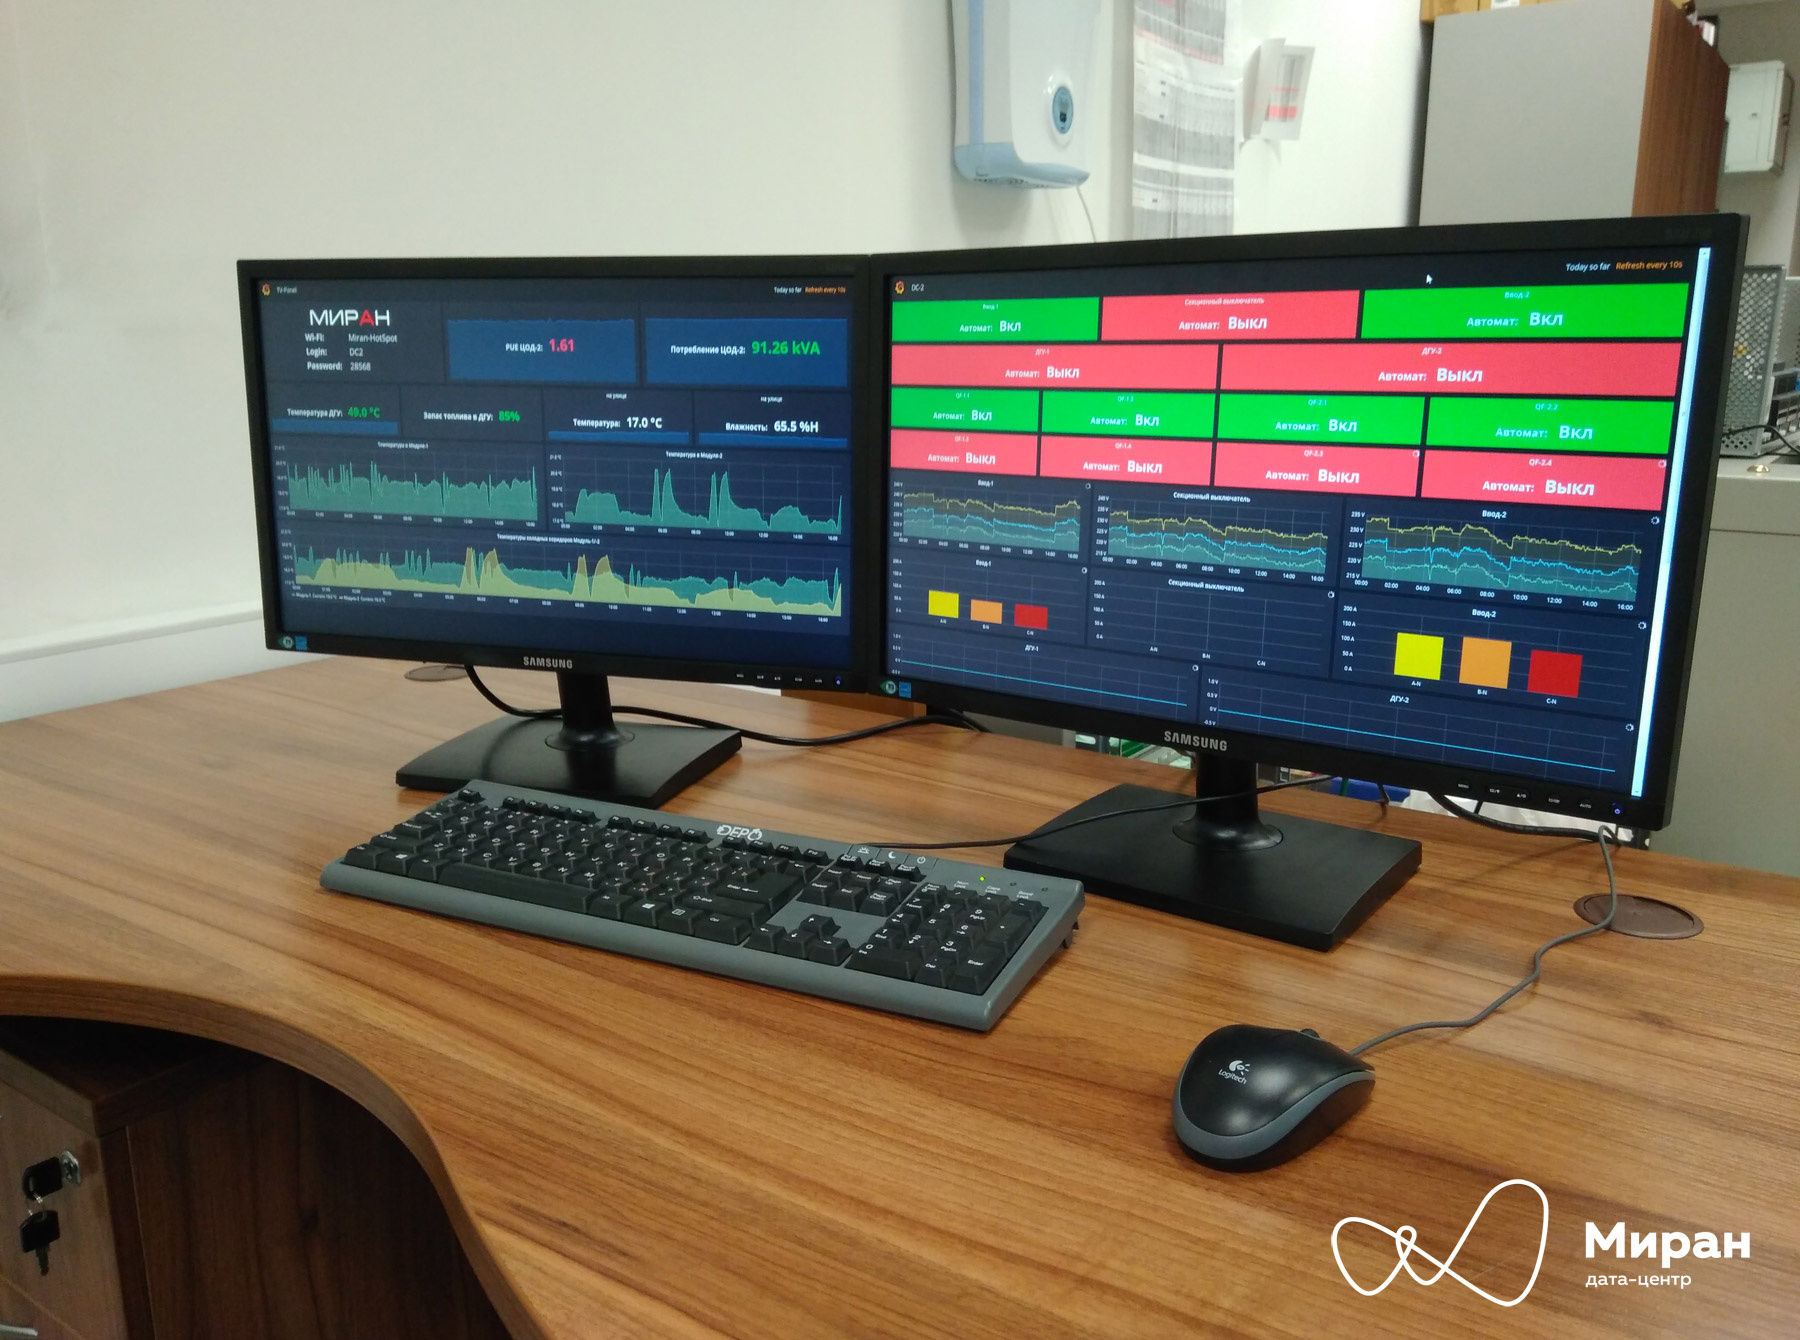
Photo of the panel with the “thin” client in the browser and the panel with the client-console. Clickable
Briefly tell about the internal structure of projects. There are conditionally two levels:
- low level, device polling. It is implemented by “Sources / Receivers” - some structural patterns that define various protocols, technologies and interfaces (Modbus RTU / TCP-IP, SNMP, DDE, OPC etc.) contain communication settings. In general, they are a software reflection of the periphery.
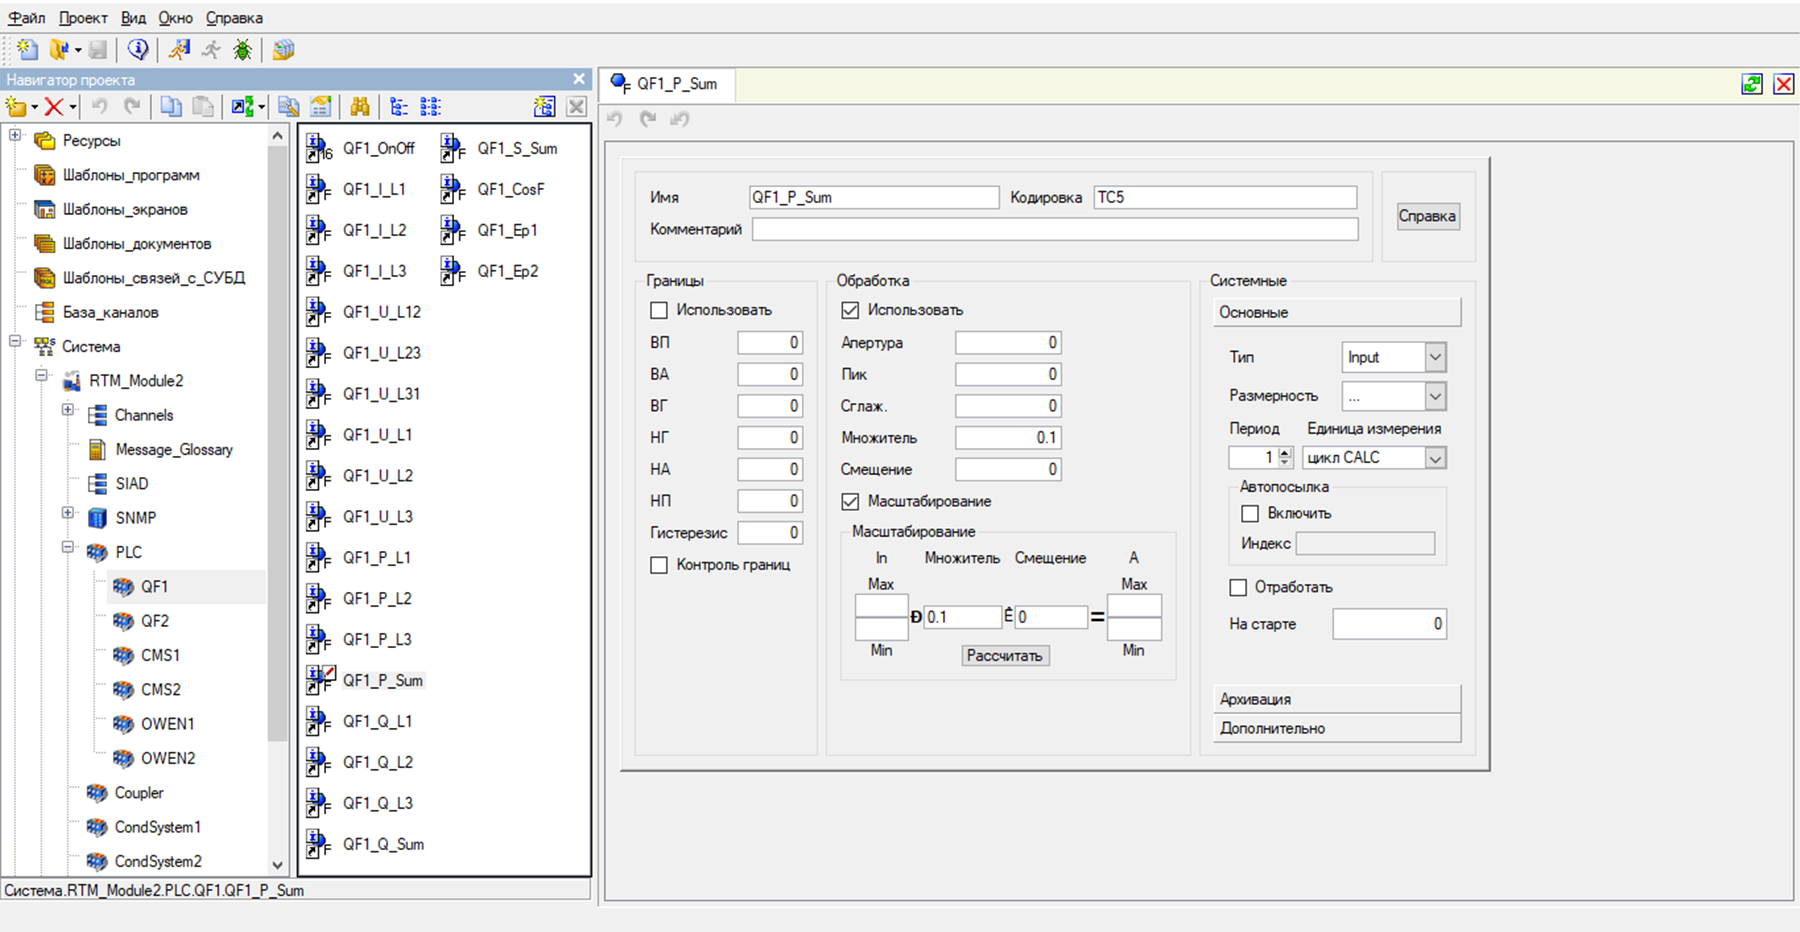
- top level tags. In Trace Mode, they are called Channels. These templates already determine the type of parameter received from the “Sources” (discrete / analog), set its scaling, alarm / pre-emergency limits (for analog signals), assign it to the alarm dictionaries, and finally, the “channels” determine whether this parameter to archive or not. Accordingly, these “channels” can be tied to operational monitoring to various graphic elements on mnemonic diagrams.
Trace Mode IDE. "Sources / Receivers". Clickable
Trace Mode IDE. "Channels". Clickable
This is the core of SCADA.
Of course, in Trace Mode there is also the possibility to write subroutines in generally accepted industrial languages (ST, LD, FBD), create reports, send SMS and E-mail.
On a note.
All products in the Trace Mode family are protected by HASP keys. The IDE requires its own key, which limits the number of data sources in the project (eg license for 128, 256, 512 ... N devices). To work the RTM requires its own key. It limits the maximum number of "channels" in the compiled project; In addition to the channels themselves, the subset of channels includes calls for programs and screen templates. The key also determines the availability of some technologies, in particular, we have the ability to run the OPC server Trace Mode. For client consoles that are used in AWPs, the key limits the number of screens (there are a dozen mimic diagrams in the project, and the key by ten? Two screens will not be called). Thin clients? Well, you understand the limitations on the number of simultaneous connections, document templates ...
Initially, monitoring from the integrator was pretty simple. The bare minimum: data on the status of input and auxiliary machines, data on energy consumption, readings of temperature sensors and humidity sensors, condition of air conditioners and UPS, and also (one of the most important parameters) - post-rack energy consumption calculation.
Since The system, of course, was imperfect and suffered from all kinds of flaws, it needed to be maintained and improved. Here on stage and your humble servant appears. My main task was to reduce the number of errors in the system to a minimum, and in the future, to add new
First of all, the monitoring system was “combed and licked”, namely: all kinds of “ochepyatki” were corrected, the order of numbers was adjusted (200 degrees Celsius in the cold corridor turn into 20.0), a consensus was found, what we measure in racks - in kW or nevertheless in kVA. Spoiler!
The second tier were strategic corrections. For example, in the initial version of the project of the first modular data center there was no indication of the status of its UPS, whether they were normal or disconnected in an emergency condition due to a breakdown. The list of possible emergencies and reports on many data center nodes was expanded. Mnemonic schemes are overgrown with various icons, indicators, and additional parameters, in general, with everything that should help to understand whether the data center is healthy or not.
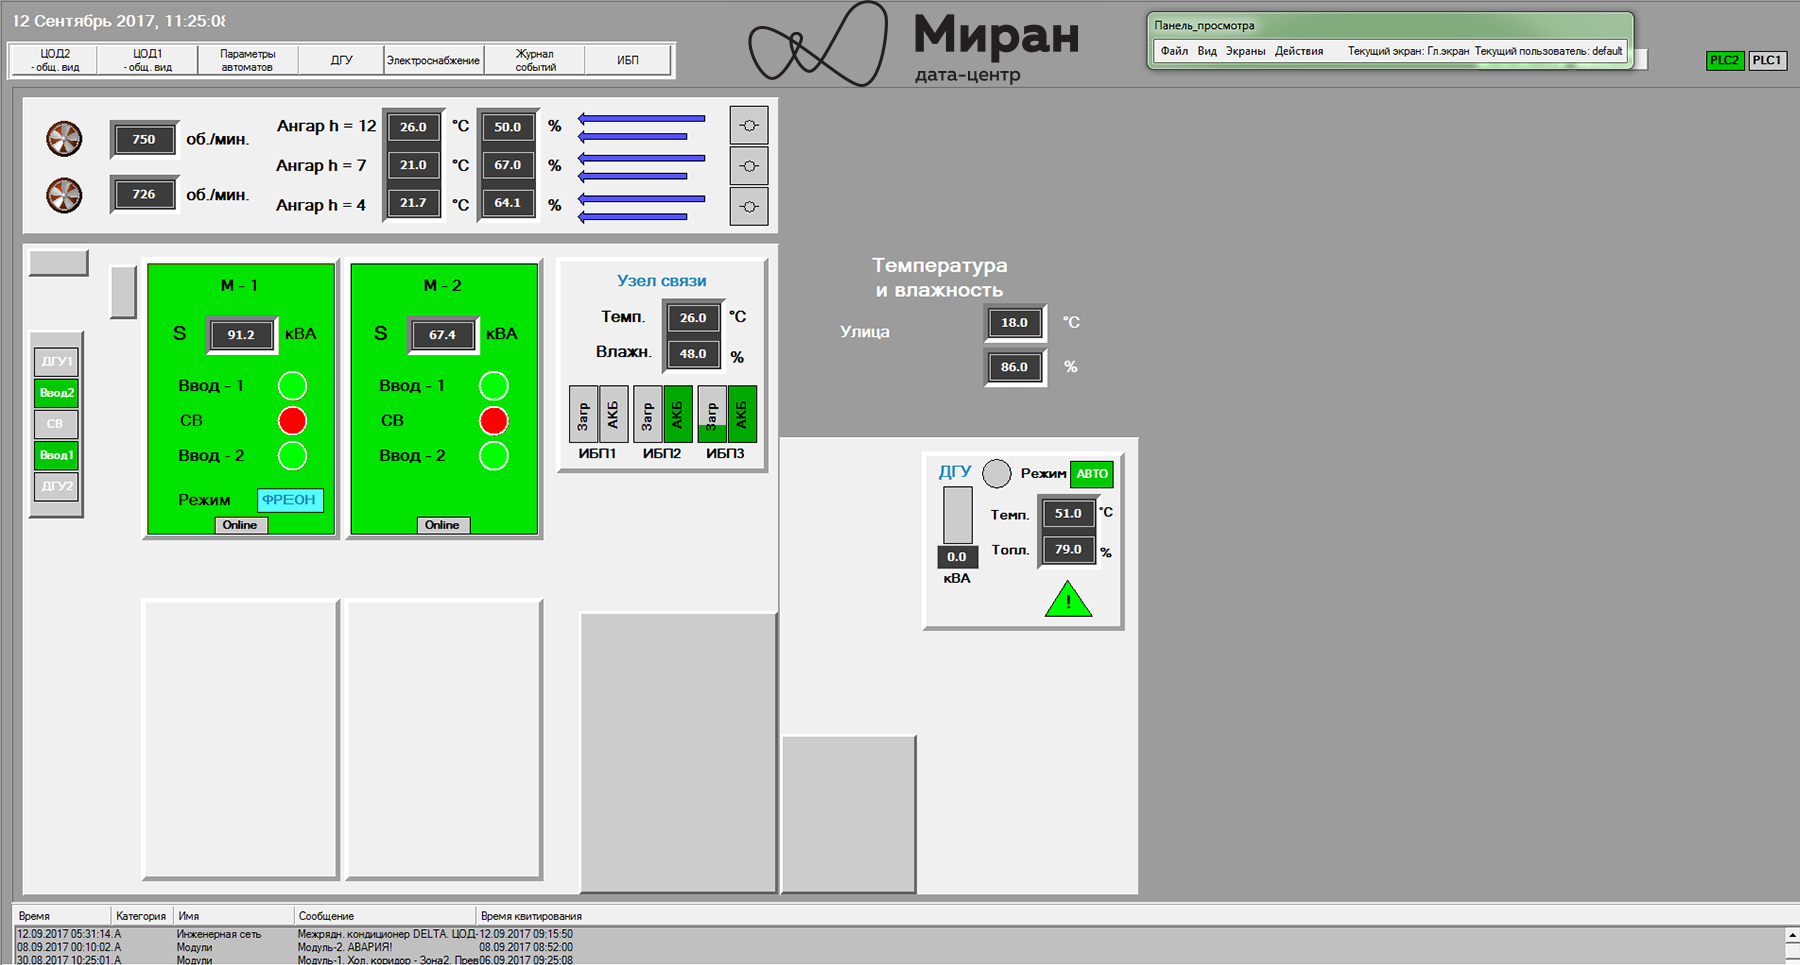
The main mnemonic of the data center Miran-2
The main mnemonic of the data center Miran-1
Mnemonic diagram of UPS status of Miran-2 communication center
Mnemoshema DGU-1 "Miran-2"
Pop-up mnemonic of modular data center "Module-2"
Huge panels with flashing mnemonic schemes are very cool and good, but the person on duty is still a person who is tired, forgotten and not noticed. Unfortunately, the mobile data center systems do not have an alarm log, so it was decided to implement the distribution of emergency letters, both to the service of the chief engineer and to the ticketing system of our technical support. Later, an alert siren was added to this.
Cool metrics and all-all-all
After a year of polishing Trace Mode projects, some kind of digestible compromise was reached between “we want beautiful, modern and cool” and “realized how we could and how it happened”. In general, the system coped with monitoring and alerting on the current state, but I also wanted to have the possibility of the simplest analysis of climate and power consumption.
Since Modular data center systems were equipped only with thin clients and they did not support graphs and trends (again), at least some analysis was performed in the form of daily reports to E-mails of the service of the chief engineer (with the simplest signs filled with mines). / max values for temperature and energy consumption racks). Visibility, however, still left much to be desired. In addition, the unstable work of Trace Mode's own archives from which this data was extracted became another stumbling block.
After going through several options for solving all this disgrace, it was decided to stop at the option with the shipment of data from Trace Mode to an external database for further processing.
When I wanted to start implementing the above option, our chief engineer came across the grafana site on the Internet . Together, having sighed over the beauty of the graphs, we agreed on the fact that to realize this for our needs on the current platform is difficult. Nevertheless, grafana firmly stuck in my head and I began to look for any guides with a description of the implemented solutions with her participation. Several articles on Habré became critical: 1 and 2 (Habr
Now the idea of how to implement all this for our needs has matured.
Under this whole case, a low-load blade server was allocated and a test Ubuntu with all the necessary software was deployed. After that, the turn came to fill in the collectd config for what and how to interrogate it. Below are some excerpts from the config. Nothing special, everything is strictly in accordance with the documentation on the daemon and plugins:
The contents of the configuration file for collectd
# Config file for collectd(1). # # Some plugins need additional configuration and are disabled by default. # Please read collectd.conf(5) for details. # # You should also read /usr/share/doc/collectd-core/README.Debian.plugins # before enabling any more plugins. Hostname "graphite" FQDNLookup true #BaseDir "/var/lib/collectd" #PluginDir "/usr/lib/collectd" TypesDB "/usr/share/collectd/types.db" "/etc/collectd/my_types.db" Interval 10 #Interval 60 #Timeout 2 #ReadThreads 5 LoadPlugin logfile LoadPlugin cpu LoadPlugin disk LoadPlugin memory LoadPlugin modbus // LoadPlugin snmp LoadPlugin write_graphite #LoadPlugin email #LoadPlugin sensors #LoadPlugin serial <Plugin logfile> LogLevel "info" File STDOUT Timestamp true PrintSeverity true </Plugin> <Plugin modbus> #DC2 VRU Data ------------------------------------------------- <Data "VRU-QF1-Status"> RegisterBase 380 RegisterType int16 Type word Instance "VRU-QF1-Status" </Data> <Data "VRU-QF2-Status"> RegisterBase 381 RegisterType int16 Type word Instance "VRU-QF2-Status" </Data> … <Data "VRU1-U-AN"> RegisterBase 300 RegisterType int16 Type voltage Instance "VRU1-U-AN" </Data> <Data "VRU1-U-BN"> RegisterBase 301 RegisterType int16 Type voltage Instance "VRU1-U-BN" </Data> <Data "VRU1-U-CN"> RegisterBase 302 RegisterType int16 Type voltage Instance "VRU1-U-CN" </Data> <Host "DC2_PLC"> Address "XXX.XXX.XXX.XXX" Port "502" Interval 5 <Slave 1> Instance "Vars" Collect "VRU-QF1-Status" Collect "VRU-QF2-Status" ... Collect "VRU1-U-AN" Collect "VRU1-U-BN" Collect "VRU1-U-CN" ... </Slave> </Host> <Plugin snmp> # DC2_Module1_UPS1 ------------------------------------------------- <Data "UPS1_load_A"> Type "percent" Table false Instance "Load_A" Values ".1.3.6.1.2.1.33.1.4.4.1.5.1" </Data> <Data "UPS1_load_B"> Type "percent" Table false Instance "Load_B" Values ".1.3.6.1.2.1.33.1.4.4.1.5.2" </Data> <Data "UPS1_load_C"> Type "percent" Table false Instance "Load_C" Values ".1.3.6.1.2.1.33.1.4.4.1.5.3" </Data> ... <Host "DC2_Module1_UPS1"> Address "XXX.XXX.XXX.XXX" Version 1 Community "public" Collect "UPS1_load_A" Collect "UPS1_load_B" Collect "UPS1_load_C" ... Interval 5 </Host> <Plugin write_graphite> <Carbon> Host "localhost" # Port "2003" Prefix "collectd." Protocol "tcp" # Postfix "collectd" # StoreRates false # AlwaysAppendDS false # EscapeCharacter "_" </Carbon> </Plugin> Include "/etc/collectd/collectd.conf.d/*.conf" Dashboard main ASU "Miran-2". Clickable
Dashboards with the most important parameters "Module-2". Clickable
Dashboards with climatic trends “Modul-2”. Clickable
Dashboards with trends in consumption of racks "Module-1". Clickable
Summing up
So, the current advantages of the decision on collectd + graphite + grafana in comparison with Trace Mode :
- Free (financial wipes a mean male tears of happiness).
- Open Source. You can theoretically add the missing feature by writing it yourself.
- Availability. In fact, this is a page in the browser for the end user, and, therefore, everyone has a gadget in his pocket. Trace Mode doesn’t have support for gadgets.
- Simplicity and convenience of expansion. It is enough during the initial configuration of collectd + graphite to “feed” it all the necessary data - and the subsequent metrics can be edited and converted on the fly to grafana. Say "No!" To compilations of RTM and client consoles in Trace Mode!
- Very good opportunities for displaying and analyzing graphs out of the box. Trace Mode in this regard is extremely, hmm, conservative.
- There are alerts and notifications about emergencies in all newfangled chatki, by mail, etc. Trace Mode can send E-mails and for a separate money - SMS (if you have the necessary hardware).
Minuses:
- Full-fledged SCADA cannot be replaced with such a bundle. No control of the technical process. If, of course, management is necessary for you.
- Open Source. Your humble servant does not have the proper qualifications for adding a hotelak, and therefore humbly waits and / or asks smarter comrades in the git-community.
- The set of panels is small (although it expands at the expense of plug-ins).
- The alert engine is still very simple, you can’t configure tricky conditions in it. The developers promise to expand the functionality.
So far, it has been decided to leave the monitoring system with a kind of hybrid from the classic SCADA Trace Mode with its client applications and servers as hidden from unauthorized cores with ACS and AFM and the outer wrapper grafana with beautiful and convenient metrics accessible to everyone within the corporate network. What we will come to in the end - time will tell, there are still enough engineering tasks.
I will be glad to questions. Thanks for attention!
Source: https://habr.com/ru/post/336222/
All Articles