Log storage for a cloud platform. ELK implementation experience

Hello! Today we will continue to talk about Technoserv Cloud cloud storage , but in terms of operation. No IT infrastructure is complete without monitoring and management tools, and our cloud is no exception. For everyday monitoring tasks, we use open source products, one of which is the ELK stack . In this article, we will explain how log monitoring is organized in our cloud, and how ELK helped us pass the PCI DSS audit.
The task of centralized collection and analysis of logs can arise at any stage of the product life cycle. In the case of Technoserv Cloud's cloud storage, the need for a single console to view logs became apparent even before launching the solution into operation; at the start of the project, a tool was needed to quickly identify problems in the systems used. As such a tool, the ELK stack was chosen - an easy to configure and use open source product with the ability to scale.
ELK is the main tool of our engineers for viewing platform logs: Elasticsearch collects logs from all servers and network equipment in use. We are convinced that there is not a lot of logs, so our systems make log entries with the maximum level of debugging. To receive events, use Beats : filebeat and winlogbeat, syslog and SNMP traps. Networking also collects Netflow traffic information. To date, our ELK stack processes around 1000 incoming entries per second with peaks up to 10,000 entries, while the provisional resources should be enough for a 2- / 3-fold increase in the flow of logs.
Architecture
Reliability is one of the key requirements for the systems used. For this reason, ELK was installed in a fault-tolerant configuration: it is important for us to be sure that the logs will continue to be collected if some of the servers are unavailable.
| VM number | Purpose | Used software |
|---|---|---|
| 2 | Load balancers | Keepalived + HAproxy + nginx |
| four | Receive and process incoming logs | Logstash |
| 3 | Master nodes of Elasticsearch cluster | Elasticsearch |
| 6 | Data nodes of Elasticsearch cluster | Elasticsearch |
| one | User interface | Kibana |
This is the architecture of our ELK installation:

Implementation
HAproxy and nginx are used as traffic balancers, their fault tolerance is achieved using keepalived , an application implementing the VRRP (Virtual Router Redundancy Protocol) routing protocol. Keepalived is configured in a simple configuration from the master and backup node, so incoming traffic comes to the node that currently owns the virtual IP address. Further traffic balancing in Logstash and Elasticsearch is performed using the round-robin algorithm (we still use simple solutions).
For Logstash and Elasticseach, fault tolerance is achieved by redundancy: the system will continue to operate correctly even in the event of the failure of several servers. Such a scheme is easy to configure and allows you to easily scale each of the installed components of the stack.
Now we use four Logstash servers, each of which performs a full cycle of input data processing. In the near future, we plan to split the Logstash servers according to the Input and Filter roles, and also add a RabbitMQ cluster to buffer the data sent from Logstash. Using a message broker will eliminate the risk of data loss in the event of a disconnection between Logstash and Elasticsearch.
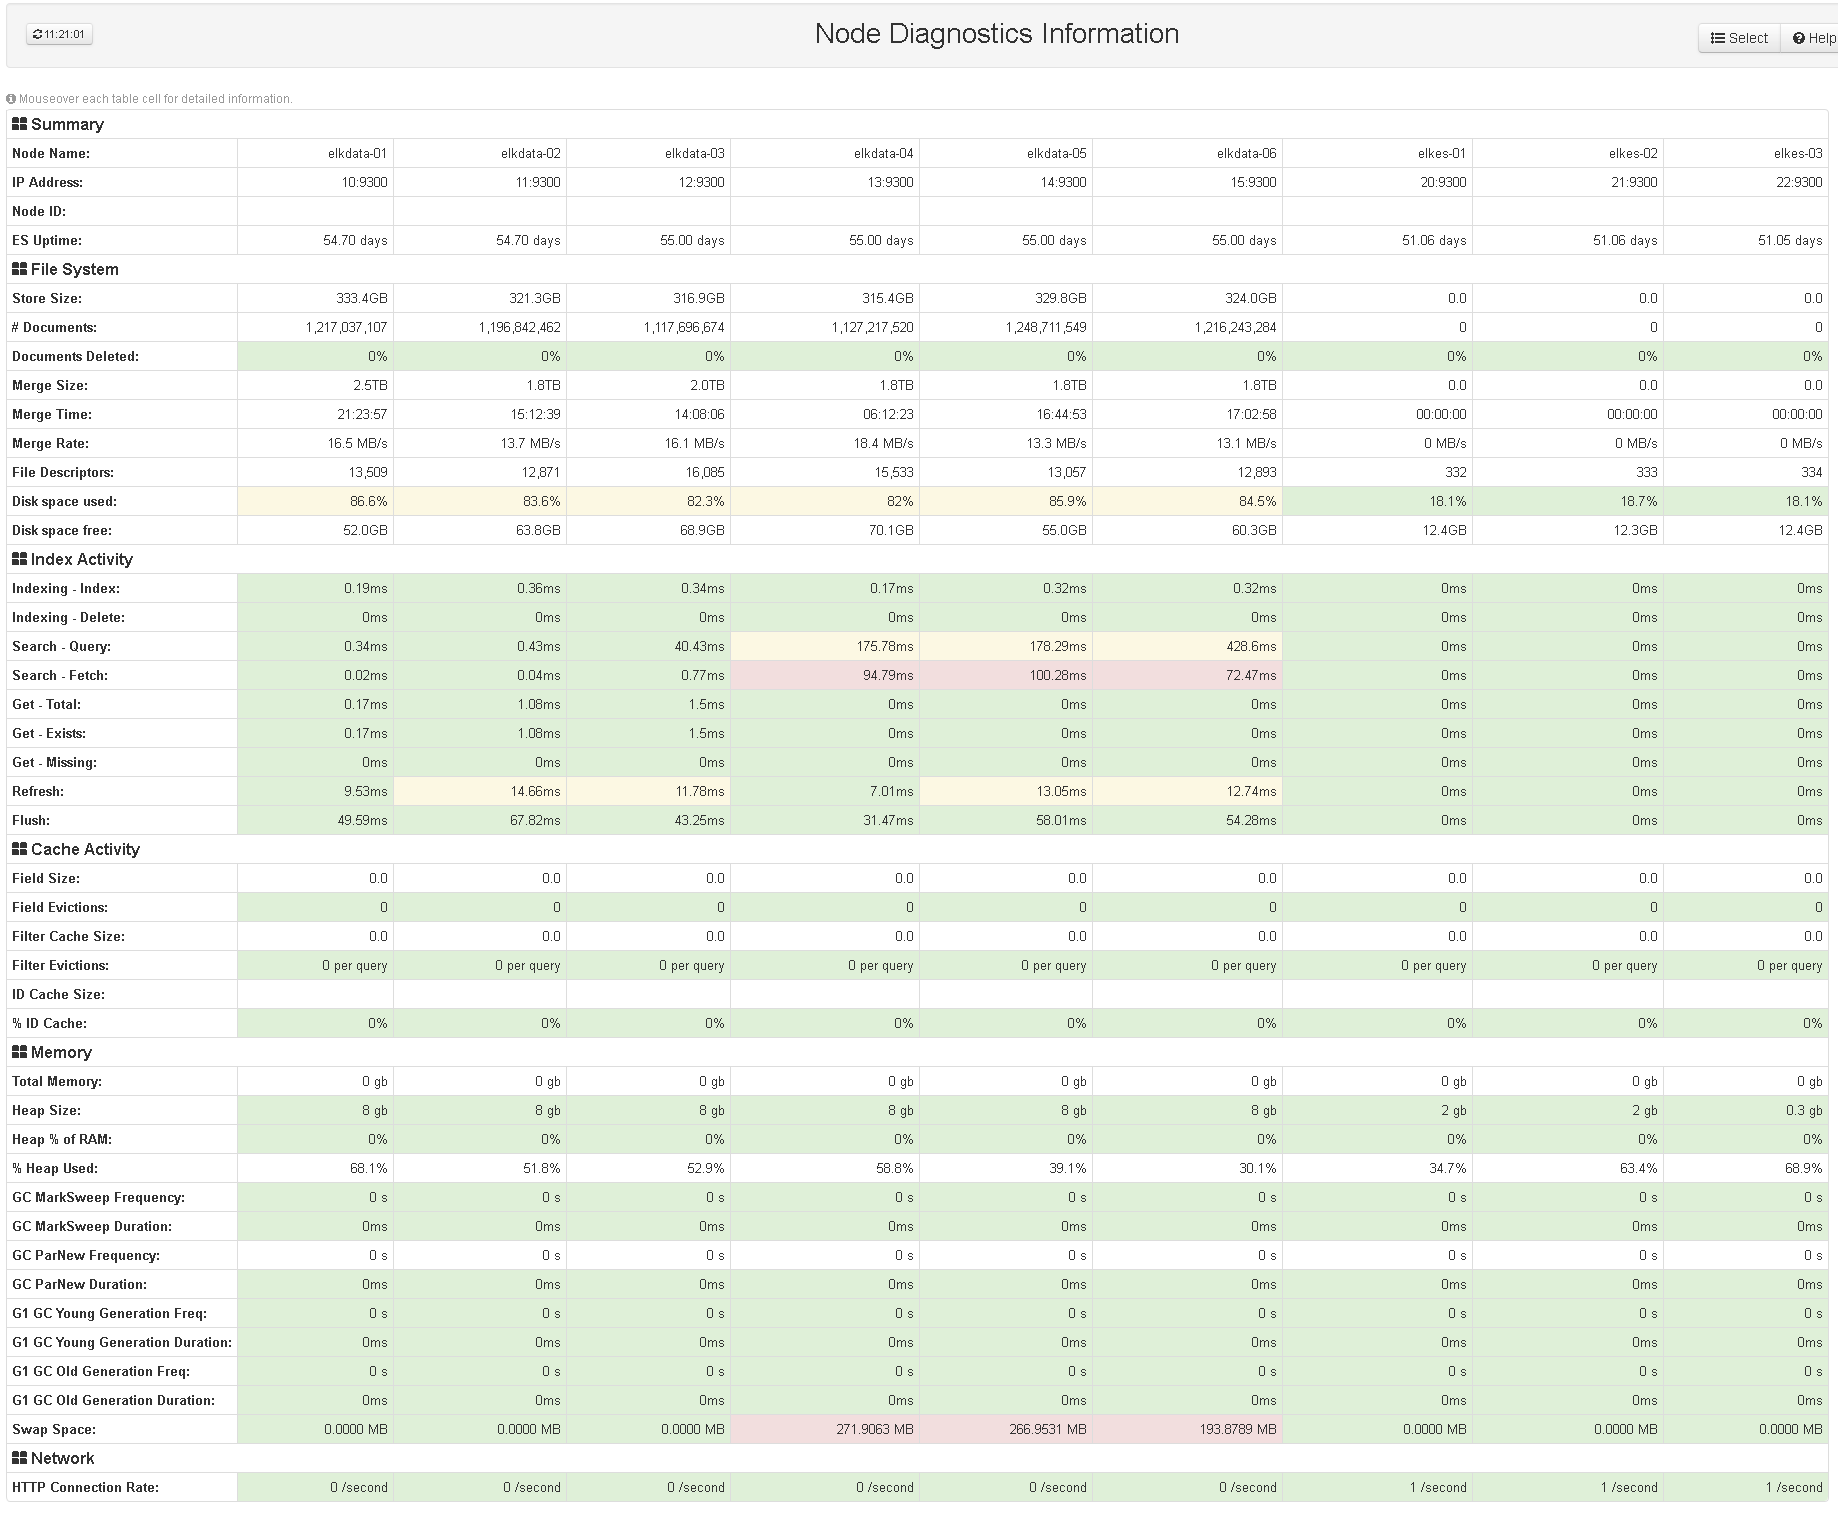
The configuration of Elasticsearch is also simple, we use three master nodes and six data nodes.
Kibana is the only component that is not reserved, since the exit of the "kibana" from the system does not affect the processes of collecting and processing logs. To restrict access to the console, the kibana-auth-plugin is used , and with the help of the Elastic HQ plugin we can monitor the status of the Elasticsearch cluster in the web interface.
Netflow
As noted above, in addition to logs, we collect Netflow statistics using the boxst plugin logstash . Customized views help on-duty administrators obtain current traffic data. It is an important tool for diagnosing network problems, since Netflow allows you to get detailed information about traffic flows within a network in cases where the network equipment logs are not enough. The screenshot below shows the Kibana view for Netflow: diagrams show the addresses involved in traffic exchanges and the amount of received / transmitted data.

')
IS event control
In May of this year, we solved the task of passing the PCI DSS certification - the data security standard of the payment card industry. One of the requirements for compliance with this standard is the availability of an information security event monitoring system. At the time of certification, the ELK stack was already working and collecting data from most of the equipment in use, so it was decided to use it as an information security event monitoring system. In preparation for the audit, all system components of Technoserv Cloud were configured to send security events to ELK, including the following:
• any access to customer data;
• all actions performed with the use of administrative authority on servers and network equipment of the cloud platform;
• any access to the event logs of Technoserv Cloud system components;
• any user access to the system components of the platform;
• add, change and delete accounts;
• starting and stopping system components of the platform;
• creation and deletion of system level objects.
To demonstrate the presence of the above events in the system, Kibana views were prepared. The screenshots below show attempts by users to access our servers and records about the execution of commands from under sudo.

Recorded unsuccessful access attempts
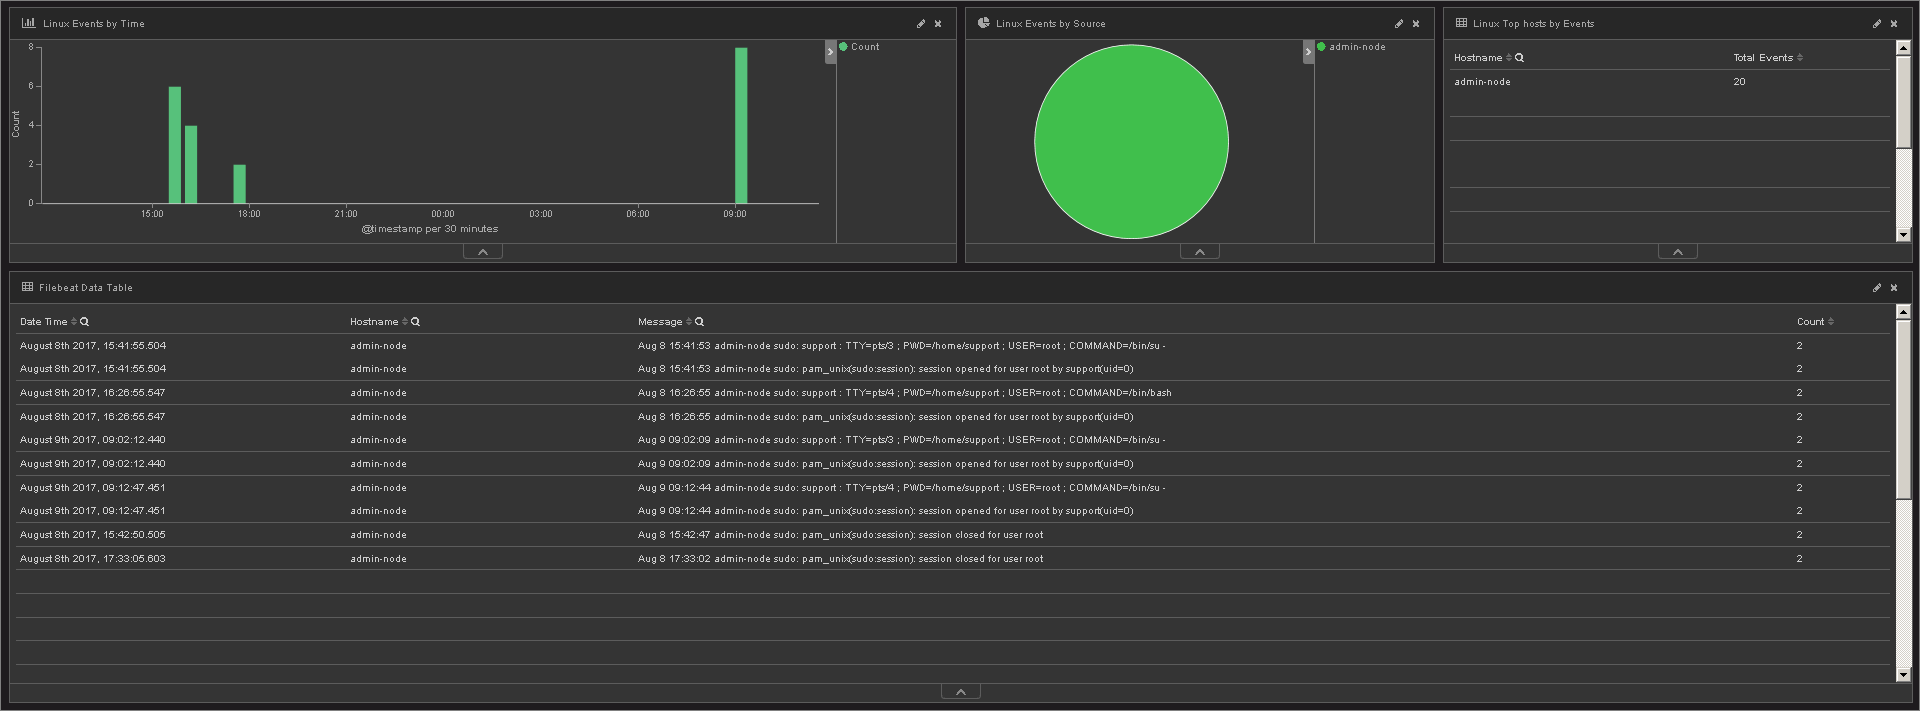
Execution of commands on behalf of the superuser
Summing up
A centralized console for working with events allows you to effectively manage your IT infrastructure. In our case with ELK we achieved the following goals:
• using a single console for working with log entries, reduced the time to diagnose problems and, therefore, reduced the time of service unavailability;
• using Kibana views to get information about the platform as a whole;
• implemented PCI DSS requirements for recording and storing security events.
Source: https://habr.com/ru/post/336154/
All Articles