We measure the dynamics of mentioning entities in the information field
Today we will show dashboards with visualization of data on the dynamics of popular entities, we will start a separate instance for Habr users and give it the opportunity to monitor their own indicators by adding a regular schedule.
Read more about what's going on here.
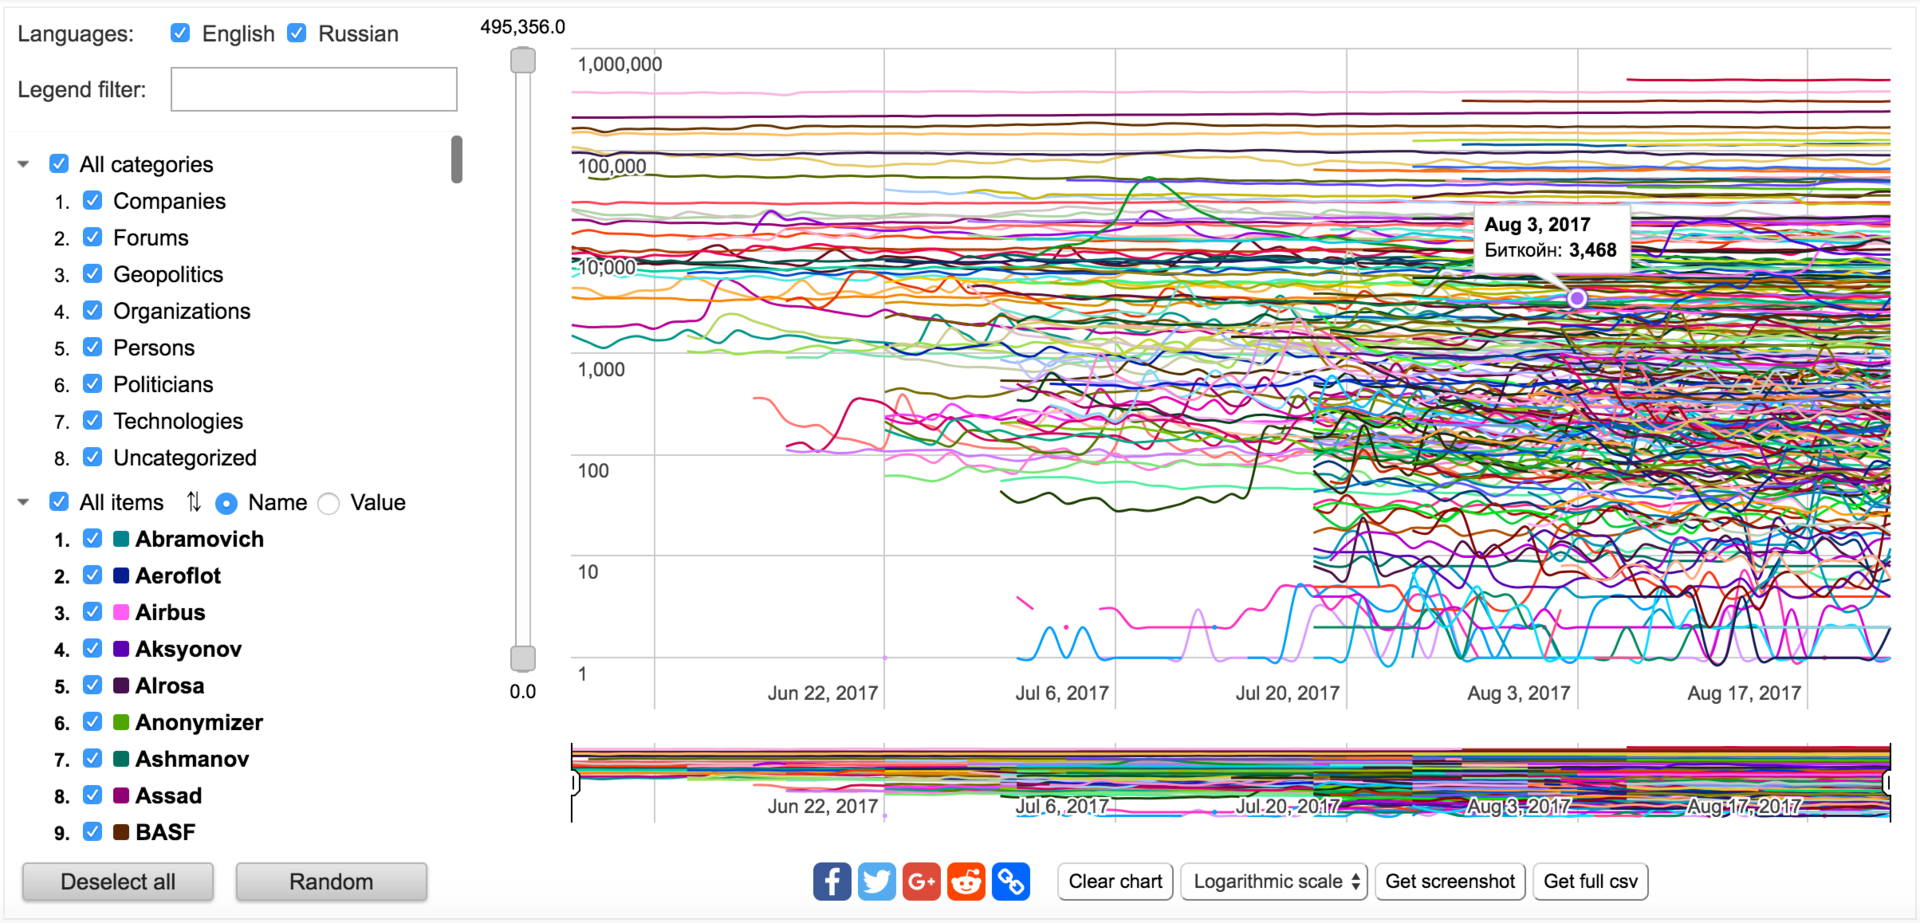
We are studying the Internet, in particular, we have the opportunity to bypass all registered domains of the world in the face and process information in a day. The product is quite complex and, in general, to popularize the study of open data, we launched an instance that scans the top 1 million sites in the world every day according to Alex, computes the content of 300+ regulars and displays the figures on a dashboard.
To understand the interest earlier, an article was published, the results of a survey which we could not but rejoice:
')
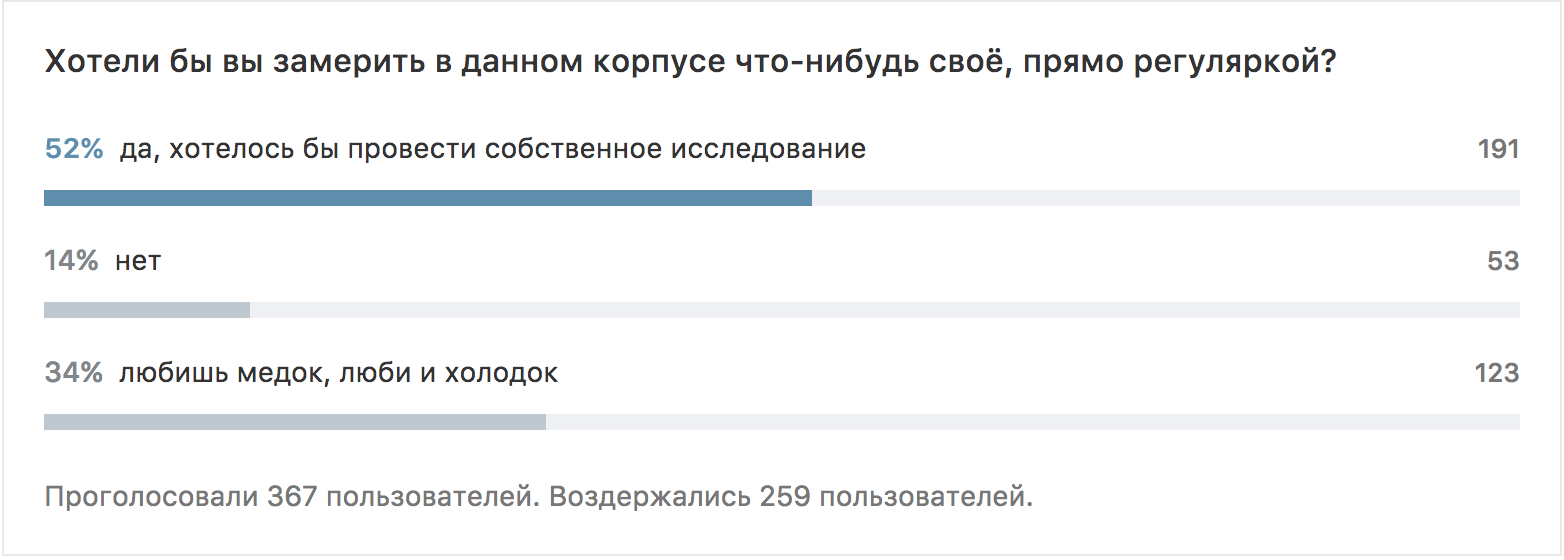
Despite the frankly yellow headline, the article received a fairly good rating, but the main thing:
- 191 (52%) - clearly expressed their desire to conduct a study
- 123 (34%) - we put you in your gang
- 53 (14%) - ok, but you go, if that
Central Asia - 314 users of Habr, we could not leave you without attention and went to cut dashboards under this disco.
Dashboard we posted on the website statoperator.com
In order to measure our own indicators, you had something to compare them with - we laid out in open access the data on the existing entities over a couple of months.
- instans daily, at 19:00 Moscow time, bypassing the list of sites top 1,000,000 (per hour)
- each successful response of the web server is dealt with by all those regulars by the entities that you now see in the legend + those that you add yourself
All indicators and settings when working in dashboard prokkiruyutsya in url.
How to add a regular season?
Fill the form
Data source - header / html / text (in the response header of the web server / in the html code / in the selected text from the document)
Regex type - regular season type: mentions / hosts (amount of what is in the regular session document / something was found or not)
JAVA regex - regular
It's convenient to test here.
All adequate regulars will appear dashboards after the next iteration.
Source: https://habr.com/ru/post/336144/
All Articles