Zabbix 3.4 released
Hello! We want to share the news that we have a new version of the open source monitoring system Zabbix 3.4, available for download :

From the new:
')
and many many others.
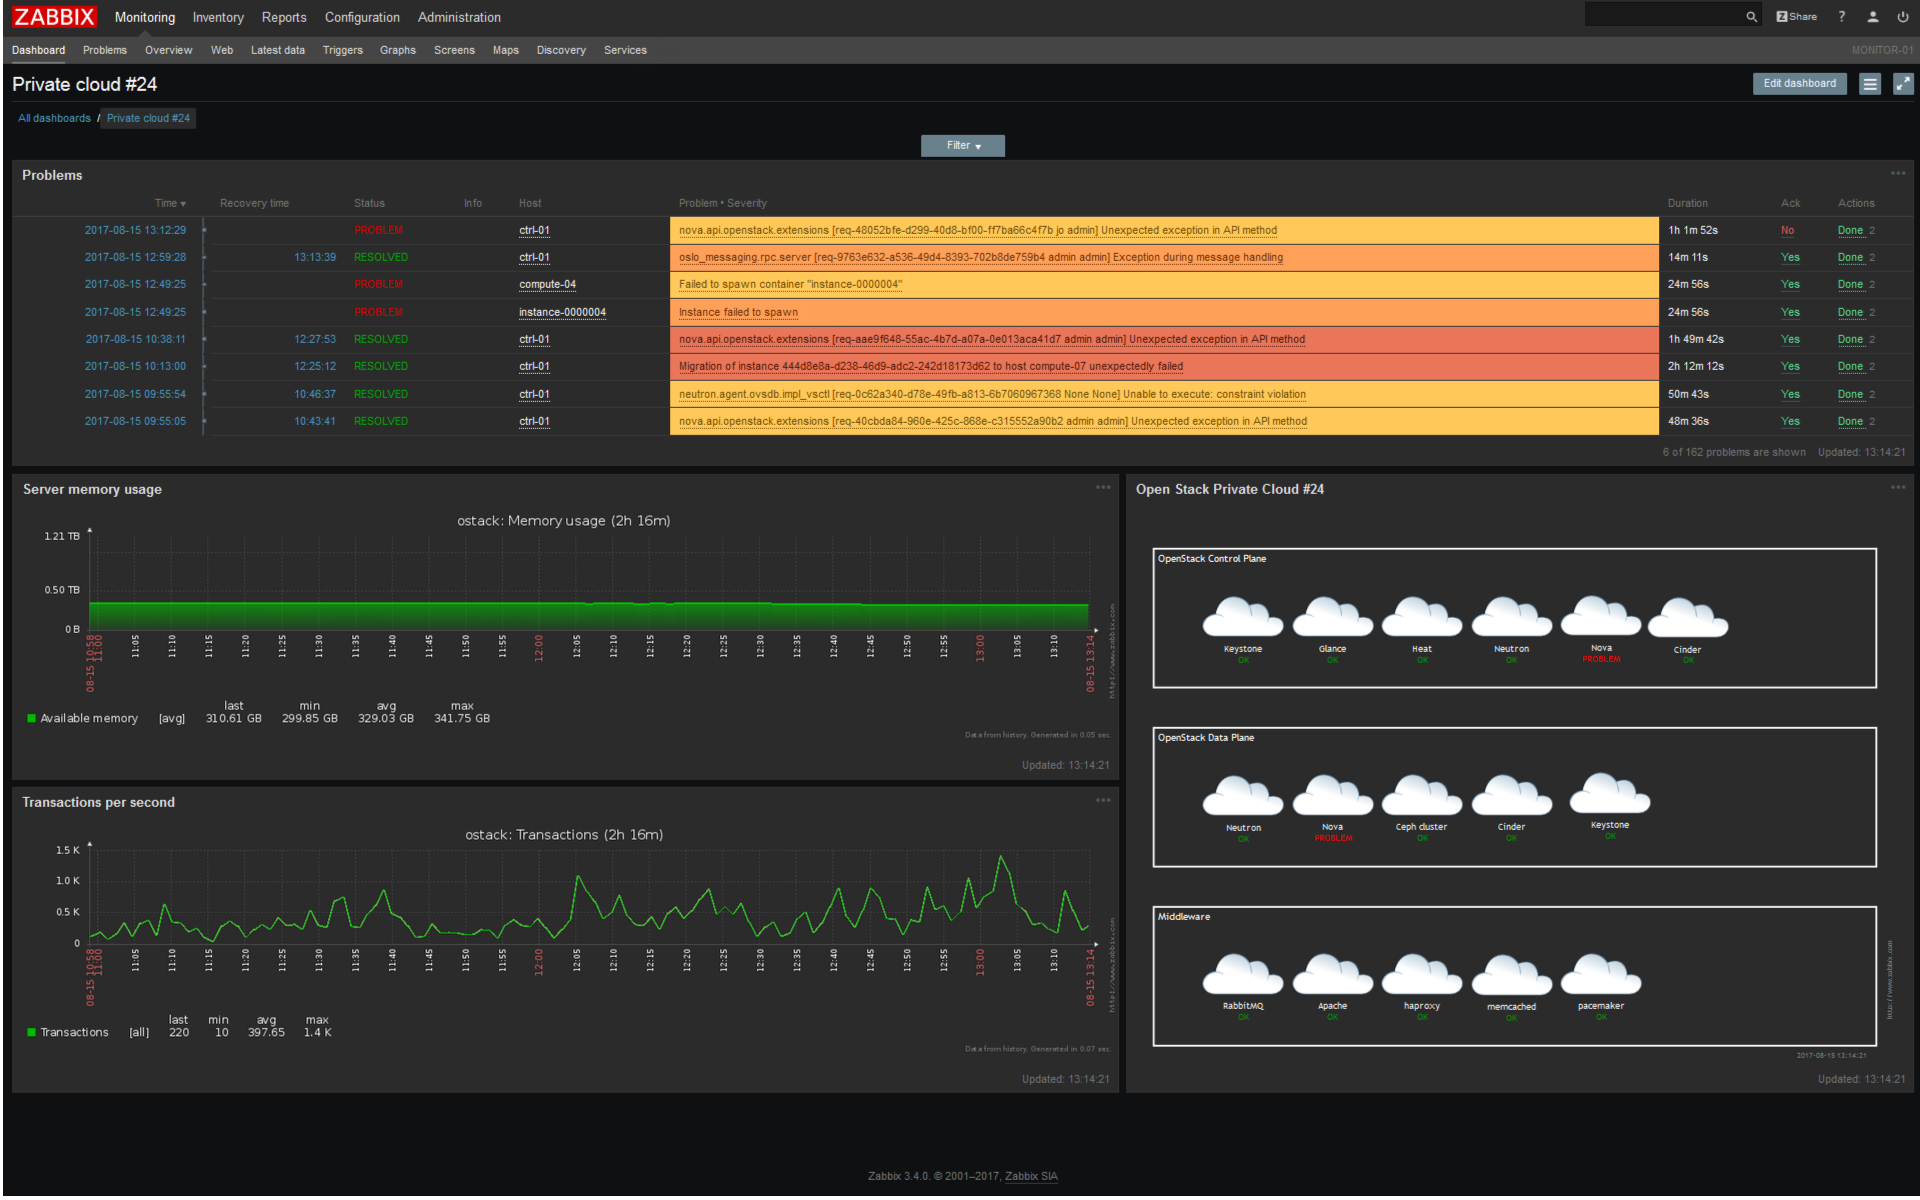
In 3.4, new dashboards appeared in Zabbix instead of the old one. With the support of drag-n-drop, resize, with improved filtering, they are created from the basic graphic elements available in Zabbix from other sections (such as graphics, maps, lists of problems, as well as everything that was available in complex screens). Users can create dashboards for themselves, but you can also share them with each other. API for creating dashboards included.
Read more in the documentation .
Remember the case when the hardware vendor XYZ gives the temperature of the text "25 C", but we need a number (we really like graphics and triggers)?
Now we don’t need any extra movements, in preprocessing we just cut off the extra, using various preprocessing functions: starting from simple Trim, Regular Expressions and ending with extracting necessary data from JSON, XML using JSON Path and XPath, respectively.
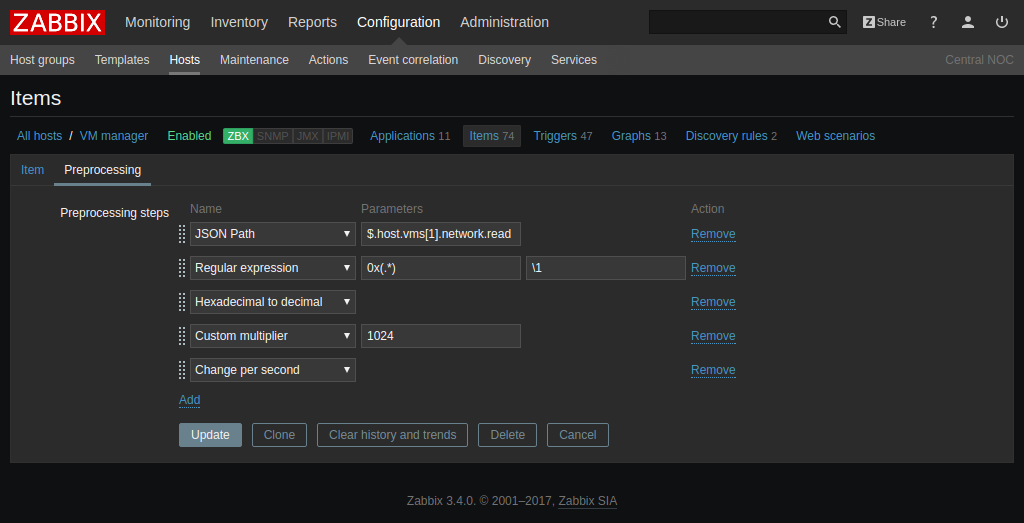
Read more in our documentation .
The previous possibility of preprocessing is perfectly combined with dependent data elements :
Collect data with a single master element, and then decompose into multiple dependent elements using preprocessing functions such as regex, XPath, or JSON Path to select the desired element. All dependent elements will be updated simultaneously, and the remote service that we monitor will be polled only once.
Now it is possible to execute scripts and remote commands on those hosts that are monitored via Zabbix proxy. The command can be executed via Zabbix agent or on Zabbix proxy. By default, only IPMI, Telnet and SSH commands are executed, and allowing the rest of the commands to be executed is easy enough, if required.
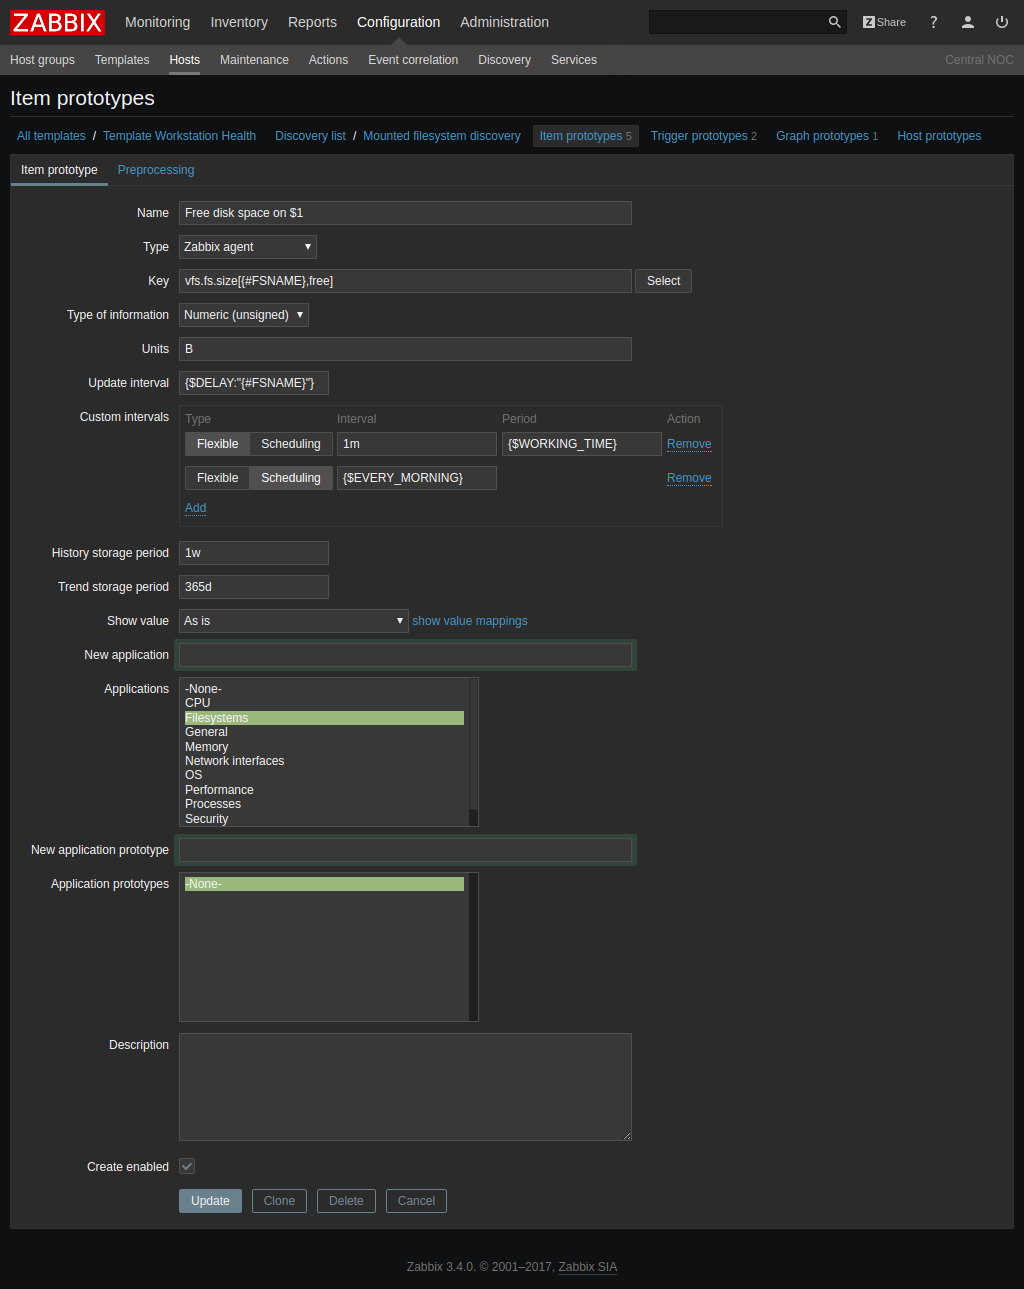
It is now easier to manage data item polling intervals with support for custom macros and time suffixes such as 30s, 5m, 2h, 1d, 1w.
Simply changing the value of the macro and the update interval, the storage period of the history or trends will immediately change in all data elements where this macro is used. In addition, low-level detection macros can be used in polling or storage intervals of prototype data elements. Context macros are also supported at intervals!
A small example of what can be done:
• Set up the working time as a macro:
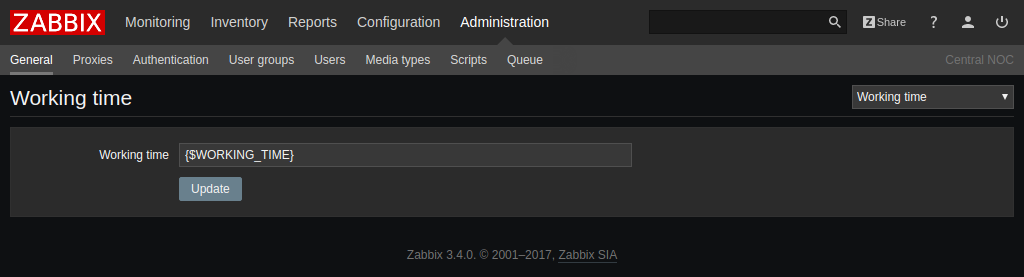
• Define the macro itself:
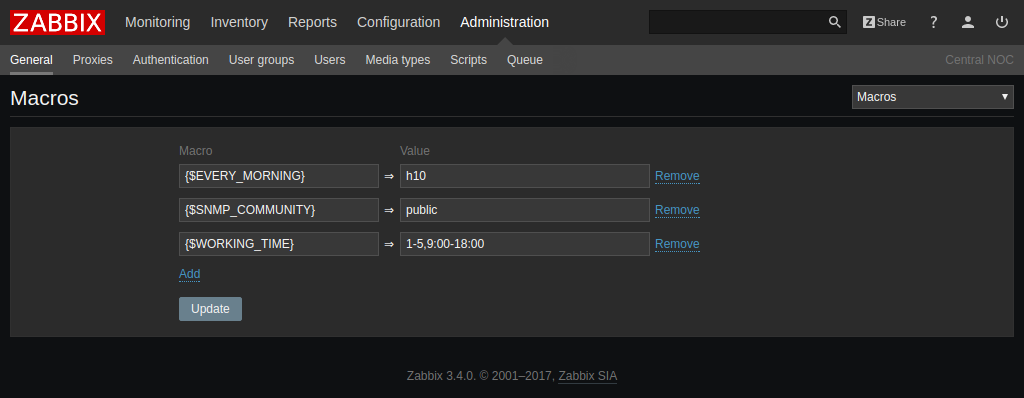
• We use a macro together with the time suffix immediately in user intervals, update intervals and in storage periods:
To monitor out of the box, we begin to build up a collection of templates that implement monitoring of basic metrics. In 3.4, network device templates are available from many manufacturers, such as Cisco, Juniper, Huawei, Mikrotik, Dell, Brocade, D-Link, HP and others, which monitor SNMP for processors, memory, network interfaces, temperature, power supplies by fans. Basic inventory data is also collected.
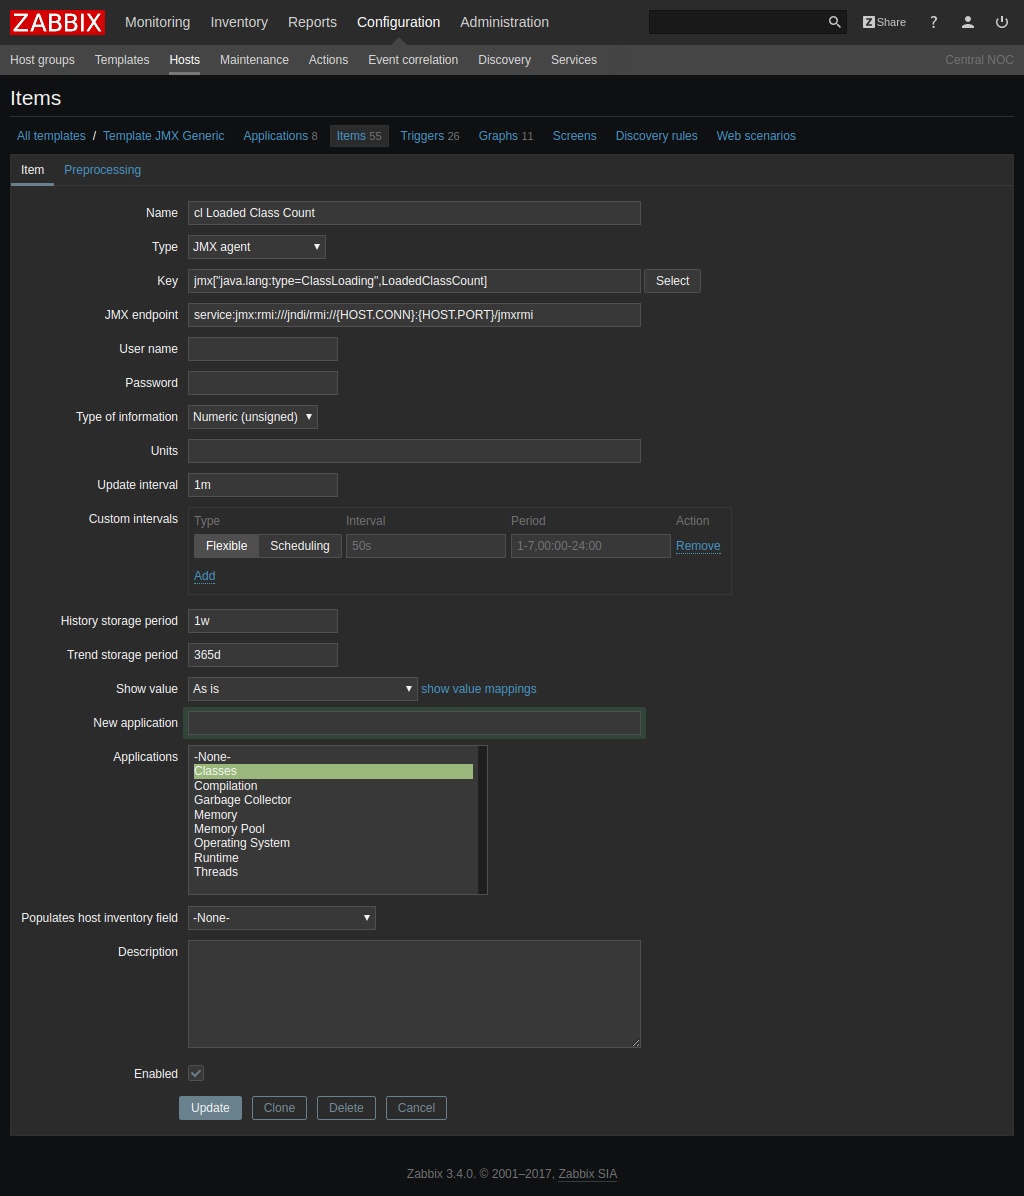
The following news will appeal to everyone who monitors Java applications, including those who previously used various tricks to monitor JMX. For JMX monitoring, a special parameter has appeared that allows you to explicitly specify which URI to apply for data (should help with recent versions of JBoss, for example). All possible macros starting with {HOST. *} Are supported. Flexibility.
The new
Zabbix server itself also did not stand aside and has been improved. A lot ofboring changes:
• Increase the size of the SNMP trapper file
• Optimization of the Zabbix server and Zabbix proxy exchange protocol.
• More efficient synchronization of the configuration cache
... and much more .
To talk more substantively, below is the configuration cache synchronization timeline.

At 13:35 we switched to Zabbix 3.4. Well, then see for yourself. No more extra brakes.
We continue to comb and make the frontend more comfortable and friendly:
• increased the size of various fields
• unified checkbox style
And most importantly added the functionality of full cloning of maps and complex screens. It will come in handy.
When setting access rights to host groups, an opportunity has appeared that allows you to apply access rights to all nested groups. Also useful.

And Internet Explorer 9 and 10 are no longer supported. So it goes.
Now you can receive notifications from Zabbix at the moment when the problem was confirmed by someone, such as an operator.
There was also an interesting possibility that if a user left a comment in a problem, he would be able to receive notifications of all subsequent comments.
www.zabbix.com/documentation/3.4/manual/config/notifications/action/acknowledgement_operations
Read more on the link .
Sending notifications in Zabbix 3.4 is getting better - several parallel-running worker-processes are engaged in sending notifications under the supervision of an alert-manager.
At the same time, for each notification method, be it SMS, mail or favorite instant messenger, you can separately configure the maximum number of processes, however, it is important to know that the maximum number of sessions is limited by the StartAlerters configuration parameter on the Zabbix server.

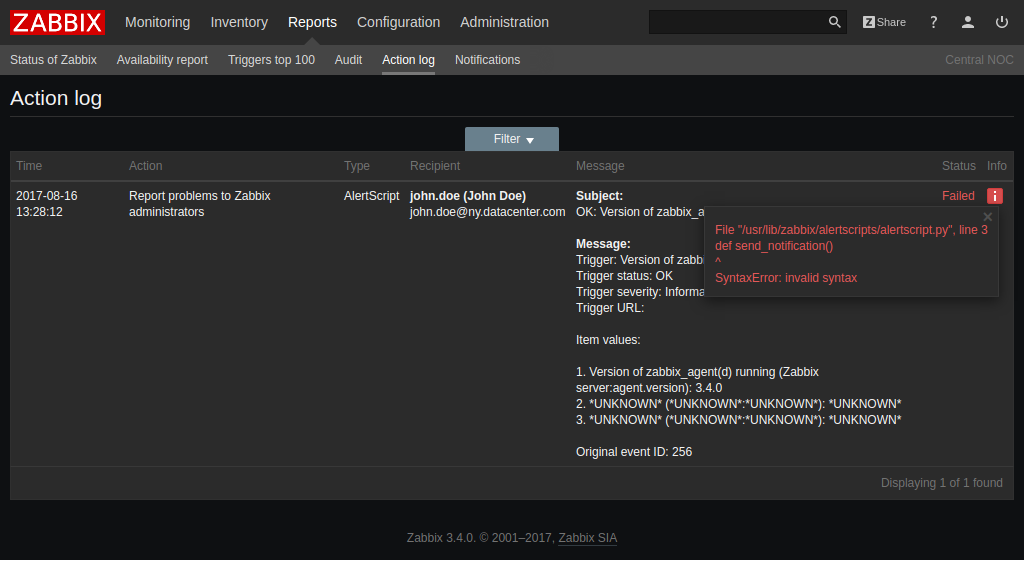
Another innovation that has long been suggested. Errors when collecting data through UserParameters, when running remote commands, or when running alerts through scripts are available in the web interface. Now it will become much easier to work with existing scripts or write your own - it will be immediately clear that, for example, the notification has not been sent, and why.
The version itself is available for download here , and for more complete information about new features, see our documentation in the Whats new section, including, for example, IPMI optimization or support for {HOST. *} Macros in event tags.
For those who are going to upgrade from previous versions to 3.4, we offer instructions for updating, or you can contact us for help .
And we invite you to sign up for our free webinars - a good opportunity to learn more about Zabbix and ask your questions.
From the new:
')
- Recycled dashboards (there are a lot of them and they can be edited)
- Bulk, simultaneous collection of data items
- Parsing received data, including Regexp, XPath, JSON Path
- Execution of remote commands through a proxy
- Network device templates out of the box
- Low level detection for JMX
- New notification features
- Recycled IPMI data collection
and many many others.
New Dashboards
In 3.4, new dashboards appeared in Zabbix instead of the old one. With the support of drag-n-drop, resize, with improved filtering, they are created from the basic graphic elements available in Zabbix from other sections (such as graphics, maps, lists of problems, as well as everything that was available in complex screens). Users can create dashboards for themselves, but you can also share them with each other. API for creating dashboards included.
Read more in the documentation .
Preprocessing
Remember the case when the hardware vendor XYZ gives the temperature of the text "25 C", but we need a number (we really like graphics and triggers)?
Now we don’t need any extra movements, in preprocessing we just cut off the extra, using various preprocessing functions: starting from simple Trim, Regular Expressions and ending with extracting necessary data from JSON, XML using JSON Path and XPath, respectively.
Read more in our documentation .
Simultaneous data collection. Dependent Data Items
The previous possibility of preprocessing is perfectly combined with dependent data elements :
Collect data with a single master element, and then decompose into multiple dependent elements using preprocessing functions such as regex, XPath, or JSON Path to select the desired element. All dependent elements will be updated simultaneously, and the remote service that we monitor will be polled only once.
Execution of remote commands through a proxy
Now it is possible to execute scripts and remote commands on those hosts that are monitored via Zabbix proxy. The command can be executed via Zabbix agent or on Zabbix proxy. By default, only IPMI, Telnet and SSH commands are executed, and allowing the rest of the commands to be executed is easy enough, if required.
Managing collection and storage intervals through macros
It is now easier to manage data item polling intervals with support for custom macros and time suffixes such as 30s, 5m, 2h, 1d, 1w.
Simply changing the value of the macro and the update interval, the storage period of the history or trends will immediately change in all data elements where this macro is used. In addition, low-level detection macros can be used in polling or storage intervals of prototype data elements. Context macros are also supported at intervals!
A small example of what can be done:
• Set up the working time as a macro:
• Define the macro itself:
• We use a macro together with the time suffix immediately in user intervals, update intervals and in storage periods:
New network device templates
To monitor out of the box, we begin to build up a collection of templates that implement monitoring of basic metrics. In 3.4, network device templates are available from many manufacturers, such as Cisco, Juniper, Huawei, Mikrotik, Dell, Brocade, D-Link, HP and others, which monitor SNMP for processors, memory, network interfaces, temperature, power supplies by fans. Basic inventory data is also collected.
Custom JMX endpoints and low-level detection for JMX
The following news will appeal to everyone who monitors Java applications, including those who previously used various tricks to monitor JMX. For JMX monitoring, a special parameter has appeared that allows you to explicitly specify which URI to apply for data (should help with recent versions of JBoss, for example). All possible macros starting with {HOST. *} Are supported. Flexibility.
The new
jmx.discovery[*] discovery allows you to specify whether MBeans or their attributes should be detected, as well as which template to search for. Read on here .Various server improvements
Zabbix server itself also did not stand aside and has been improved. A lot of
• Increase the size of the SNMP trapper file
• Optimization of the Zabbix server and Zabbix proxy exchange protocol.
• More efficient synchronization of the configuration cache
... and much more .
To talk more substantively, below is the configuration cache synchronization timeline.
At 13:35 we switched to Zabbix 3.4. Well, then see for yourself. No more extra brakes.
Various improvements to the web interface
We continue to comb and make the frontend more comfortable and friendly:
• increased the size of various fields
• unified checkbox style
And most importantly added the functionality of full cloning of maps and complex screens. It will come in handy.
When setting access rights to host groups, an opportunity has appeared that allows you to apply access rights to all nested groups. Also useful.
And Internet Explorer 9 and 10 are no longer supported. So it goes.
Confirmation Notifications
Now you can receive notifications from Zabbix at the moment when the problem was confirmed by someone, such as an operator.
There was also an interesting possibility that if a user left a comment in a problem, he would be able to receive notifications of all subsequent comments.
www.zabbix.com/documentation/3.4/manual/config/notifications/action/acknowledgement_operations
Read more on the link .
Parallel alert processing
Sending notifications in Zabbix 3.4 is getting better - several parallel-running worker-processes are engaged in sending notifications under the supervision of an alert-manager.
At the same time, for each notification method, be it SMS, mail or favorite instant messenger, you can separately configure the maximum number of processes, however, it is important to know that the maximum number of sessions is limited by the StartAlerters configuration parameter on the Zabbix server.
Exit code check
Another innovation that has long been suggested. Errors when collecting data through UserParameters, when running remote commands, or when running alerts through scripts are available in the web interface. Now it will become much easier to work with existing scripts or write your own - it will be immediately clear that, for example, the notification has not been sent, and why.
Try Zabbix 3.4 now
The version itself is available for download here , and for more complete information about new features, see our documentation in the Whats new section, including, for example, IPMI optimization or support for {HOST. *} Macros in event tags.
For those who are going to upgrade from previous versions to 3.4, we offer instructions for updating, or you can contact us for help .
And we invite you to sign up for our free webinars - a good opportunity to learn more about Zabbix and ask your questions.
Source: https://habr.com/ru/post/336084/
All Articles