“Java-developers do not realize the problem with profilers”: Andrey Pangin and Nitsan Vakart about Java profiling

It is easy to think that you should not expect big news from profiling: since developers have been profiling for decades, how could you not even figure it out? But in Java profiling, serious pitfalls lie like safepoint bias, and new tools are emerging to solve such problems.
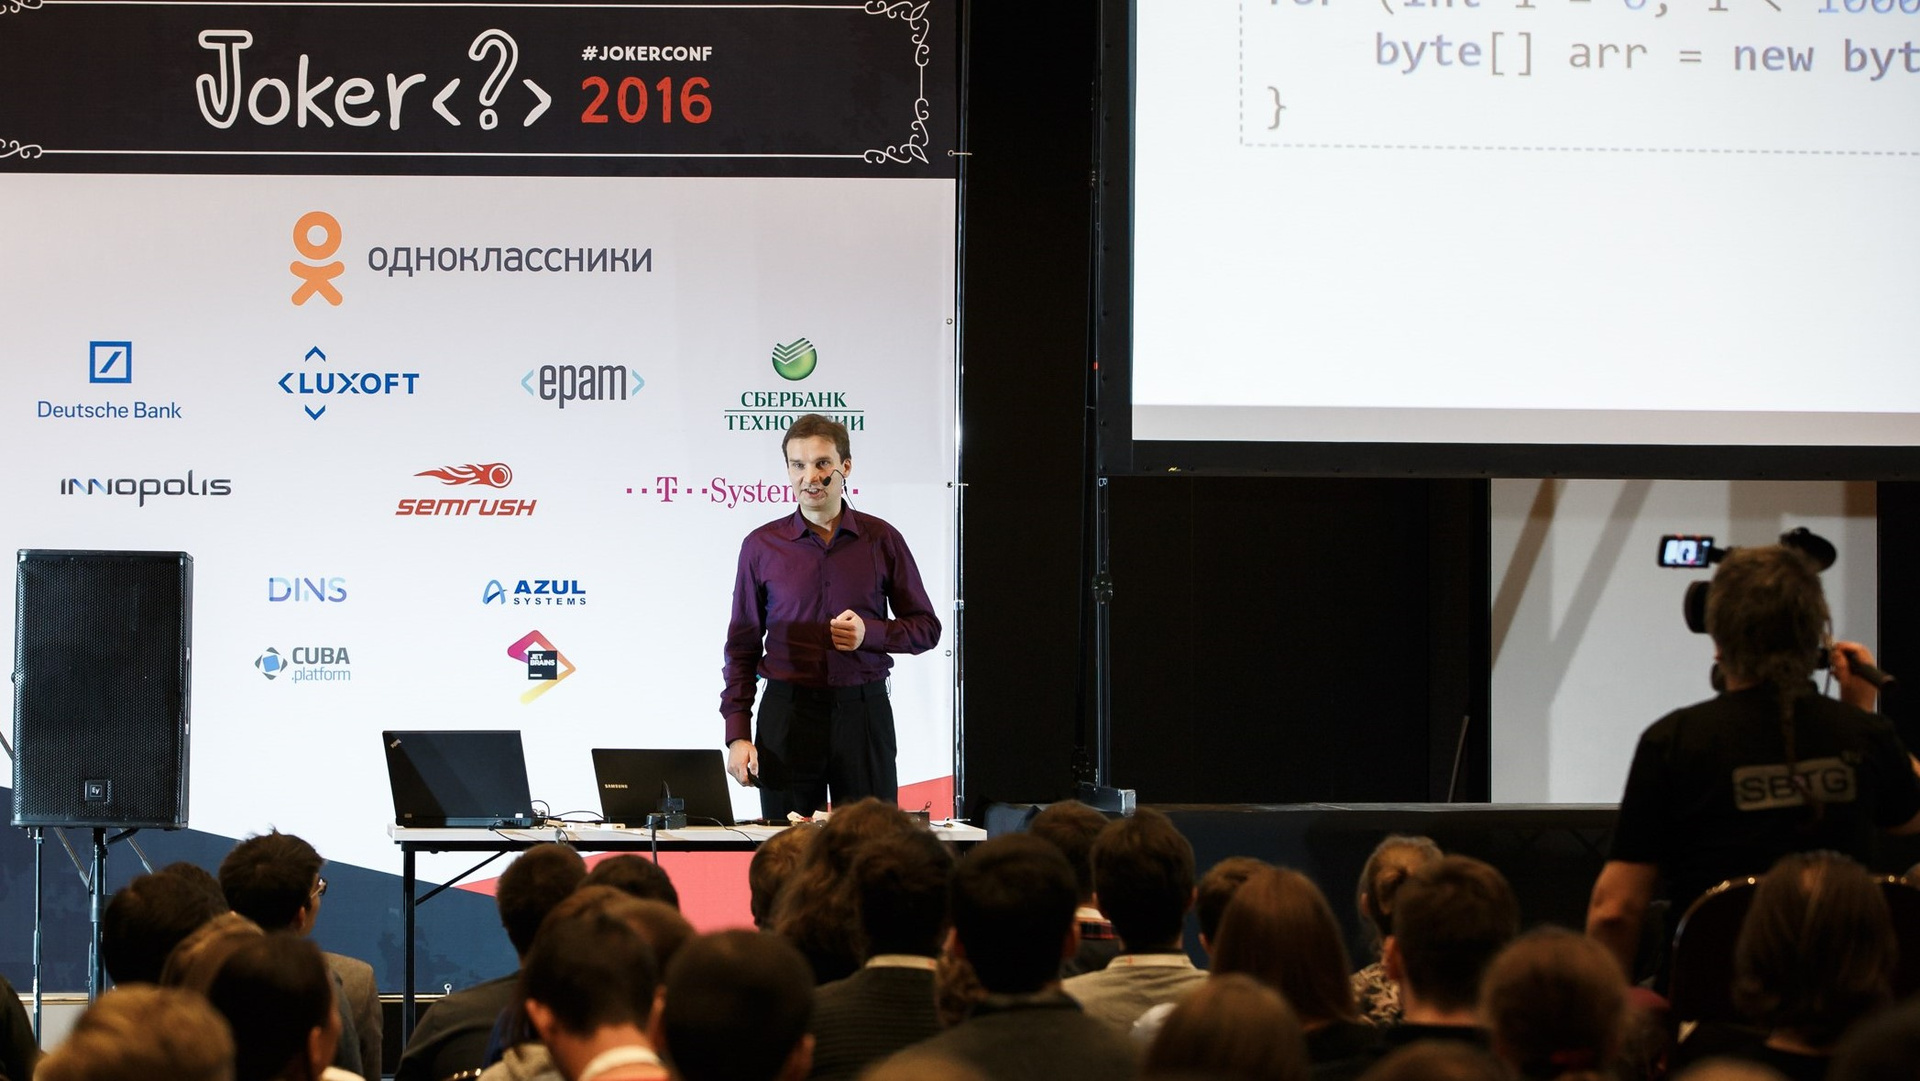
Andrey apangin Pangin (Odnoklassniki) recently created one of these tools: at the JPoint conference in April, he presented an open source project async-profiler , to which safepoint bias is not terrible. Another expert in this topic is Nitsan Waqard : many people learned about the same problem with safepoints thanks to his blog post “Why (Most) Sampling Java Profilers Are Fucking Terrible”.
')
We decided to talk to both of them at once, starting a conversation with the latest news about the async-profiler, and later moving on to the state of Java profiling in general.
JUG.ru: Recently, the async-profiler was moved to GitHub from Andrew’s personal repository to “jvm-profiling-tools” - what is jvm-profiling-tools, and what caused the displacement?
Nitsan: This is a combination of several repositories with similar goals. The idea is to gather them in one place and stimulate the community to develop them more actively.
Andrei: Exactly. When it became clear that the async-profiler is interesting to the Java community, I decided to move it to a neutral place, because third-party developers are sometimes uncomfortable contributing to someone else's personal repository.
Nitsan: The jvm-profiling-tools have Honest Profiler , async-profiler and perf-map-agent , and they fit the same topic from different sides: perf-map-agent opens up opportunities for profiling using Linux perf, Honest Profiler uses AsyncGetCallTrace that avoids safepoint bias, and async-profiler combines both in a very pleasant way.
Andrei: Yes. In fact, there is nothing cosmic in the idea of combining both approaches, but for some reason this had never occurred to anyone before.
Nitsan: In general, it was in Solaris Studio, but the problem with Solaris Studio is that it is used by 20 people in the world.
Andrei: But, as far as I know, it does not show kernel calls, right?
Nitsan: Shows native code, but not the kernel.
JUG.ru: Since Honest Profiler and async-profiler have a common advantage of “lack of safepoint bias”, now when looking at jvm-profiling-tools for newcomers to profiling, the question may appear: “Well, which of two similar tools can I use?” What can you tell them?
Andrew: I think that in terms of the accuracy of the profiling and the completeness of the information, async-profiler is far ahead. After all, even AsyncGetCallTrace itself in HotSpot does not always work: in some borderline cases, the JVM cannot restore the stack trace, although the async-profiler can cope with such situations. In addition, Honest Profiler does not show native stack traces at all. But its great advantage is in the infrastructure around data presentation. He knows how to display the results beautifully, he has a UI, and the async-profiler is just a Java agent launched from the console.
Nitsan: I think the future is for async-profiler. And I would like some Honest Profiler features to fall into the async-profiler. There is another difference in the fact that Honest Profiler works on macOS, and the async-profiler is not there yet: supporting a large hipster community in our industry is important.
JUG.ru: It seems that Vadim Tsesko of Odnoklassniki has already made it possible to work async-profiler on macOS?
Andrei: That was before I added support for perf events. Linux-specific challenge broke macOS support. But there is some good news: literally the other day I talked to Norman Maurer from Apple (the author of Netty), he is also interested in the async-profiler, and he kindly agreed to make a Mac port.
JUG.ru: In July, a hip profiler appeared in the async-profiler - can you tell about it?
Andrew: There are two main approaches to memory profiling in Java. The first is the bytecode instrumentation. But for production systems, it is terrible, because it affects the performance badly. A number of compiler optimizations stop working: first of all, Escape Analysis no longer helps to avoid allocations in the heap.
Another approach is to use DTrace probes, which is also extremely expensive, and can only be enabled at the start of the JVM.
But that's not all. There is still a much more efficient approach based on sampling TLAB (Thread Local Allocation Buffer). It is implemented in the Java Mission Control / Java Flight Recorder, but requires the inclusion of the commercial functions of the Oracle JDK, and does not work with OpenJDK at all. A similar method is used inside Google, but it requires building a modified version of the JVM.
I found a way to use this approach without connecting paid functions, including OpenJDK. Now I will not dive into the details, but I will definitely tell you in a separate report.
Nitsan: I think this is important. Since Java Mission Control is now perhaps the only tool for profiling allocations, and working with similar processes in JMC is implemented in a very peculiar way, many people simply do not do such profiling. I hope that this will help allocate profiling to become mainstream.
JUG.ru: It may seem strange that significant advances in profiling occur in 2017, when they would have been useful years ago. What is the reason for this delay?
Andrew: Java is the root of all evil :) It makes life both better and worse. On the one hand, because of the peculiarities of the JVM, standard approaches become inapplicable, but on the other hand, the JVM provides its own API for profiling.
Nitsan: I think the Java world is similar to Windows. Windows was a terrible OS (probably much better now), but, suffering from many flaws, it was also a great success. Same story with java. In the case of profiling tools, Java turned out badly. I'm not quite sure why this is so.
I think that JVM developers traditionally used Solaris Studio, so everything worked more or less normally, but only for them. Specialists used specialized tools. And most Java developers were pleased with what they had.
But now Java had to face reality. Native profiling, which worked in Solaris Studio, but then it was a niche solution, is becoming increasingly popular.
Andrey: I consider it necessary to add that Java is not equal to HotSpot, and other JVMs can be more friendly to profilers.
Nitsan: Maybe I missed something, but what kind of JVM are we talking about? I know a lot about Zing, and I have some experience with IBM J9 ...
Andrei: Now I have an Excelsior JET T-shirt, and therefore I remembered about this project. He can precompile Java into native code, and as far as I know, safepoint bias does not suffer.
Nitsan: Ah, ok. Never used it. I believe that in this case, you can immediately take the native profiler.
JUG.ru: AsyncGetCallTrace, which is used by async-profiler and Honest Profiler, is not an official API. Is its use felt hack? Do you worry that in the future it may cease to function? Would more formal Oracle support for profiling help?
Nitsan: AsyncGetCallTrace has been running since the launch of OpenJDK 6, so it looks like it has always been and will work. This is an "illegitimate child", but I do not think that they can take it and throw it away. When something becomes an option to the JVM, it gets official support in some way. So I think we should not worry too much about it. Although I’m wondering how well AsyncGetCallTrace gets along with the new Graal compiler.
Of course, more official support would help. At the moment, Oracle provides JMC as a paid option, and the rest of the Java world is left with something like VisualVM. Now in this money. I think that Oracle is experiencing a conflict of interest: Java interests, on the one hand, and their own interests, on the other. We can say that for them to contribute to the improvement of other JVM-profilers would mean worsening their own situation.
I do not claim that they are actively experiencing because of this. I have no idea what they want now. Perhaps they will make things like JMC available to everyone. Now that the work on Jigsaw is complete, they have plenty of time for another.
Andrei: I agree that AsyncGetCallTrace is partly a “hacker” API. Besides, far from perfect: I myself reported bugs. But so far this is the best that is in the HotSpot JVM.
JUG.ru: Can there be something else besides the already existing things like AsyncGetCallTrace that will make life easier for profile creators?
Andrei: Yes. Allocation profiling was recently discussed on the HotSpot mailing lists. As a result, there was even a JEP project , which offers a new standardized API for hip sampling. I think that raising such topics on the mailing lists and offering JEP is the right way. So maybe someday in Java 11 ...
JUG.ru: What do you think about the future of Java profiling regardless of the actions of Oracle? Profilers will be much better than now?
Andrei: I hope so. In my reports, I try to convey to the developers the idea that the profilers they use now have big pitfalls. It is necessary either to stop using them, or how to understand their shortcomings and traps. And I think when more people realize the scale of the problem, the developers of these tools will begin to improve them.
Nitsan: Some issues have room to grow. With perf-map-agent, we gained the ability to track inline scaling when profiling, but going to async-profiler, we lose it again. I would really like to see her embodied again.
Another area is visualization. If you use async-profiler when working with multi-threaded applications, where one thread uses 100% of the CPU, and all the rest just hang on waiting, you can get a confusing picture when profiling. I am interested in data presentation problems, and I am sure that there are many similar problems.
Andrei: Yes. Today, FlameGraph is very popular as a visualization, but I would say that it is far from perfect.
JUG.ru: You both said (in reports and blog posts) that profilers can create a distorted picture. Do you think that the industry is seriously harmed by the use of this distorted picture by people? Could it be that the industry from profilers then generally do more harm than good?
Nitsan: Yes, I think it hurts the industry. If you look at the Java performance discussion on the Internet, you’ll see that it’s full of bulshit. And the reason why there is so much of it is that the information is difficult to verify.
Some people told me that the problem never happens in a HashMap. And the reason why they never thought that a HashMap could be a problem is that the regular profiler will never show it to them. I am not saying that it is specifically in their case that the problem is in him, but be that as it may, they will never know about it. And when they look at the CPU time usage chart, they cannot see the time spent on the GC. That is, if the GC turned out to be their “bottleneck”, they will not be able to track it.
Andrei: I agree with Nitsan, but I would add that it is better to have at least a bad tool than not to have any. The main problem is not when the profiler instills, but when it is not used at all. Many developers do not profile at all, although often the problem of performance lies in inefficient algorithms, and any sampling profiler will easily identify it.
Nitsan: I agree that many people do not profile, and this is a problem. But if your only tool is a bad profiler ... You look at him, see that he gives out some nonsense, and tell the others: “We’d rather just put time marks”, this is how you get a conclusion, and it’s easy to understand how discourages people from using profilers.
JUG.ru: So, in order to improve the situation with Java profiling, we all need to work not only on improving the tools, but also on the community knowledge about them?
Nitsan: Yes. I think the massive success story in the Java world is JMH, Java Microbenchmarking Harness. And the reason is that this decision was very successful not only from a technological point of view, but also in the aspect of educating users, enabling them to become better acquainted with this area.
I think that Andrei creates tools and tells people is very important.
Andrew: Even the most powerful tools will be useless if you do not know how to use them. With the same JMH: I have seen many times how people wrote nonsense in JMH, and then they made completely wrong conclusions. Training is an integral part of success.
JUG.ru: Both of you are going to help this training with your reports at the nearest Joker, and both of you are going to present there new versions of reports previously presented at other conferences. What will be the novelty?
Nitsan: After I presented the “Profilers are lying hobbitses” report at QCon, I thought that the best thing about him was the name. Therefore, I decided to keep the title, but the report itself will be very different. We will again talk about profilers and how they can mislead us, but I think I will start with the darkest, and then I will show you how to get out. In the past, the report was a series of surprises that led to the conclusion that “nothing works”. This time it will be like this: “nothing works, but let's see how we deal with it.”
Andrei: Initially, I planned to show the continuation of the async-profiler story launched at JPoint 2017. However, later the Program Committee and I found a great deal of similarity to my report with the Nitsan report, so I decided to take a new topic. So far, I am not ready to say what exactly this will be, but in the near future in the Joker 2017 program you can see my new report! So stay tuned.
The Joker java conference, where Nitsan and Andrei will speak, will be held in St. Petersburg on November 3-4. As usual, after the reports Joker speakers find themselves in discussion zones, so that there it will be possible to ask them about profiling in person. And besides Andrey and Nitsan, there will be dozens of other speakers there - on the conference website you can see the program (and purchase a ticket).
Source: https://habr.com/ru/post/335852/
All Articles