Digital agency / production performance indicators (examples from the West)
Any business, no matter how “simple” a model it possesses, is an alloy of many elements expressed in concrete indicators. And digital is no exception. Any direction can be measured. Therefore, today's article is about numbers.
Note: most of the data was taken from a HubSpot study based on a survey of 500+ western agencies (most of which have a small staff of up to 10 people and a turnover of up to $ 500,000 per year).

KPI
This is the main base for assessing the current situation, forecasting and making the right management decisions. If you, like most agencies, do not go beyond the 5th item, it's time to start doing this.
- Turnover.
- Profit.
- Marginality.
- Average check.
- The cost of man-hours.
- Profitability of the project.
- Customer life cycle.
- The number of incoming applications.
- Conversion from application to payment.
- The cost of the application.
- Number of projects.
- Turnover for 1 employee.
- Workload of employees / departments.
- Customer Satisfaction.
- Staff satisfaction.
- The number of recommendations / positive reviews.
- Coefficient pay time.
The latter figure is often (almost 80% of agencies) do not even calculate in the West, what can we say about the post-Soviet space. Although it is really important, as it shows profitability on the other hand. Calculation example:
- It was spent (including negotiations and other indirect processes) for 1 client project 200 hours. At the same time, the estimate that the customer paid was only 150 man-hours. 150/200 * 100% = 75%. So 25% of the time was “free.”
Calculating this figure helps in identifying problems for producers / agencies that complain about the overall low profit of a business.
Calculation
It is necessary to measure the main indicators monthly. Than? Partially necessary functionality is in any management system:
- https://www.accountabilityaccess.com/
- http://www.pegasussystems.com/
- http://www.esilentpartner.com/
- http://www.clientsandprofits.com/
Priorities and interconnection
Consider that first of all you need to deal with indicators that can be applied in practice. Play with useless numbers = A waste of time.
While you do not keep abreast of profits and the number of applications, do not take up the calculation of the kopecks of the profitability of each project.
And remember that all indicators are interrelated:
- Low number of applications today → Reduced turnover tomorrow.
- High employee satisfaction → Quality work → Satisfied customers → More recommendations.
- Low paid hours ratio = “killer” marginality.
Pricing Models
There are several common models under which agencies adapt their product and marketing:
- Fix / Subscription fee:
- Advance model - works for 59% of agencies.
- Full payment for the project - 53%.
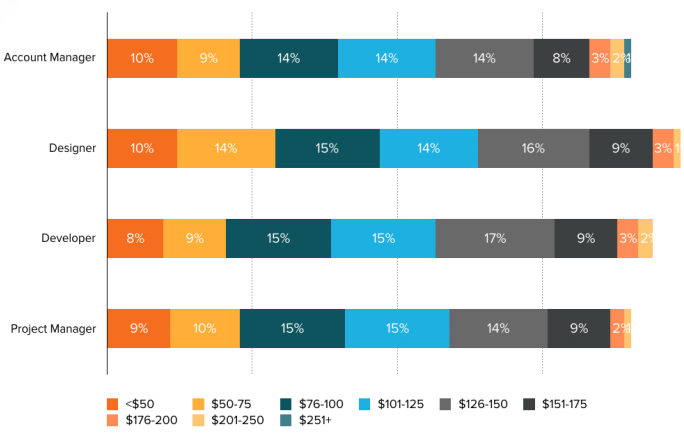
- Hourly:
- The uniform rate (based on the average) is 39%.
- With division by specialization of performers - 26%.
- Commission percent - 11%.
- Bonus (based on performance indicators) - 8%, of which:
')- Lida - 59%.
- Traffic - 34%.
- Brand awareness - 14%.
- Market share - 6%.
What to choose?
Difficult to give universal advice. You can only "try on" the model for certain cases:
- Website development in the low price segment - fix.
- Setting up large advertising campaigns - pochasovka.
- The traffic for e-commerce projects with low checks is commission (be prepared to act as “lenders”; you need tough client qualifications if you do not have your own resource for “fast” traffic surge and you are not sure about the organization of work (first of all - sales ) client business).
- Large-scale complexes, where they take the "quantity" - bonus.
Sources of orders
- Word of mouth works with 90% of agencies.
- Its main site - 39%.
- Activity:
- As a listener - 37%.
- As a speaker - 17%.
- Cold calls / mailings - 14%.
- Soc. networks - 13%.
- Blogs - 12%.
- Email marketing - 8%.
- PR - 7%.
- Paid traffic - 7%.
- Webinars - 2%.
- Guest blogging - 1%.
What kind of exhaust can it give? In the West, as a rule, they use the terms “request” and “sending an offer”. So, based on the questionnaire, 65% of agencies during the year do not receive even a dozen requests. 52% send only from 10 to 50 offers.
On the conversion in the payment picture does not make any definite conclusions. At each step of 10%, a similar proportion of respondents favored. That is, every tenth agency wins in 10%, 20%, etc. cases. Surprisingly, it seems a coincidence. Or simply wrong calculations :)
Frames
Does the agency need a sales manager?
66% don't have it. And 12% have more than 1 “new business”, as they say now.
Who can do without sales?
- Players in the high price segment, who do only a few projects over the year, and more often key managers negotiate.
- Subcontract-production, which generally do not "run" for anyone. Most of the work is in preparing estimates. And this does not need the classic assertive "sellers".
- Leaders in their segments, which have a queue from several months. They have another task - how not to “offend” those who do not want to wait.
Freelance / Outsourcing: To be or not to be?
Half of the agencies> 10% of production is outsourced, or freelancers are not involved in these projects without salaries. Removed on full-time hire only 39%.
Flow
The market average is 18.5%.
"Buns"
What agencies offer to look more interesting in the eyes of applicants:
- Flexible working conditions - 79%.
- Attendance of conferences - 52%.
- Payment for online trainings - 46%.
- Medical package - 43%.
- Payment for maternity leave - 32%.
- Inviting coaches, consultants, etc. - 29%.
- Payments% from profits - 28%.
- Payments to the private pension fund - 27%.
- Paternity leave pay 18%.
- Gym payment - 13%.
- Training compensation - 12%.
- The possibility of participation in the share of business - 5%.
Raita
Budgets for tools / services
53% spend up to $ 5,000. How relevant is this, given the availability of alternatives in Runet?
Apart from expensive Adobe products, boxed CRM, steep tariffs of monitoring systems, etc., then, of course, our numbers may be more modest. Highly specialized marketing services cost a penny by this measure.
Other numbers from statistics
Do not be surprised, it's true :)
- 37% of agencies do not consider the profitability of projects.
- 69% - have not yet decided on 100% with the financial model.
- 61% - operate without a plan for the sale / retention of customers.
- 44% - do not use CRM.
- 12% - do not consider how much they spend on technology.
- 43% - do not have a clear positioning, working even without UTP.
- 42% are undecided with their target audience.
- 36% - do not constantly lead more than 10 projects.
- 28% - do not force their employees to fix time-consuming.
- 27% - do not explain what the value of the product.
- 22% - do not track performance on the side of client business.
- 17% - do not even make $ 50,000 turnover. Add to this 5% of those who did not give the numbers at all (do they not think or don’t want to “burn”?).
- They understand that everything is bad for them:
- 41% - with sales.
- 39% - with finance.
- 29% - with positioning.
- 31% - with competencies.
- 30% - with customer service.
The objectivity of this study can be challenged. But the overall picture is obvious: digital business is very often “sick”, referring to its own [incl. financial] health neglect. And the one who quickly "recover", has a chance to get a head start by taking the lead!
Source: https://habr.com/ru/post/335694/
All Articles