Visualization of Moscow Exchange data using InterSystems DeepSee
Introduction
The InterSystems technology stack has technology for developing DeepSee analytical solutions. This is an embedded analytical technology and a set of tools for creating effective decision support systems, including using predictive models. DeepSee works with structured and unstructured data. It is designed to create OLAP solutions for Caché databases and any relational database management system. InterSystems DeepSee provides developers with the tools to integrate analytical OLAP functionality into their applications, which is able to work on operational application databases without creating a separate infrastructure for solving analytical problems.
The article discusses an example of creating in an OLAP-cube, working with analytics tools and building a user interface using the example of analyzing stock quotes traded on the Moscow Exchange.
Stages
- Data acquisition
- ETL
- Build a cube
- Pivot table construction
- Building dashboards
- Visualization
Data acquisition
To visualize stock quote data, you must first download it. The Moscow Exchange has a publicly documented API that provides information on stock trading in HTML, XML, JSON, CSV formats.
Here, for example, XML data for May 27, 2013. Create an XML-Enabled Ticker.Data class in the InterSystems platform:
Class Ticker.Data Extends (%Persistent, %XML.Adaptor) { /// Property Date As %Date(FORMAT = 3, XMLNAME = "TRADEDATE", XMLPROJECTION = "attribute"); /// Property Name As %String(XMLNAME = "SHORTNAME", XMLPROJECTION = "attribute"); /// Property Ticker As %String(XMLNAME = "SECID", XMLPROJECTION = "attribute"); /// Property Trades As %Integer(XMLNAME = "NUMTRADES", XMLPROJECTION = "attribute"); /// Property Value As %Decimal(XMLNAME = "VALUE", XMLPROJECTION = "attribute"); /// Property Open As %Decimal(XMLNAME = "OPEN", XMLPROJECTION = "attribute"); /// Property Close As %Decimal(XMLNAME = "CLOSE", XMLPROJECTION = "attribute"); /// Property CloseLegal As %Decimal(XMLNAME = "LEGALCLOSEPRICE", XMLPROJECTION = "attribute"); /// Property Low As %Decimal(XMLNAME = "LOW", XMLPROJECTION = "attribute"); /// Property High As %Decimal(XMLNAME = "HIGH", XMLPROJECTION = "attribute"); /// http://www.moex.com/s1194 /// . Property Average As %Decimal(XMLNAME = "WAPRICE", XMLPROJECTION = "attribute"); /// Property Volume As %Integer(XMLNAME = "VOLUME", XMLPROJECTION = "attribute"); } And write the data loader in XML format. Since the class is XML-Enabled, then the conversion from XML to objects of the Ticker.Data class occurs automatically. Similar behavior can be achieved for data in JSON formats (via dynamic objects ) and CSV (using % SQL.Util.Procedures ). Since the API gives data for a certain date (day), we need to iterate by day and store incoming data. In addition, data on stock quotes come in pages of 100 entries. The bootloader might look like this:
/// From To. Purge - /// From, To - YYYY-MM-DD /// Write $System.Status.GetErrorText(##class(Ticker.Loader).Populate()) ClassMethod Populate(From As %Date(DISPLAY=3) = "2013-03-25", To As %Date(DISPLAY=3) = {$ZDate($Horolog,3)}, Purge As %Boolean = {$$$YES}) { #Dim Status As %Status = $$$OK // Set FromH = $ZDateH(From, 3) Set ToH = $ZDateH(To, 3) Do:Purge ..Purge() For DateH = FromH:1:ToH { Write $c(13), "Populating ", $ZDate(DateH, 3) Set Status = ..PopulateDay(DateH) Quit:$$$ISERR(Status) } Quit Status } /// . 100 . /// Write $System.Status.GetErrorText(##class(Ticker.Loader).PopulateDay($Horolog)) ClassMethod PopulateDay(DateH As %Date) As %Status { #Dim Status As %Status = $$$OK Set Reader = ##class(%XML.Reader).%New() Set Date = $ZDate(DateH, 3) // YYYY-MM-DD Set Count = 0 // While Count '= $G(CountOld) { Set CountOld = Count Set Status = Reader.OpenURL(..GetURL(Date, Count)) // Quit:$$$ISERR(Status) // row == Ticker.Data Do Reader.Correlate("row", "Ticker.Data") // row Ticker.Data While Reader.Next(.Object, .Status) { #Dim Object As Ticker.Data // If Object.Ticker '="" { Set Status = Object.%Save() Quit:$$$ISERR(Status) Set Count = Count + 1 } } Quit:(Count-CountOld)<100 // 100 => - } Quit Status } /// URL Date, Start ClassMethod GetURL(Date, Start As %Integer = 0) [ CodeMode = expression ] { $$$FormatText("http://iss.moex.com/iss/history/engines/stock/markets/shares/boards/tqbr/securities.xml?date=%1&start=%2", Date, Start) } Now load the data with the command: Write $System.Status.GetErrorText(##class(Ticker.Loader).Populate())
All code is available in the repository .
ETL
As you know, to build an OLAP cube, you first need to create a fact table: an operations table whose records you want to group and filter. The fact table can be linked to other tables in a star or snowflake pattern.
The fact table for a cube is usually the result of the work of analysts and developers on a process called ETL (extract, transform, load). Those. “squeeze” of data required for analysis is made from the data of the subject area, and transferred to the star / snowflake structure that is convenient for storage: facts and fact reference books.
In our case, we skip the ETL stage. Our Ticker.Data class Ticker.Data already in a Ticker.Data that is quite convenient for creating a cube.
Build a cube
DeepSee Architect is a web application for creating an OLAP cube. To go to DeepSee Architect, open the System Management Portal → DeepSee → Select Area → Architect. The working window of the Architect opens.
You may need to select an area that supports DeepSee. In that case, if you do not see your area in the list of DeepSee areas, go to the System Management Portal → Menu → Web Application Management → / csp / area, and there in the Enabled field, check DeepSee and click the save button. After that, the selected area should appear in the list of areas DeepSee.
Create a new cube.
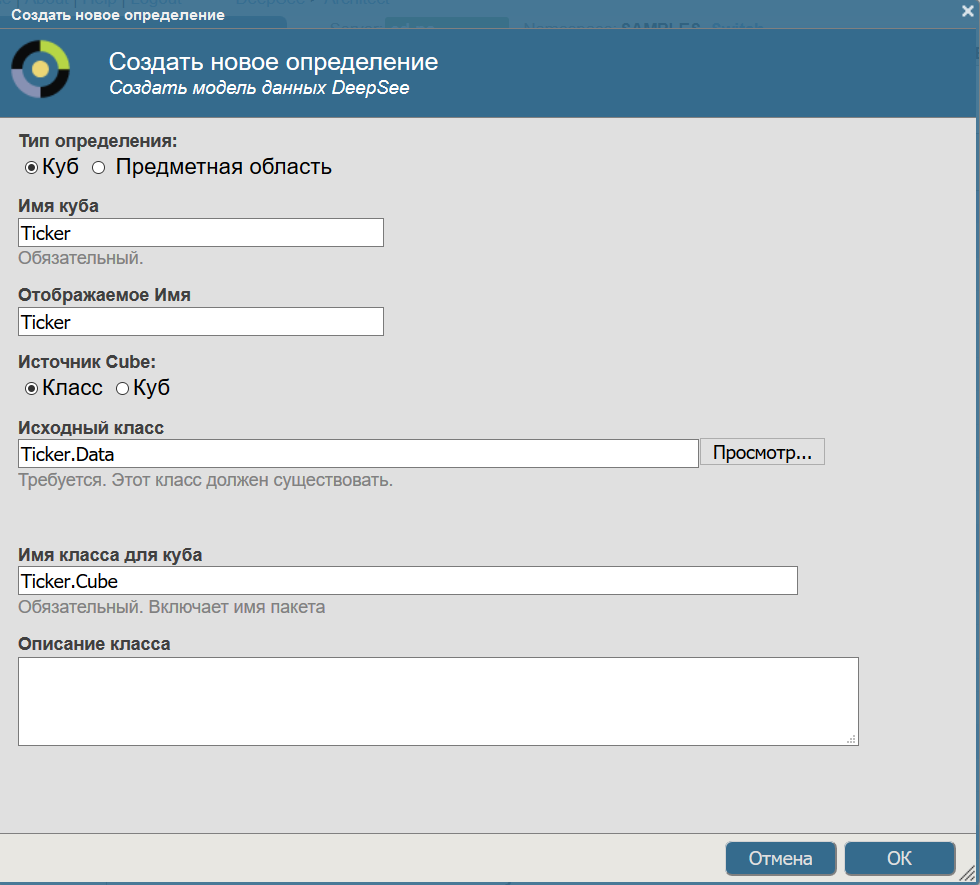
Clicking on the button "Create" we get to the screen of creating a new cube, there you need to set the following parameters:
- Cube name - the name of the cube used in queries to it
- Display Name - localized cube name (translation is performed by standard InterSystems mechanisms )
- Cube source - use a fact table or another cube as a data source
- Initial class - if in the previous step a class was chosen, then we specify the class Ticker.Data as the fact table.
- The class name for a cube is the name of the class in which the cube definition will be stored. Automatically generated
- Class description - arbitrary description
This is what our new cube looks like:
Determine the properties of the cube
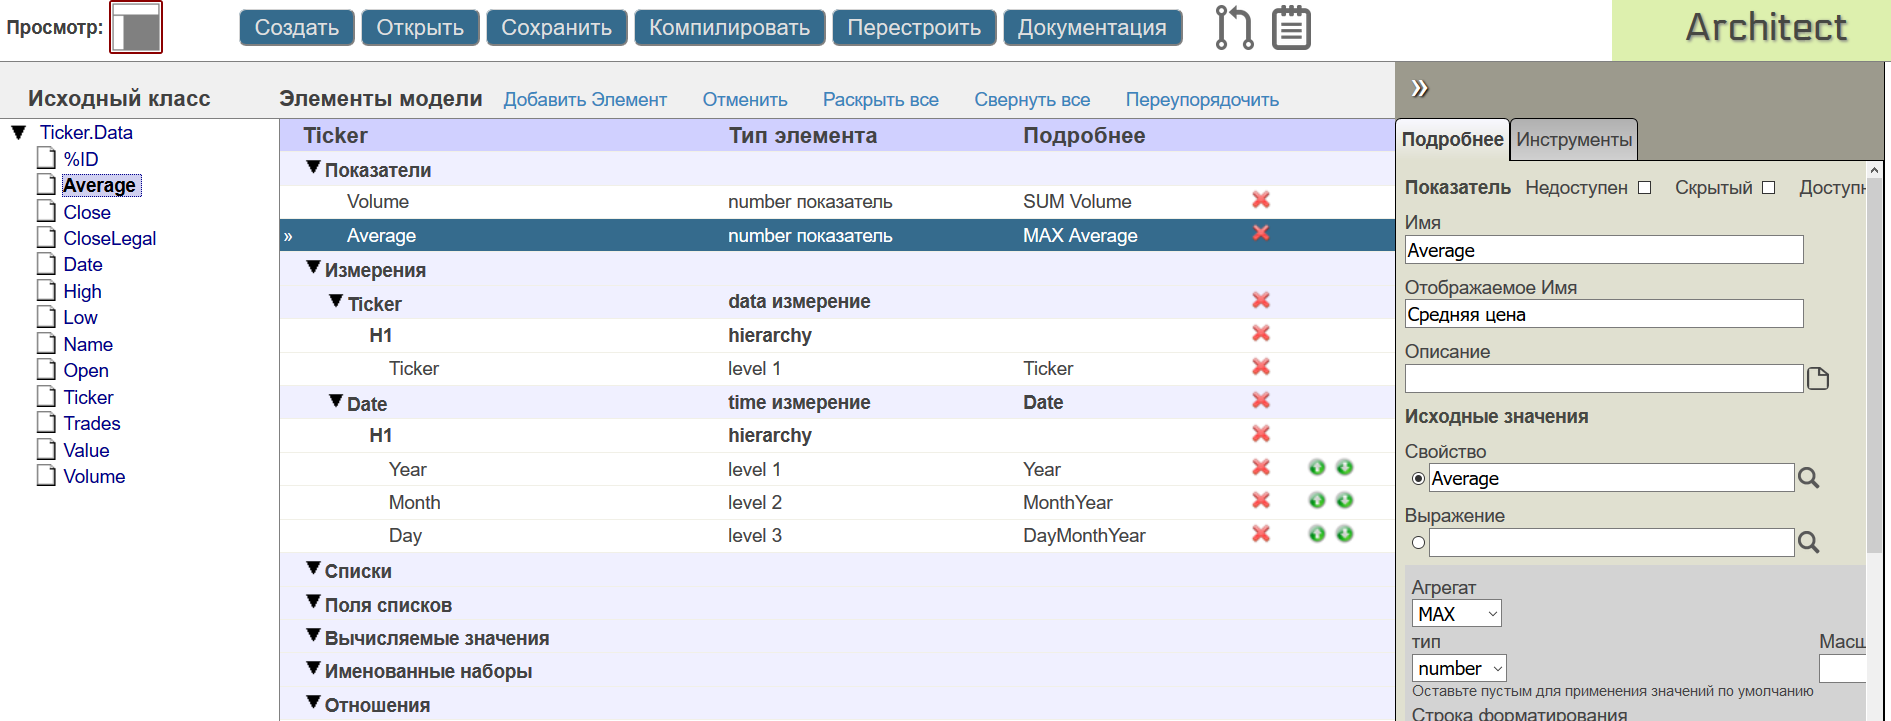
After clicking OK, a new cube will be created:
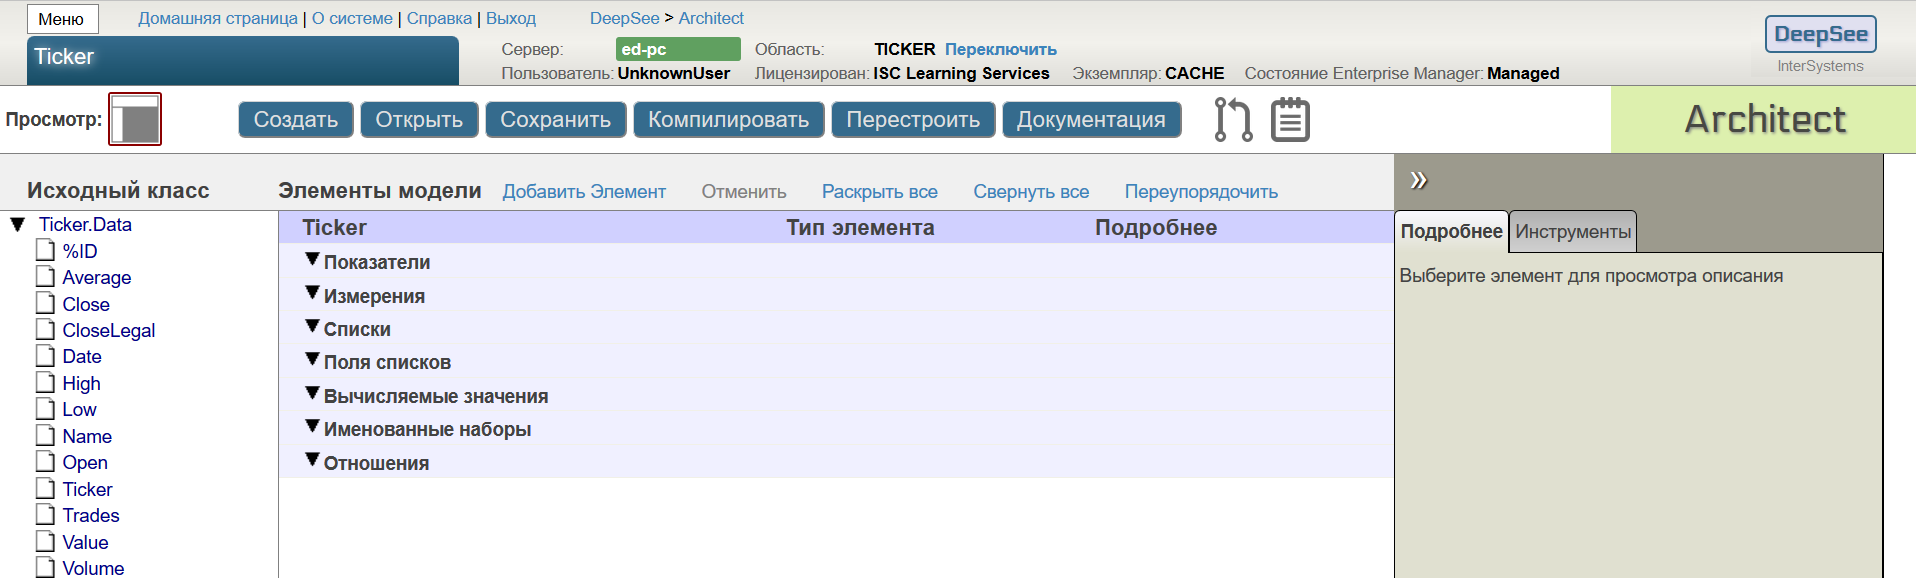
On the left, the properties of the base and related by the “snowflake” classes are displayed, which can be used when constructing a cube.
The center of the screen is the skeleton of the cube. It can be filled with class properties using drag-n-drop from the base class area, or by adding elements manually. The main elements of the cube are measurements, indicators and lists.
Dimensions (Dimensions)
Dimensions are cube elements that group fact table entries. In the measurement, the “quality” attributes of the base class are usually referred to, which break all the records of the fact table according to one or another cut. For example, we would like to group all the facts by instrument name and date.
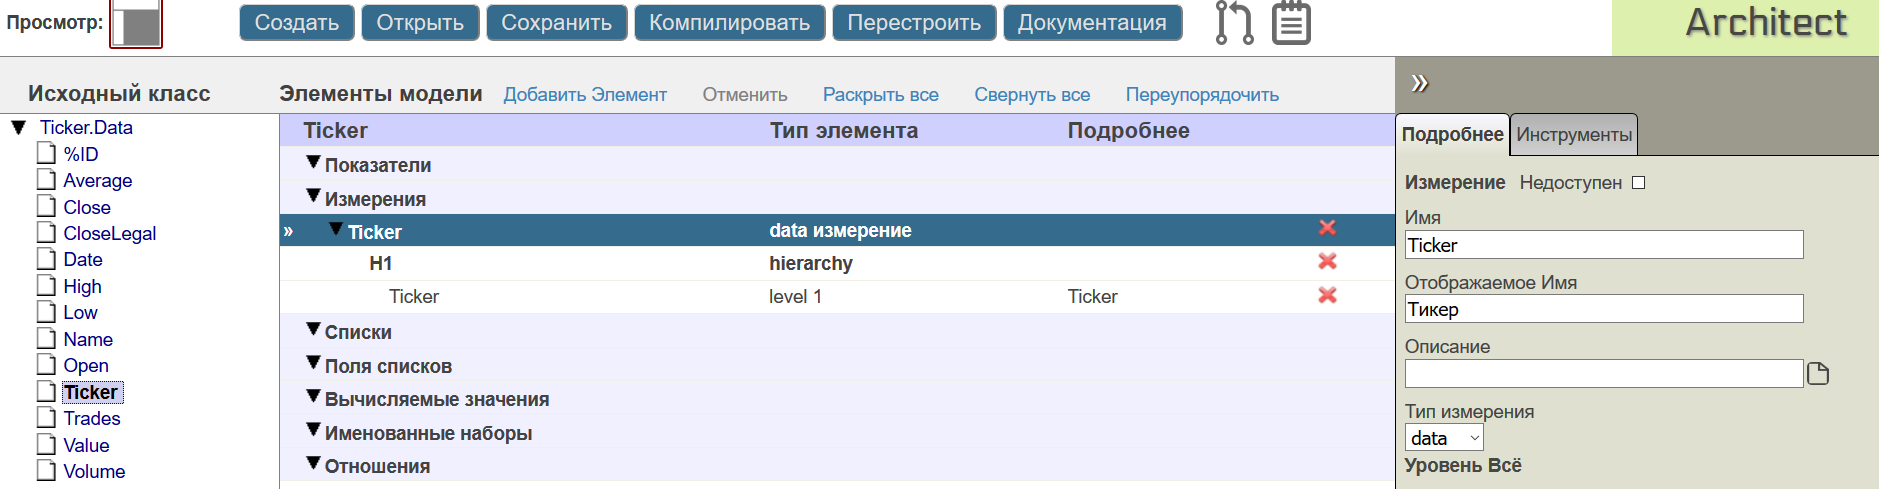
For splitting facts into tickers, the Ticker property is perfect. Drag the Ticker onto the measurement area - as a result, the Architect adds a Ticker dimension to the cube with one H1 hierarchy and one Ticker level. We indicate the displayed names in the signatures to the measurement and level.
Measurements besides grouping allow you to build hierarchies of nesting of facts from the general to the particular. A typical example is measurement by date, which is often often required to be represented in a hierarchy Year-Month-Day.
For date type properties (for example, the Date property has the% Date type), DeepSee has a special type of time dimension, which already has frequently used functions for creating hierarchies by date. We use this and build a three-level hierarchy Year-month-day using the property Date.
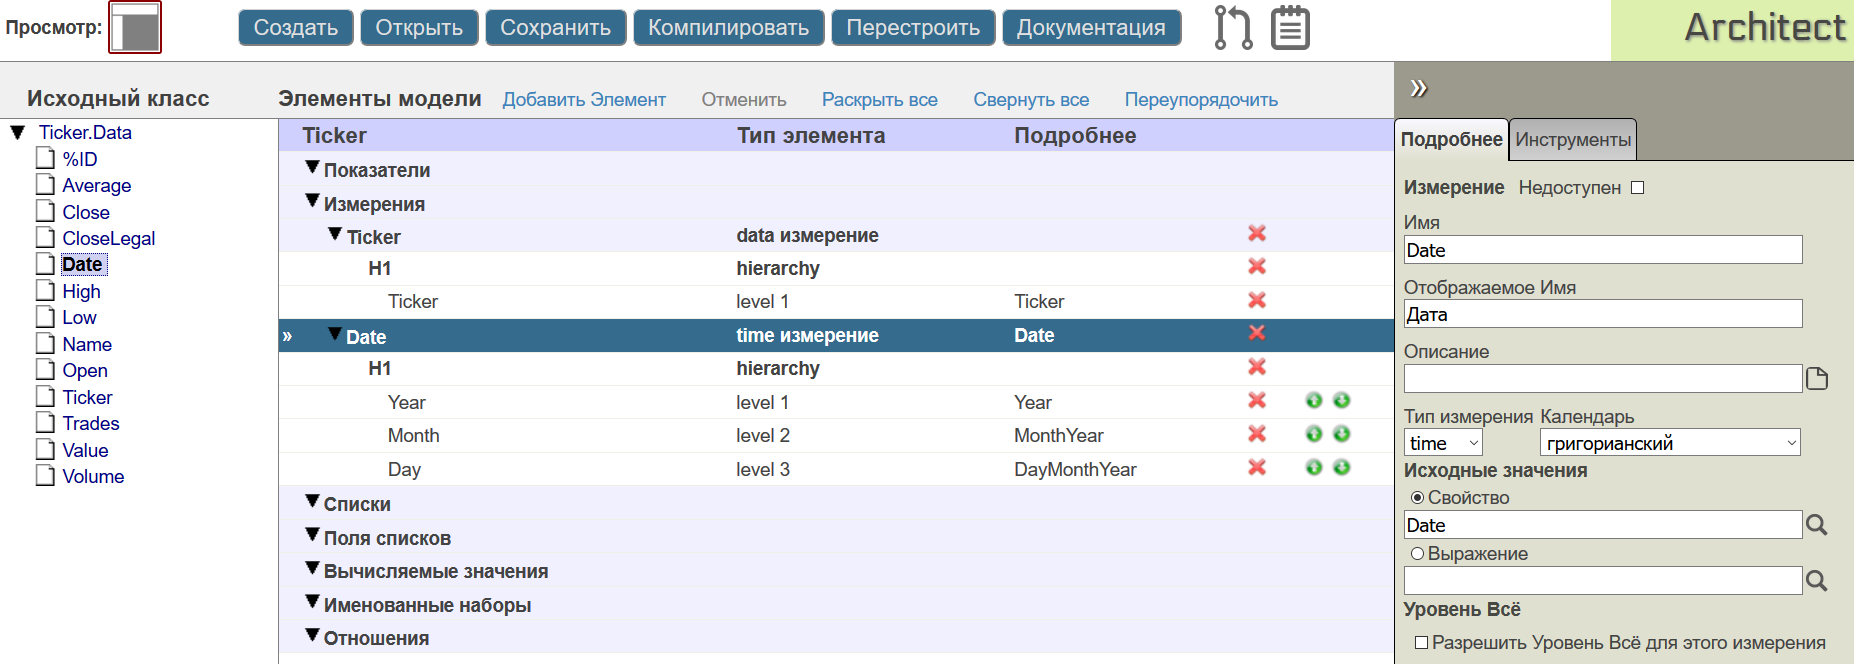
Note that there are elements in the dimension: the dimension itself, the hierarchy, and the levels of this hierarchy (Level). Any cube dimension consists of at least one hierarchy in which in the simplest case there is only one level.
Indicators (Measures)
Indicators or metrics are such elements of a cube, to which any “quantitative” data are to be counted, which must be calculated for “qualitative” dimensions of the cube (Dimensions).
For example, in the fact table such indicators can be the properties of Volume (number of shares) and Average (Average price). Drag the Volume property to the area of indicators and create the “Number” indicator with the SUM function, which will count the total number of shares in the current slice.
We also add the Average property to the indicators and specify as the calculation function MAX — the calculation of the maximum value. In order to use the price to visualize changes in the maximum stock price over time.
Listings
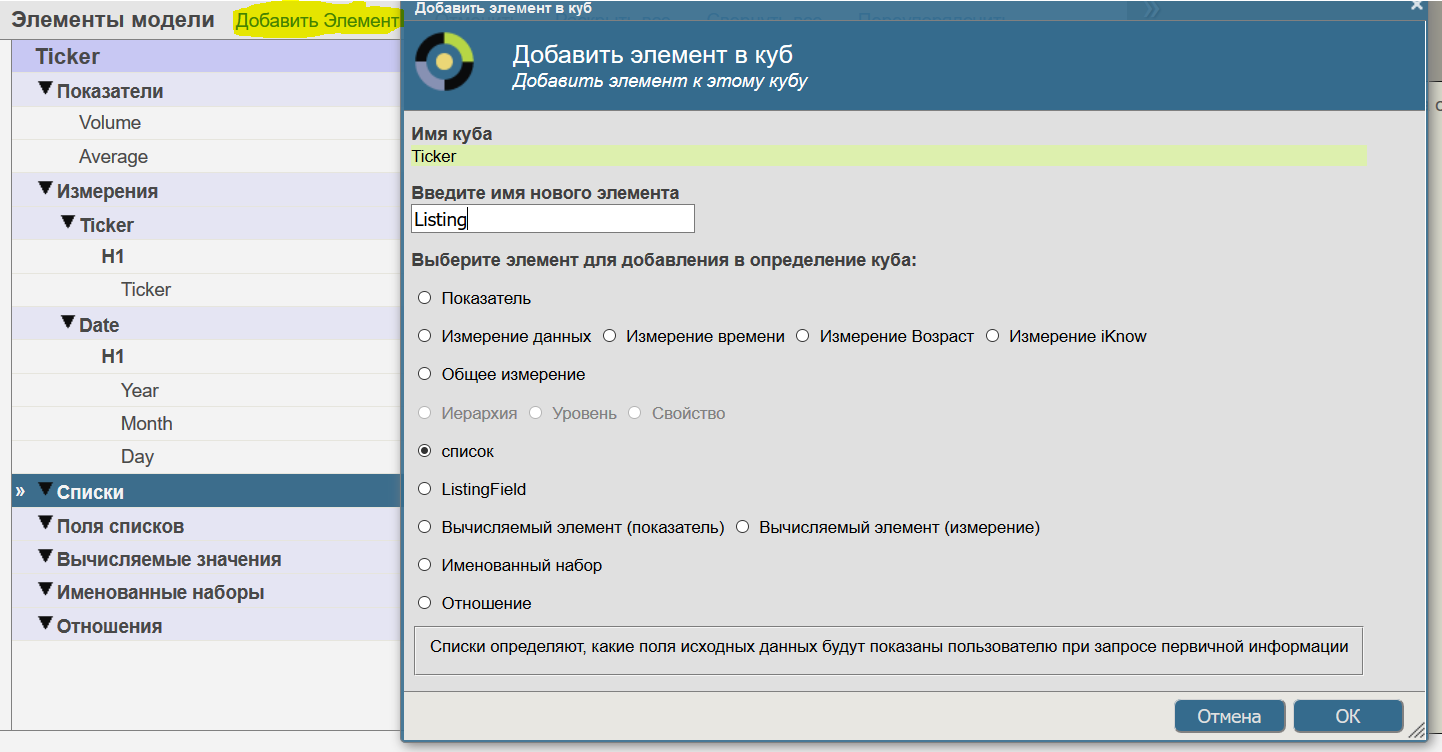
Lists are cube elements that describe how to access the source data of the cube, allowing you to go from the cube aggregated to the source data. As a rule, when working with a cube, the analyst views the aggregated information in various sections. However, it is often necessary to look at the original facts that are included in the current slice. For this, listings are created - they list a set of fields of the fact table that need to be displayed when going to the Drillthrough fact viewer. Create a simple listing by clicking the "Add item" button:
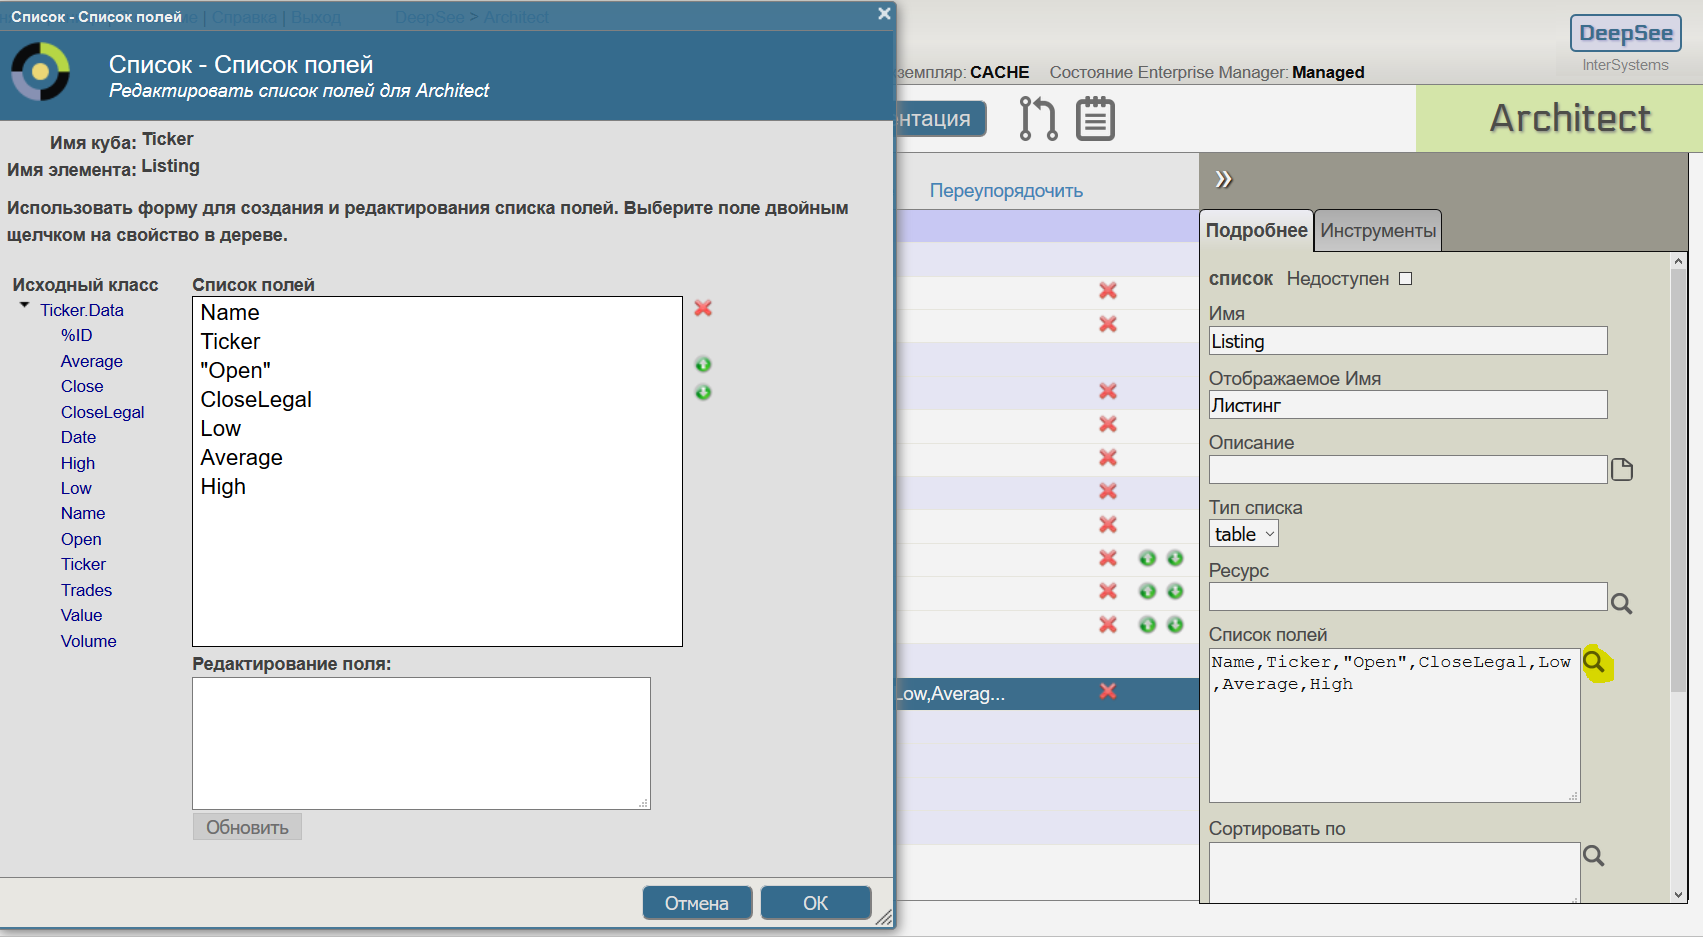
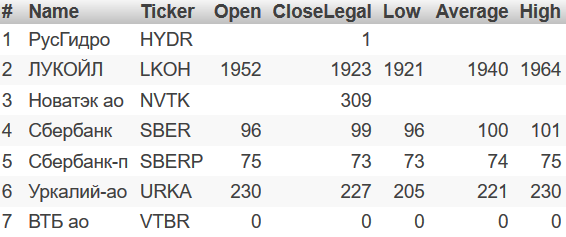
Now we will set the fields of the fact table to be displayed. For example, we will display information about tickers and their daily price fluctuations (Name, Ticker, "Open", CloseLegal, Low, Average, High):
Compilation cube
So, we added two indicators to the cube, two measurements and one listing - this is quite enough and you can already see what happened.
Compile the cube class (Compile button). If there are no compilation errors, then the cube is created correctly and you can fill it with data.
To do this, click "Build a cube" - as a result, DeepSee will load data from the fact table into the cube data store.
To work with the cube data we need another web application - DeepSee Analyzer.
Pivot table construction (Pivot)
DeepSee Analyzer is a visual tool for directly analyzing cube data and preparing data sources for further visualization. To go to DeepSee Analyzer, open the System Management Portal → DeepSee → Area Selection → Analyzer. The Analyzer working window opens.
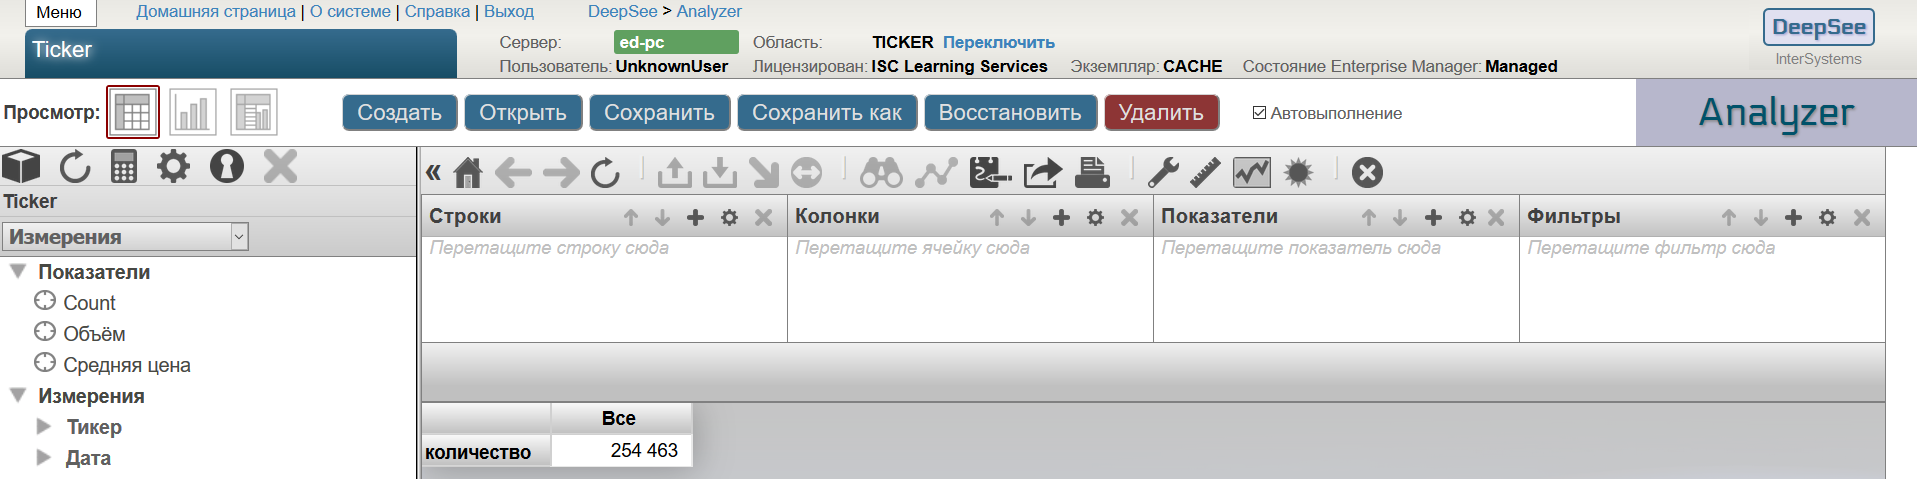
In the working analyzer window on the left we see the elements of the created cube: indicators and measurements. Combining them, we build queries to the cube in MDX , an analogue of the SQL language for multidimensional OLAP cubes.
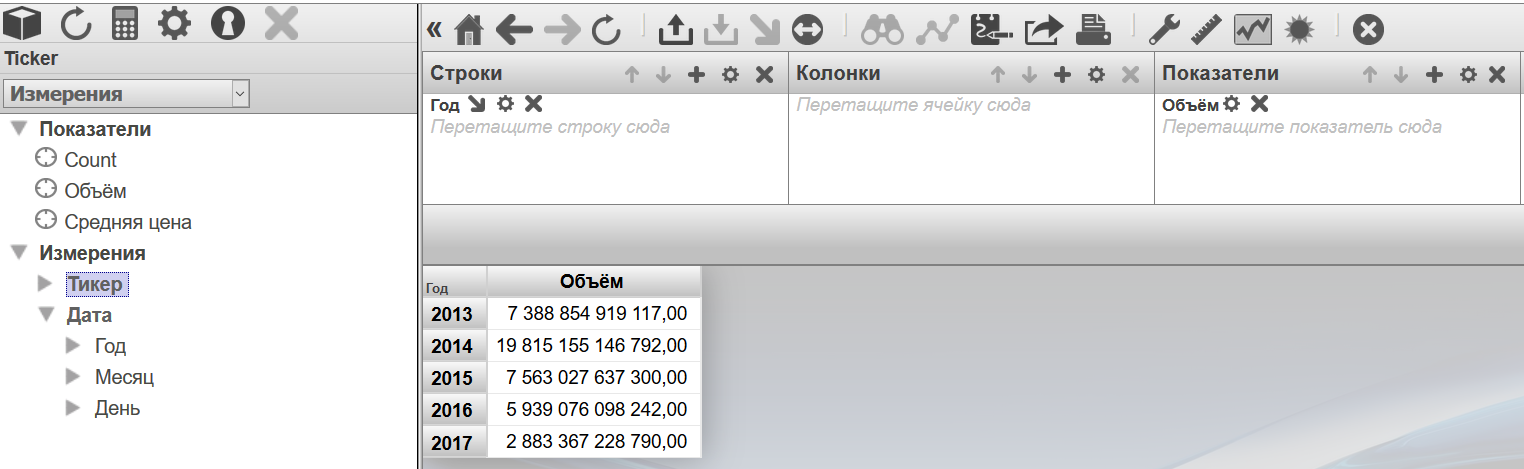
Consider the Analyzer interface. On the right is a pivot table field. The result of the MDX query is always shown in the field of the summary table of the Analyzer. You can view the current MDX request by clicking the button.  . When you first open a cube, the default pivot table field shows the number of entries in the fact table — in our case, the number of entries in the Ticker.Data class. This corresponds to MDX:
 SELECT FROM [TICKER] .
To create a pivot table, drag the “Year” dimension into the column field. Indicator choose "Volume". As a result, we obtain a table of the number of shares sold by year.
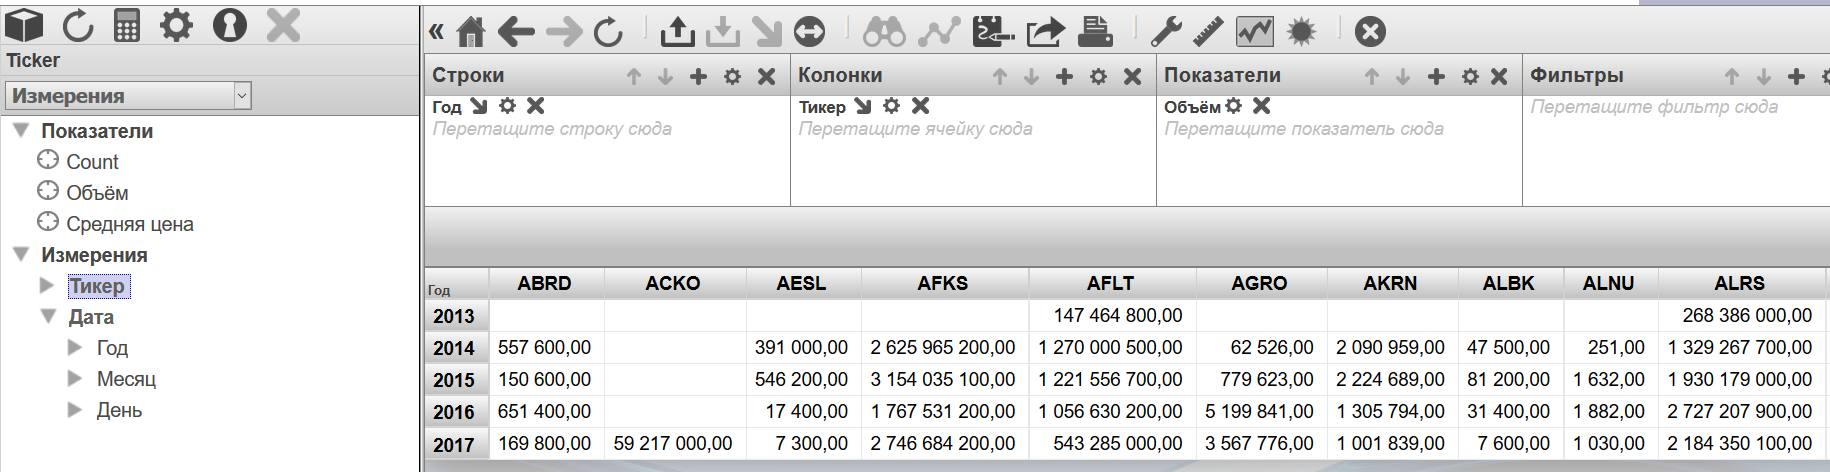
Next, drag the “Ticker” dimension into the column field and get a summary table of the number of shares by instrument, broken down by year:
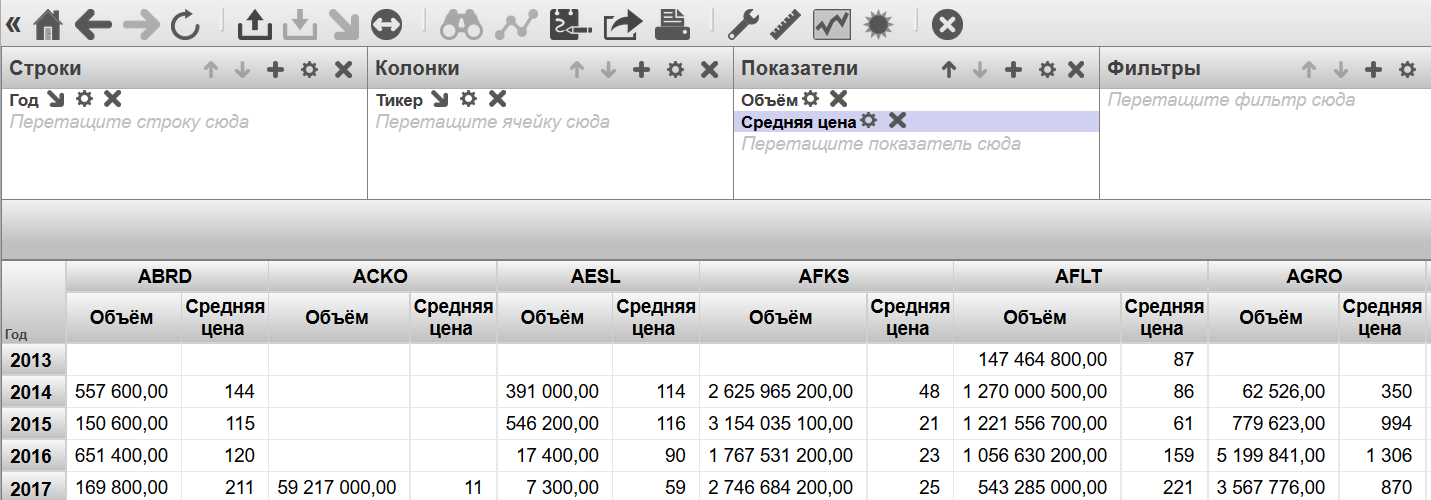
Now, for each cell of the resulting table, one value is calculated - the total number of shares involved in the transactions (if no indicator is selected, the number of facts is considered - in this case, this can be interpreted as the number of instrument trading days). This can be changed. Add the indicator "Average Price". As a result, you can see a more interesting picture: the summary table displays the average maximum price for each instrument per year.
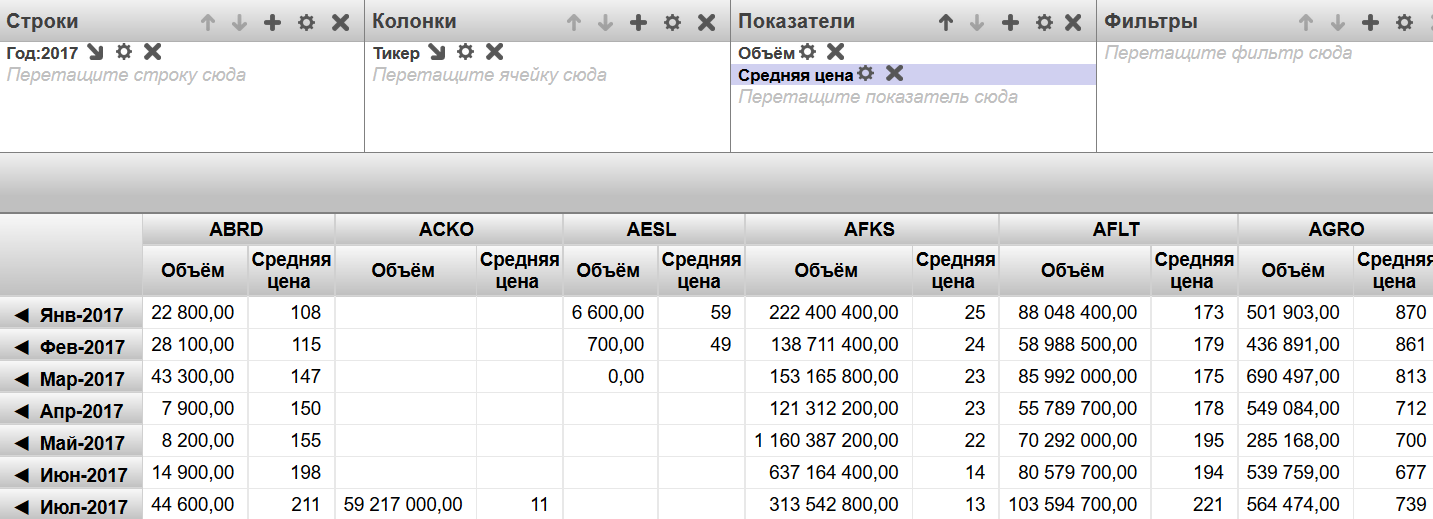
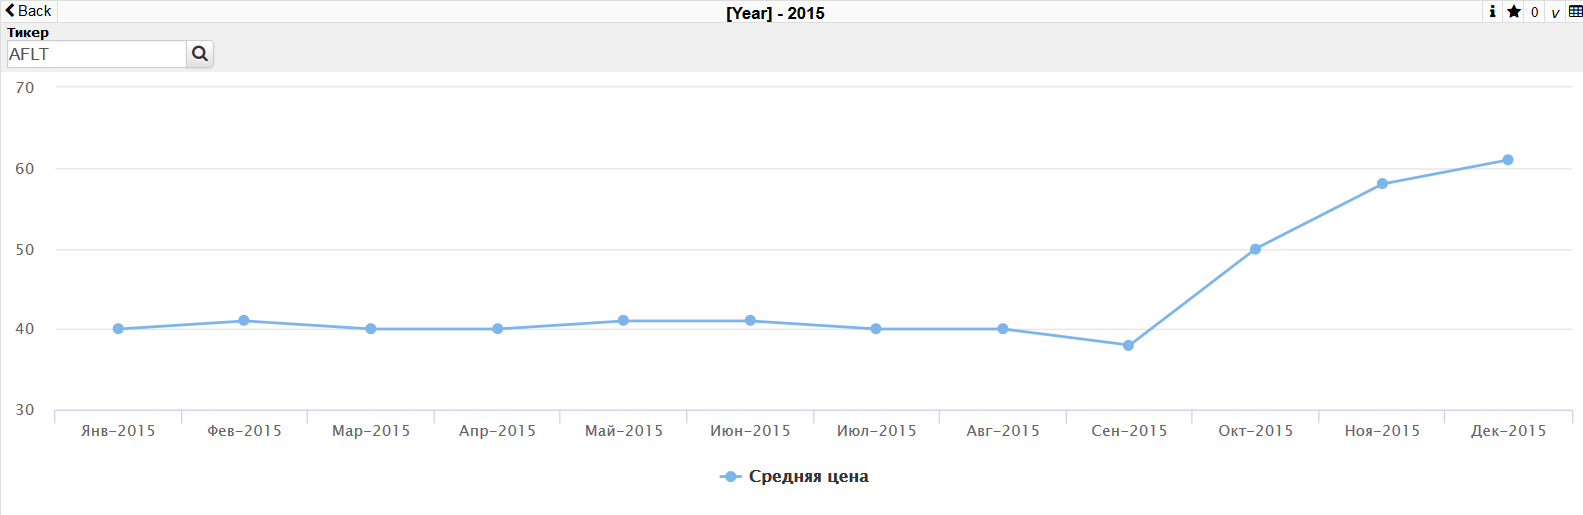
As we remember, in the definition of a cube we have a hierarchy by dates. This means that, by the Date dimension, a DrillDown operation is possible (moving along the measurement hierarchy from general to specific). In the Analyzer, double clicking on the dimension heading leads to the next dimension in the hierarchy (DrillDown). In this case, a double click on the year will lead to a transition to the months of this year, and a double click on a month will lead to a transition to the level of days. As a result, you can see how the average stock price has changed for days or months.
At the previous stage, we created a listing - a tool for moving from aggregated data to source facts. Select any row of the pivot table and press the button.  to go to listing:
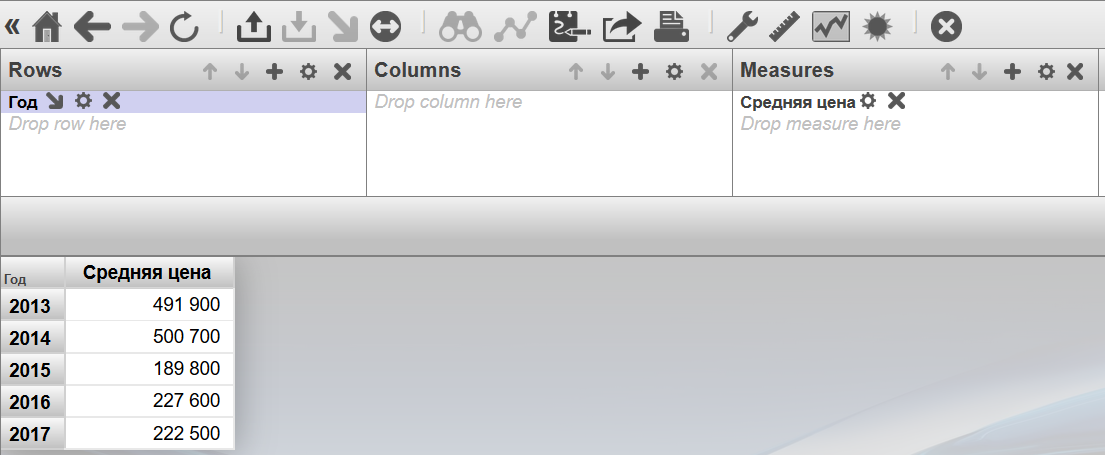
The next stage is visualization. Before saving, simplify the pivot table and save it as TickersByYears.
Building a dashboard (Dashboard)
User Portal is a web application for creating and using dashboards ( indicator panels ). Dashboards contain widgets: tables, graphs and maps based on summary tables created by analysts in the Analyzer.
To go to the DeepSee User Portal, open the System Management Portal → DeepSee → Select Region → User Portal.
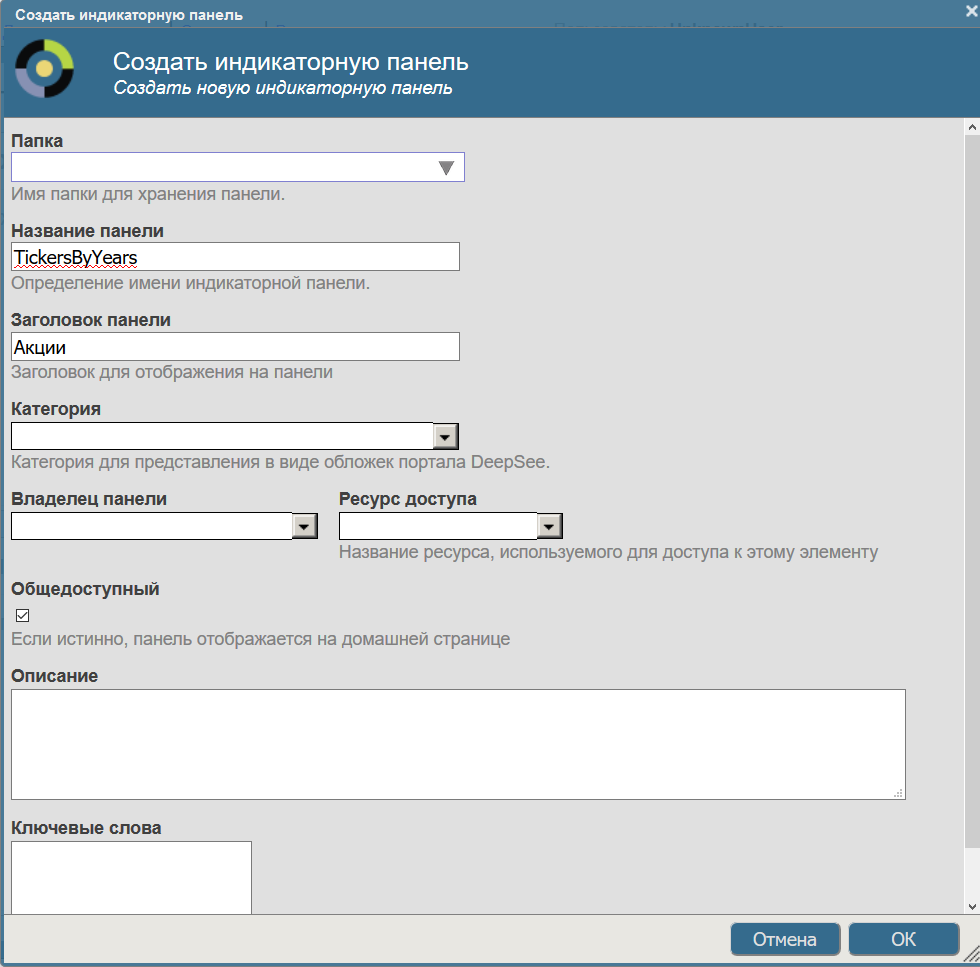
Create a new dashboard by clicking on the arrow on the right → add → add display panel
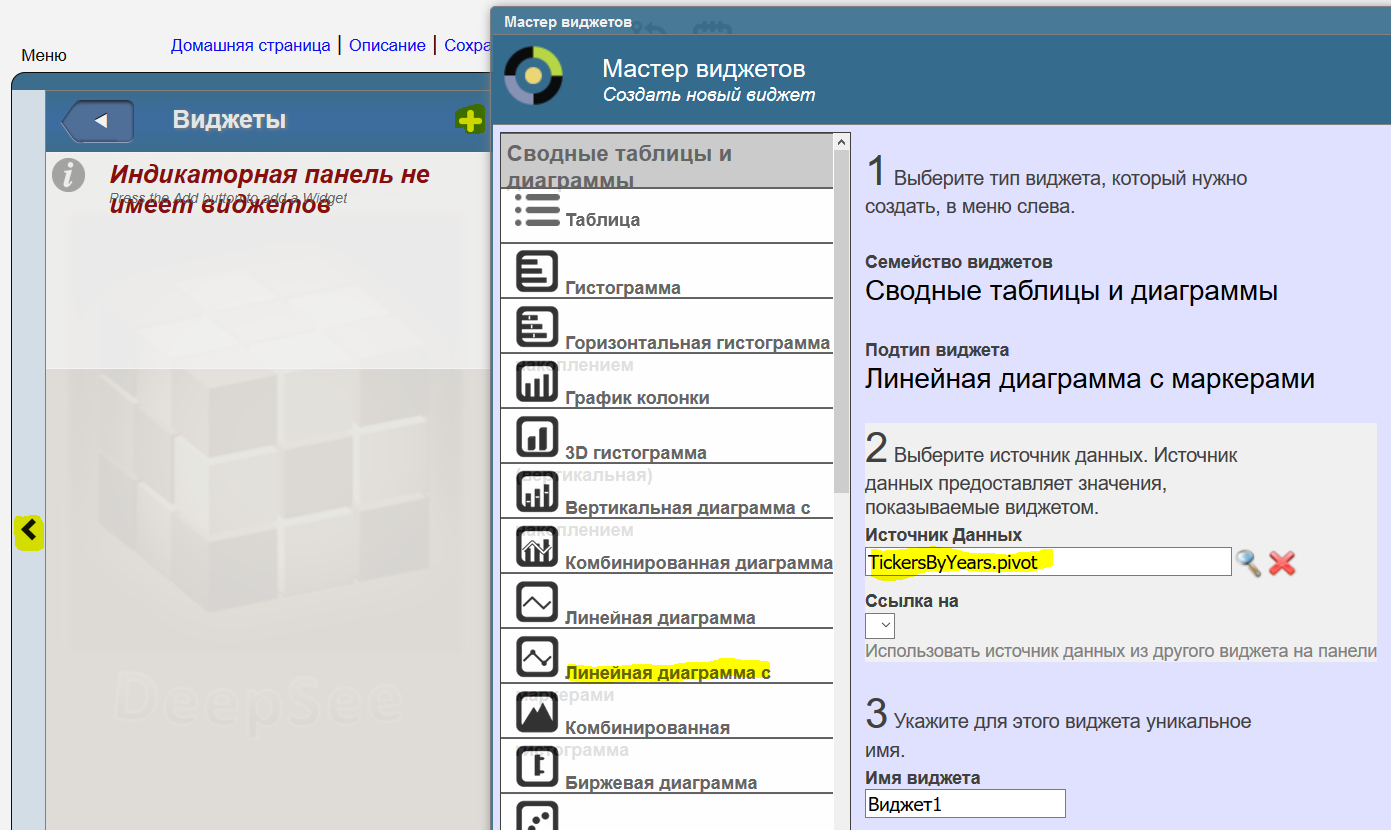
Create a widget by clicking the arrow on the right → Widgets → "+" → Line chart with markers. As the data source, select TickersByYears:
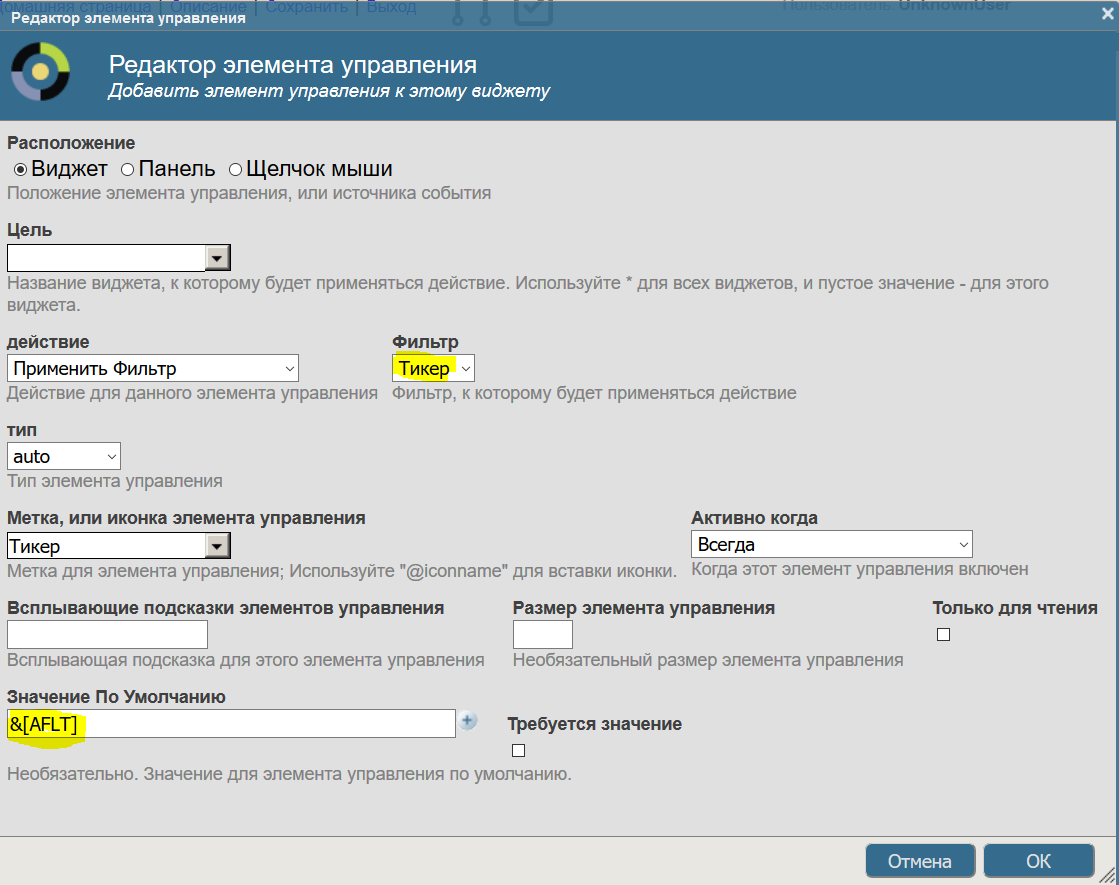
However, the reader will argue - this is the average temperature in the hospital. And he will be right. Add filtering by tool. To do this, click the arrow on the right → Widgets → Widget 1 → Controls → "+". The form for creating a new filter is as follows:
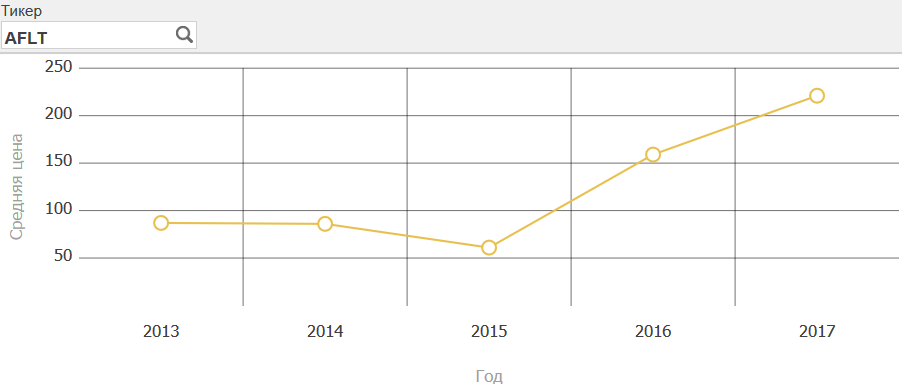
This is how our filter widget looks like. The user can change the filter value to any other.
After that, save the dashboard.
Installing MDX2JSON and DeepSeeWeb
To visualize the created dashboard, you can use the following OpenSource solutions:
- MDX2JSON - REST API provides information about cubes, pivots, dashboards and many other DeepSee elements, in particular, the results of MDX queries, which allows you to embed the user interface of the analytical solution on the DeepSee into any modern Web or mobile application.
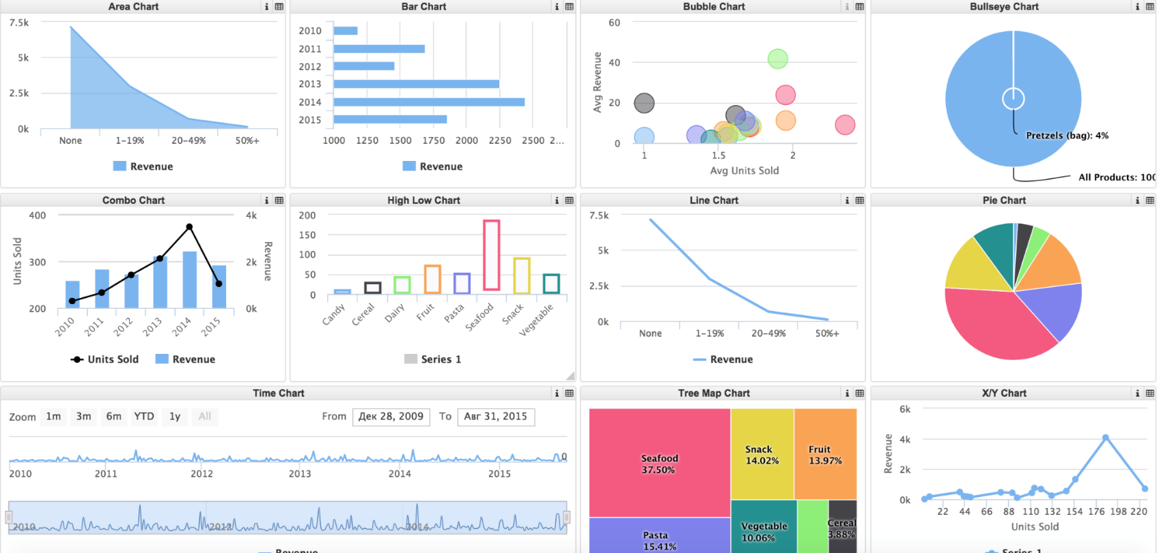
- DeepSeeWeb - AngularJS application that provides an alternative implementation of the DeepSee user portal. Can be easily customized. Uses MDX2JSON as a backend. Here is an example of a dashboard rendered in DeepSeeWeb:
Installing MDX2JSON
To install MDX2JSON:
- Download Installer.xml and import it to any area using Studio, System Management Portal or
Do $System.OBJ.Load(file). - Run in terminal (user with% ALL role):
Do ##class(MDX2JSON.Installer).setup()
To check the installation, you need to open the page http://server:port/MDX2JSON/Test?Debug in the browser. You may need to enter a username and password (depending on server security settings). A server page should open. If you get an error, you can read on the Readme and Wiki .
Install DeepSeeWeb
To install DeepSeeWeb you need:
- Download the installer and import it to any area using Studio, System Management Portal or
Do $System.OBJ.Load(file). - Run in terminal (user with% ALL role):
Do ##class(DSW.Installer).setup()
To check the installation, open the browser page http://server:port/dsw/index.html . The authorization page should open. The SAMPLES area contains many ready-made dashboards and all of them are automatically displayed in DeepSeeWeb.
Visualization
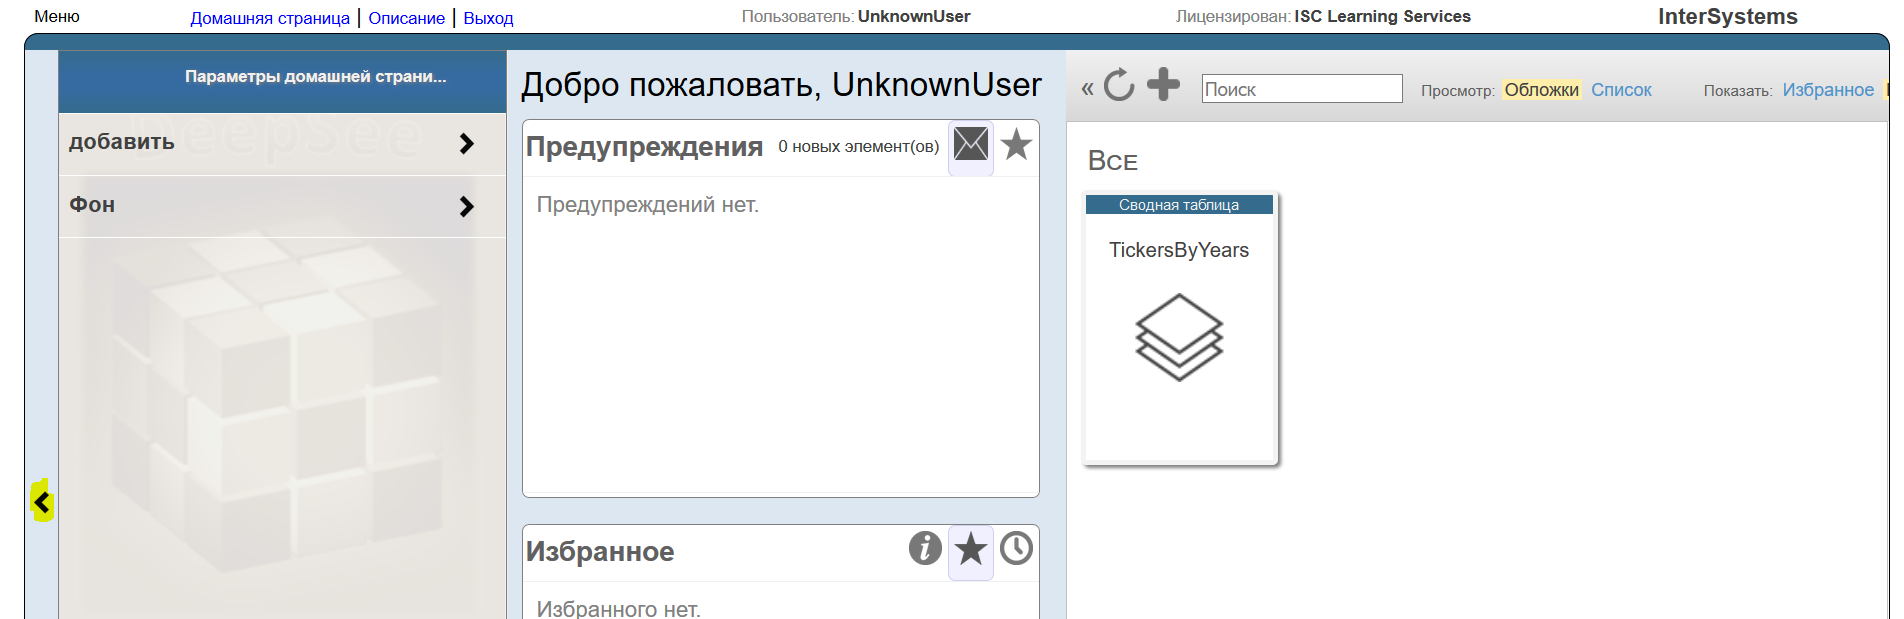
Open http://server:port/dsw/index.html and log in, you also need to specify the area with the cube. A list of dashboards will open, in our case there is only one “Promotions” dashboard created. Open it:
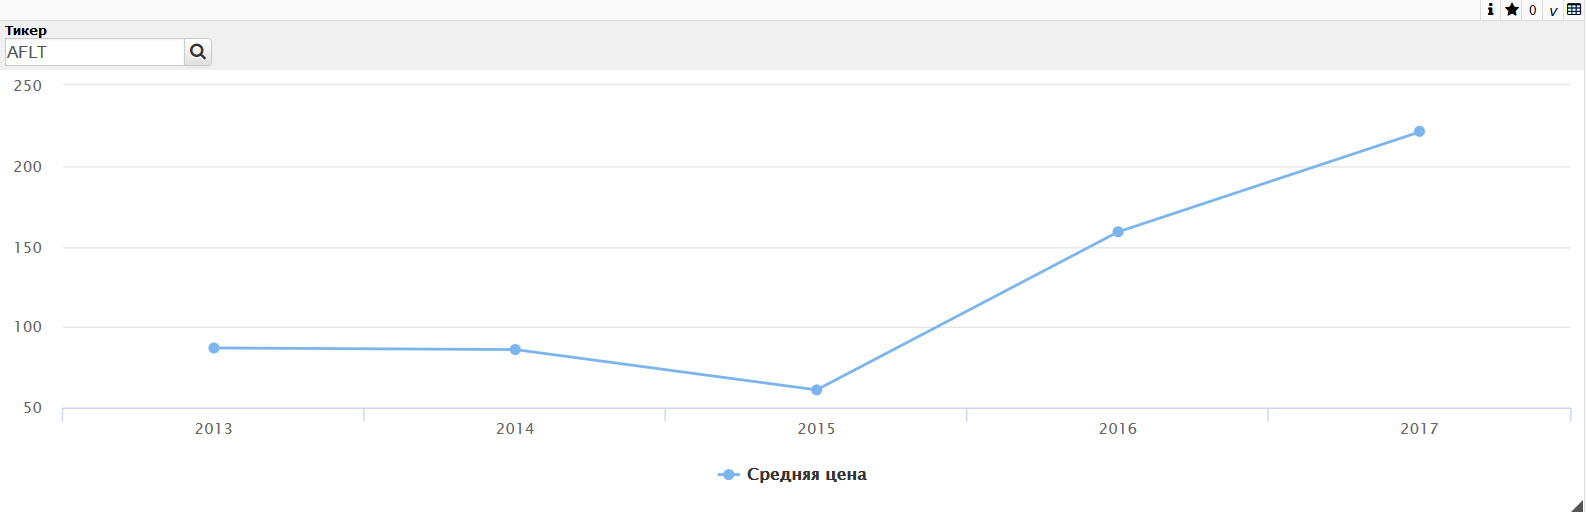
Our created widget is displayed. It supports the Drilldown and filter created in the DeepSee User Portal:
findings
InterSystems DeepSee is a powerful tool for creating OLAP solutions, providing developers with the tools to create and integrate analytical OLAP functionality into their applications, which is able to work on operational application databases without creating a separate infrastructure for solving analytical tasks.
Links
')
Source: https://habr.com/ru/post/335586/
All Articles