Building recommendations for a job site. Lecture in Yandex
Recently, we have been writing a lot about machine learning contests, mainly considering them from the point of view of the participants. But to organize and properly conduct a competition is also a difficult task. Companies learn from their mistakes and in the following times change the structure of competitions. For example, RecSys Challenge 2017, taking into account past experience, was conducted in two successive stages. Andrei Ostapets from Avito tells about these stages, about various signs based on the user's behavior history, and whether or not it is always necessary to use complex models to solve the problem. Andrey's team took the seventh place in the RecSys Challenge.
- Hello! My name is Andrey, I work in Avito, and today I’ll tell you about our team’s participation in the RecSys Challenge 2017 competition.
First, I will tell about the contest itself and about what task was being solved. Then I will tell you about the decision of our team and at the end about the results obtained.
')
RecSys Challenge is a competition held within the framework of the RecSys conference. This is a major conference, this year it will be held for the 11th time. There are a lot of scientific reports at the conference, but from the very beginning, the organizers had a tradition to hold a competition on recommendations. Every year a company organizes a competition, various teams participate. In the end, all come to the workshops and talk about their decisions. This is a plus compared to Kaggle: you can tell about your algorithm, publish an article in a separate journal devoted to the conference workshop, find out some details from the contest organizers and see what solutions other participants used.
Last year, as in this, the competition was held by XING. This is the German equivalent of LinkedIn, which is dedicated to the recommendations of the work. Last year, the Avito team also participated in the RecSys Challenge, we took the seventh place and talked about this in a training session at the SAD. Here is a link to our story.
Last year we were given a fairly standard task. Interactions were given for the year, and it was required to predict which vacancies the site users would click on. We obtained quite good results, used factorization machines, everything was quite good, but there were also several problems for the organizers.
First of all, those algorithms that selected the best vacancies among those recommended by the XING platform worked well. Known fact: recommendations have an impact on user actions. Thus, the algorithms that tried to predict what the platform would show, and based on this, ranked jobs, worked well. On the one hand, this is not bad, but if you try to inject such an algorithm into production, you will encounter a problem when the algorithm essentially depends on another algorithm.
The second problem was that users often made repeated clicks. Approximately 30% of clicks were repeated. And it was a pretty strong feature. If the user has already clicked on this vacancy - recommend it again. This may not be such a big problem, but it is unlikely that users in the recommendations want to see only items for which they have already clicked. Most likely, they want to see something new.
In 2017, XING fixed these problems. To solve the first problem, they organized a two-stage competition. Offline - everything is standard, given a training sample, a test sample that is historical, you need to send solutions and try to guess how users clicked. All this - on historical data.
The second stage is an online stage when each team was given a separate traffic section, which showed only the recommendations of the team. Thus, all traffic was completely dependent on the team and all the clicks depended on the recommendations given by the team.
To solve the problem of repeated clicks, the organizers focused on the cold start task regarding vacancies. All vacancies that were laid out were new. There was no history of clicks on them, it was possible to rely only on the content of the vacancy.
It was necessary to identify users who may be interested in getting push for the online stage. After the team sent the solution, users received a push if the application was installed. They could click on this job.
It was necessary to identify those users who are suitable candidates for the specified vacancy. More on this later.
For the two phases, practically the same metrics and data sets were used. Offline stage served only as a selection of teams in the second stage of the competition. Those teams that occupied the top places, passed into the second stage, and they already had a part of traffic, where they could send recommendations. The second stage lasted five weeks. Every day it was necessary to send recommendations. The final result is the sum for the two best weeks.
How to use the recommendations?
With the offline stage, everything is clear, this is historical data. You send the file with the solution - you immediately get the result. The only restriction: no more than a hundred users could be recommended for vacancies. For the online stage all the more interesting. The organizers laid out targeted vacancies to target users, and were given 24 hours to prepare a submission file that included these users and these vacancies. For each job, you could provide a list of no more than 255 users. This is done so that some vacancy does not get biased when all recommendations go to this vacancy. The user could get no more than one push per day, so as not to burden users, so that they would not get tired of the recommendations.
There were four different ways to deliver recommendations. The first is a list of recommendations. This is the desktop version. If the user had a mobile version installed, then he came to push, he followed the link and immediately saw the vacancies that were recommended to him. With the desktop version, there was a Jobs link. When a new recommendation arrived, it was all updated on the site, and the user could see the new vacancy.
Further recommendations were shown on the home page. When a user visits the site, he shows the news, among which could be shown and recommendation.
The third option is email. If the organizers saw that the user did not visit the site, they sent him a letter saying that a new vacancy was recommended to you. If you're interested, follow the link.
The fourth part is quite curious. This is a recruiter recommendation list. XING is aimed not only at users, but also at recruiters, so for each job there is a separate page where the recruiter can see the recommendations that XING gives him. In them - those users who, according to XING, are suitable for this vacancy. Here is indicated for each person his current job, previous work and the opportunity to contact the person if the recruiter considers that he is suitable for this vacancy.

On the slide - the data that were provided to participants.
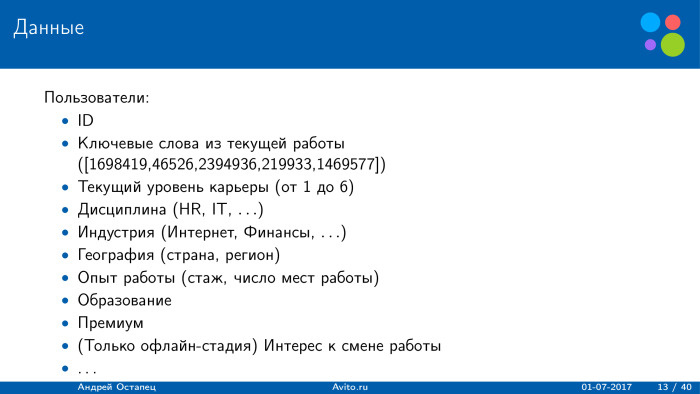
For users, data was mostly taken from the questionnaire. Of the interesting things: the organizers provided keywords from the current or possibly previous work of the user, but they themselves carried out word processing, and the data were provided in the form of a list of natural numbers. This reduced the range of work with texts. It was possible to apply many things, but here we did not know the original words and did not know whether these numbers were original words or digrams, trigrams, etc.
The current career level was also provided - a natural number from 1 to 6. The higher, the higher the career level. Discipline, industry, geography, etc.
An interesting feature was provided for the offline stage - interest in changing jobs. But she was no longer in the second stage. The user could be a premium, he could pay XING money. This will affect the functionality and quality.
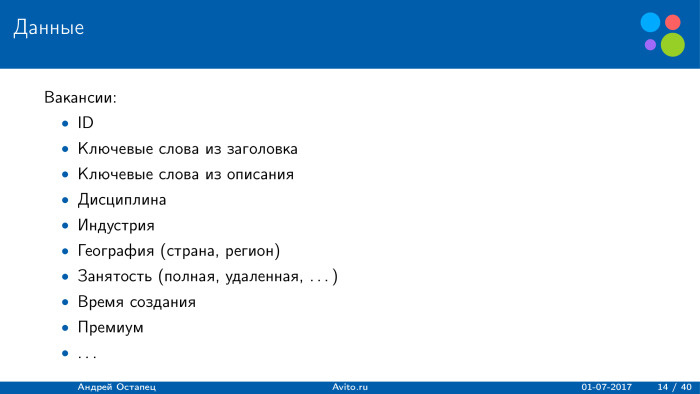
Similar signs were provided for vacancies. The difference is that the keywords were taken from the title of the vacancy and from the description of the company. All other signs are similar. Also, the vacancy could be paid or free.
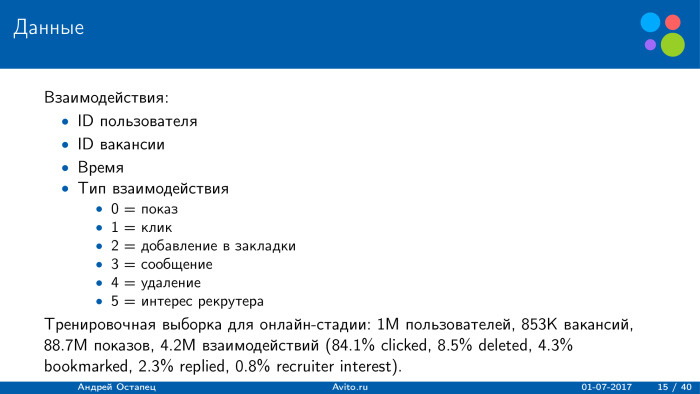
The interaction file included only four fields: which user for which vacancy clicked at which point and what was the type of interaction. There were six types. The first is a show: this job was shown to the user. The second is the option to add to bookmarks: the user has added a vacancy to the bookmarks to return later. Third, he clicked on the "contact recruiter" button. Fourth, he deleted the vacancy, said that I was no longer interested in it, I do not want to see it anymore. The last is the recruiter's interest: the recruiter has moved from his page to the profile of this user.
For small statistics, the distribution of the training sample in the online stage is shown. There were a million users in training, 750 thousand vacancies, about 90 million impressions, about 4 million interactions. That is, users click less frequently, and most of the interactions are clicks. In second place is the removal of the recommendation. Users quite often delete recommendations and say they do not want to see them anymore. The remaining types were less.
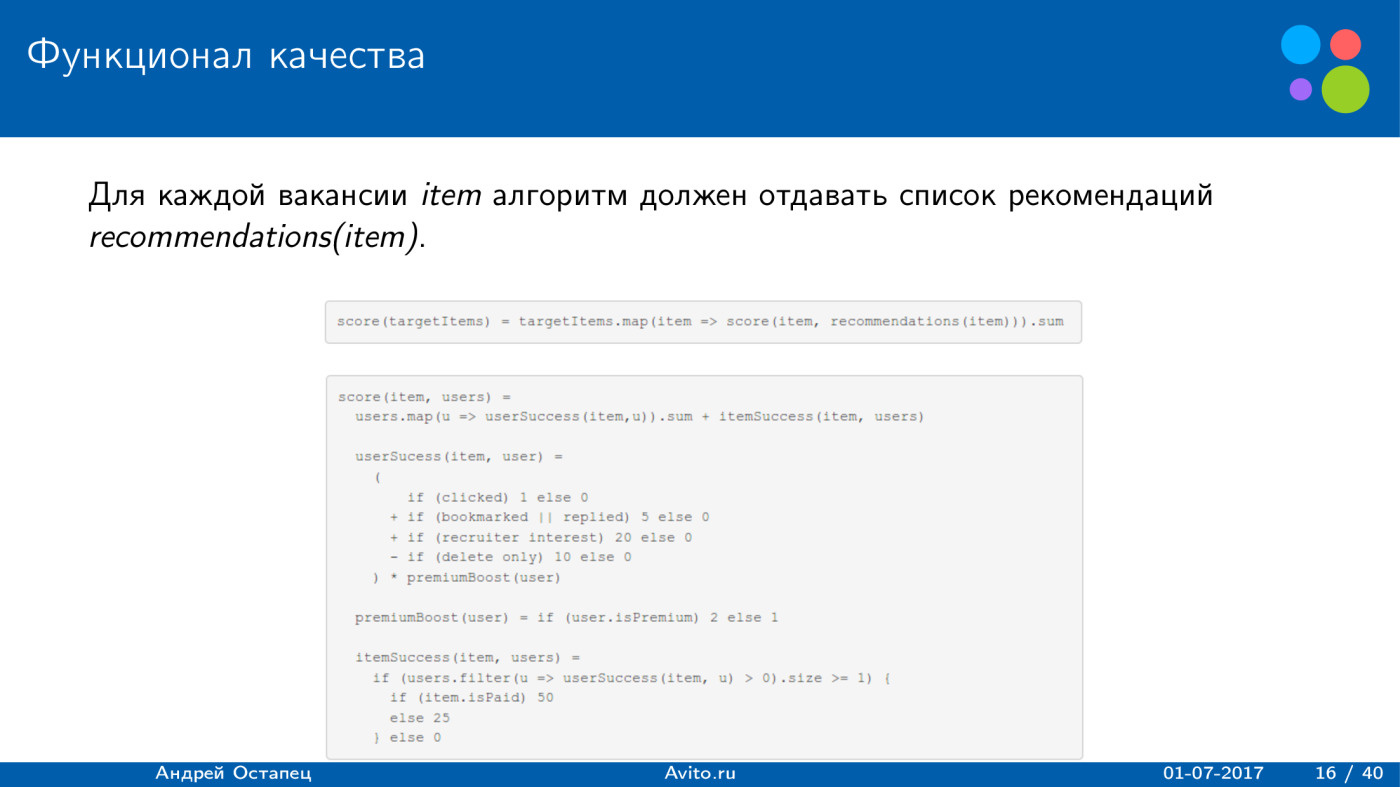
What quality functionality was used? He was rather unusual. Participants were required to provide a list of recommendations for each job. The total amount received by the decision was calculated for all vacancies. And the assessment for each vacancy was divided into two parts: user success, which determines how successful it is for users, and item success - whether this list of recommendations was successful for this vacancy.
User success was considered simple. If a user clicked on a vacancy, it turned out 1 point. If I clicked the button “Add to bookmarks” or “Answer” - 5 points, and if he performed both actions, only 5 points would still be added. If a recruiter showed interest in him, 20 points were added to the assessment. If the user removed the job - minus 10 points. And this whole amount was multiplied by two, if the user was a premium and paid XING money.
With item success, everything is a little more interesting. For each vacancy, a list of users was provided, and if at least one user had a successful recommendation, then if item was paid, it turned out to be 50 points, and if the free recommendation was 25. Well, if there were no successful candidates for the vacancy, one person did not click and did not receive an amount greater than zero, then 0 was added to the estimate, we did not receive anything.
The question may immediately arise: what is the maximum estimate that could be obtained for one user-vacancy pair, based on this functional? 102. Clicked on the job - plus 1, added to bookmarks - plus 5, the recruiter showed interest - plus 20, the user of the premium - multiply by two. We get 52, and this user is a successful recommendation for this job. If item is paid, we get another 50 points, totaling 102.
Obviously, the minimum for a recommendation is just 1 point. This is if the user just clicked on the job and there is an item that is already successful for this job.
What are the challenges from the organizers?
The balance between the interests of users and recruiters is based on the functionality of quality. User click means nothing, it is much more profitable if a recruiter showed interest in him.
The second challenge is the balance between relevance and earnings. As shown, the score was highly dependent on whether the user and the item are premium or whether the XING platform receives money from them.
The third is the “cold start” problem. All jobs did not have a history, and this is a more difficult task, since we could only use ad content.
The fourth is the clever sending of pushes. It is necessary to determine which user to send a push to which is not, and at what time. About this later.
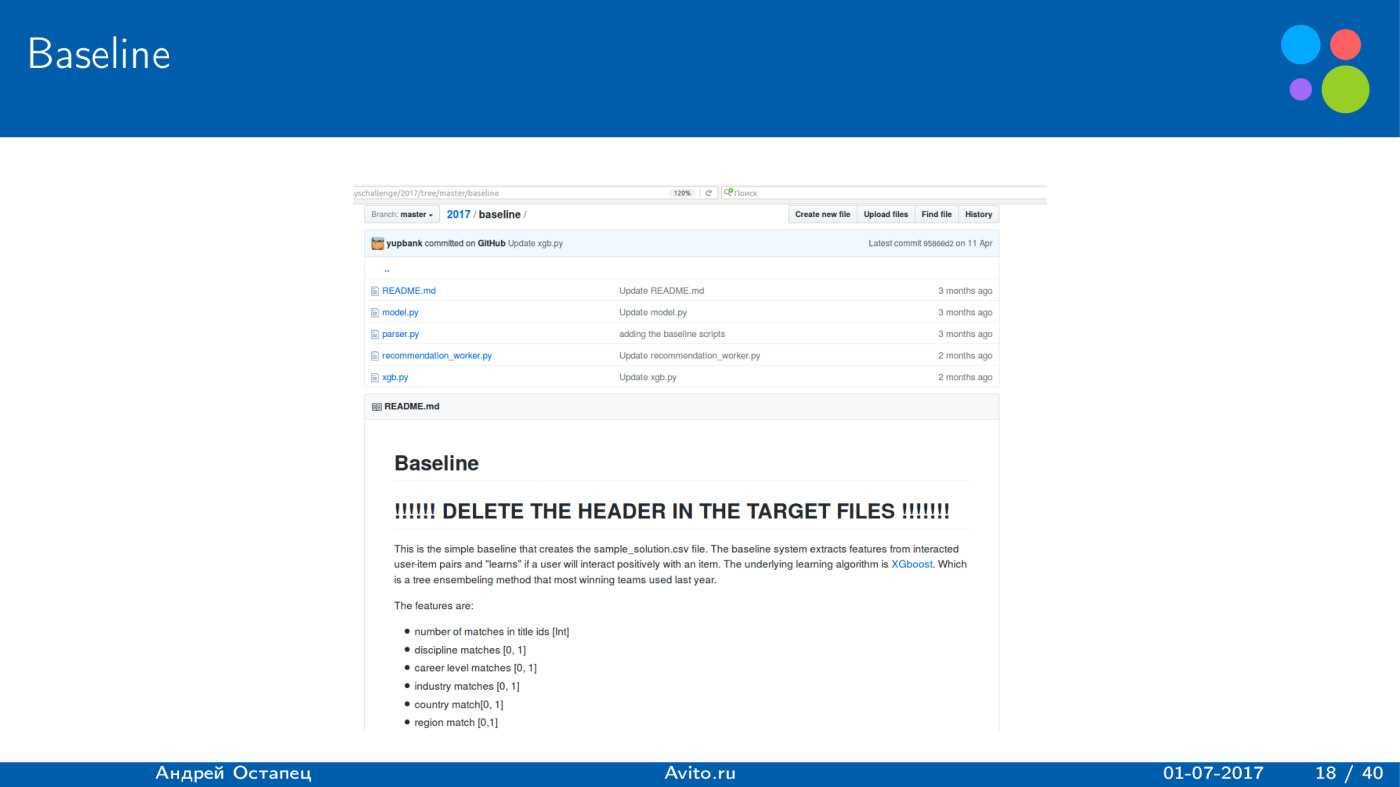
First, the organizers, as in many competitions, provided the baseline. It was extremely simple, but showed a good result. There were only six signs in it, five of which were binary: the number of matches for user titles and vacancies, the natural number, and then simple matching of the discipline, career level, industry, country and region. For learning, only interaction was used. If the user removed a vacancy, the target variable was obtained equal to zero, and if the user performed a positive action - one. It was trained on XGBoost and gave the result of 10,000 on the leaderboard. Pretty good.
If we simply recommend the top 100 most active users for all vacancies on the offline stage, we get a result of 519. XGBoost gives a lot more.
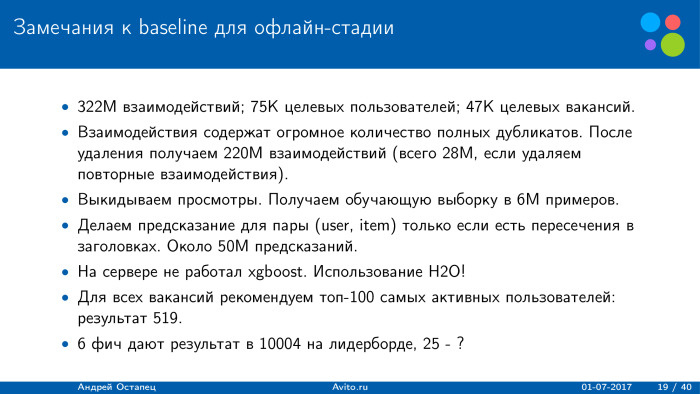
What was the sample size? Only 300 million interactions, 75 million target users for whom recommendations had to be built, and about 50 thousand targeted vacancies.
One of the features of dataset that you could immediately see: the interaction contains a huge amount of complete duplicates. If we clean them, we already get 220 million interactions, which allowed us to speed up the algorithm. We study only on interactions. There are fewer interactions - only 6 million. We get a training sample of 6 million.
To speed up the process, the prediction for the pair was made only if there is an intersection of the headers. As a result, the sample for which XGBoost should build a prediction is approximately 50 million. When I tried to reproduce this baseline, I ran into the problem that XGBoost did not work on the server, and I just rewrote on H2O, but this did not have a significant effect on the solution. .
It would seem a logical thing - just add new features to this baseline. Five binary features give a good result, so let's just throw in features and get better results.
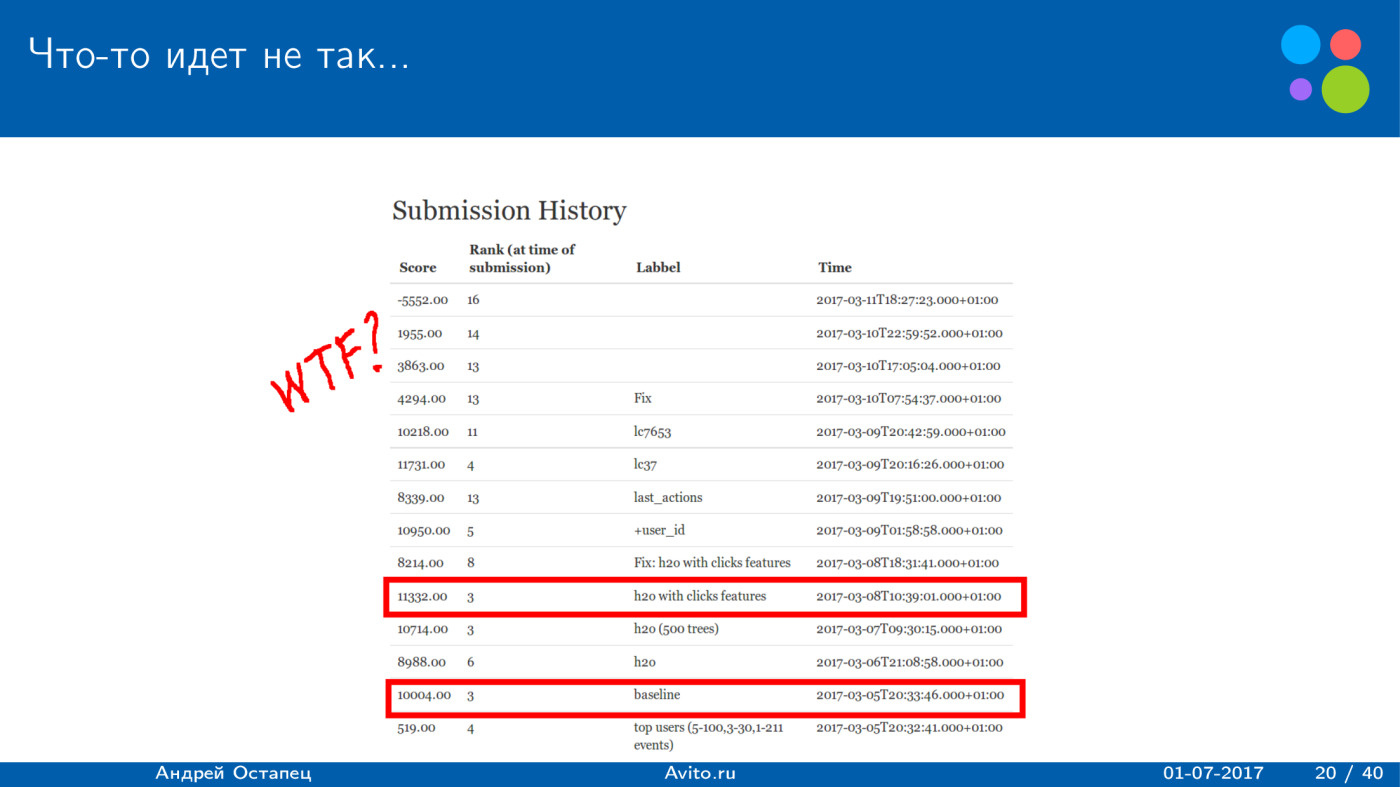
After I added 19 more and it turned out 25, I really managed to slightly improve the result. He became about 11 thousand, but further improvements were not obtained. Moreover, at the end there were various experiments: to make a training sample differently, to give different events different weight, just add views with a small weight, which is more than the weight of removal, but less than the positive action. But all this led to the fact that the score fell, until finally the result turned out to be minus 5000. Badly, we mainly recommend what users delete.

Why did this happen? Most likely, there are two problems. First - I could not set up a negative sampling. When I was just throwing scans, the algorithm started to give a lot of predictions about simple scans.
The second problem is that I optimized the standard deviation of XGBoost, and this is probably bad. The functional is ground on money, and we optimize RMSE. But with this it was necessary to do something.
Obviously, the attributes that were added are logical and should improve the score. So I decided to use some simple algorithm to check the quality of the signs. To calculate the estimate for a user-vacancy pair, I simply used the sums of three types, which are also reasonable. The proximity of the user profile to the vacancy profile — we look only at the correspondence of the content between them.
Then we build different interests to the parameters, based on the user's history. We do not use the user profile in any way; we only look at what he clicked and what he deleted.
The third part, which was relevant for the offline stage: for some items and users, previous interactions were specified. They were few, but still they allowed a little to raise the score.
It is logical that if there are 50 thousand users and 50 thousand vacancies, then it is impossible to overthrow them all. It is necessary to select a set of suitable. To reduce the amount of predictions, the following heuristics were used: for a couple, we calculate the estimate only if there is some intersection by the vacancy headings and the user profile, or if the user viewed an ad that intersects with the vacancy. For example, the user indicated that he is an analyst, and he once made just one click on the data scientist. Potential recommendations are vacancies, where there are words “analyst”, “data scientist” and that's it. Obviously, this is not the best heuristics, but it can significantly reduce the size of the sample for which it is necessary to build predictions.
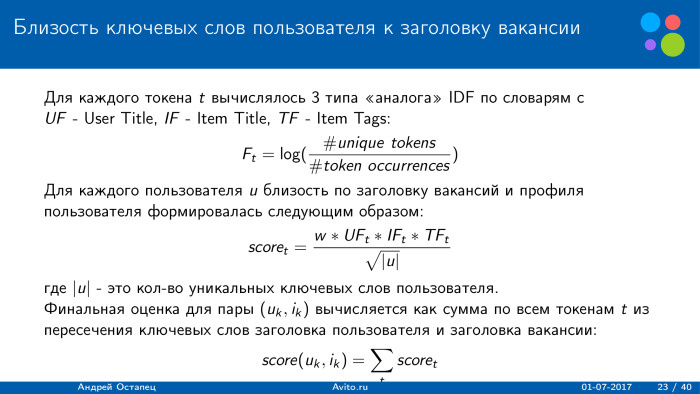
How were the various intimacies considered? As an example, consider the proximity of keywords to a job title. The basic idea is that we can use an analogue of IDF in three dictionaries, that is, we have words from the user profile and from the title of the item, as well as tags of the item. For them, calculated analogue IDF. We simply take the logarithm of the number of unique tokens on the occurrence of tokens, and the less often the token is found, the more weight it receives. When we consider proximity by profile, we simply ration it by the number of unique user keywords. The less keywords he has, the more weight this amount will receive.
For each type of proximity, we select our own weight W. As a result, the final assessment for the user-vacancy pair is calculated as the sum of all user keyword transfers from the vacancy header with just the given weights. Such amounts were calculated for all possible options specified in the user profile and in the vacancy. We already get a lot of signs.
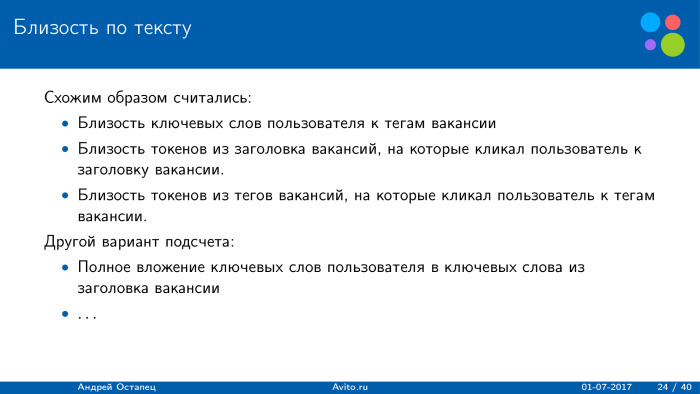
Another text counting option is the full embedding of keywords, the keywords from the job title. This also seems logical if the user, for example, has the “analyst” indicated, and the vacancy - “analyst to the bank”. Perhaps this is also a signal. But here the peculiarity is that it is not known how the organizers obtained these keywords, whether they deleted the stop words or not. Therefore, a fairly standard approach was used, and it worked quite well.

How were proximity considered on other grounds? On the career level, everything was quite simple: it was from 1 to 6, so by profile we can simply consider the difference. If the difference is small, we increase the weight; if it is large, we decrease. It is funny that users, for whom it was indicated that they were students, also sometimes looked for vacancies where directors of companies were required. , , - . , . — . .
, . . : , 1, .
, , . , , . , . , . , , , , . , 95% , . .
. . , score, — : , , . . , , - , — .
, : , . , . - , , . , - VIP. .
? . -, , , , . . , .
, P , . — , .
. « », , . : -. - , . , user success, - . , . 70% . , . , , . — - .
-, , , , . .
. 20 ., 32 . score , .
. , , 30 19 ., .
, , — , , , , . . , , — IDF. , . , , .

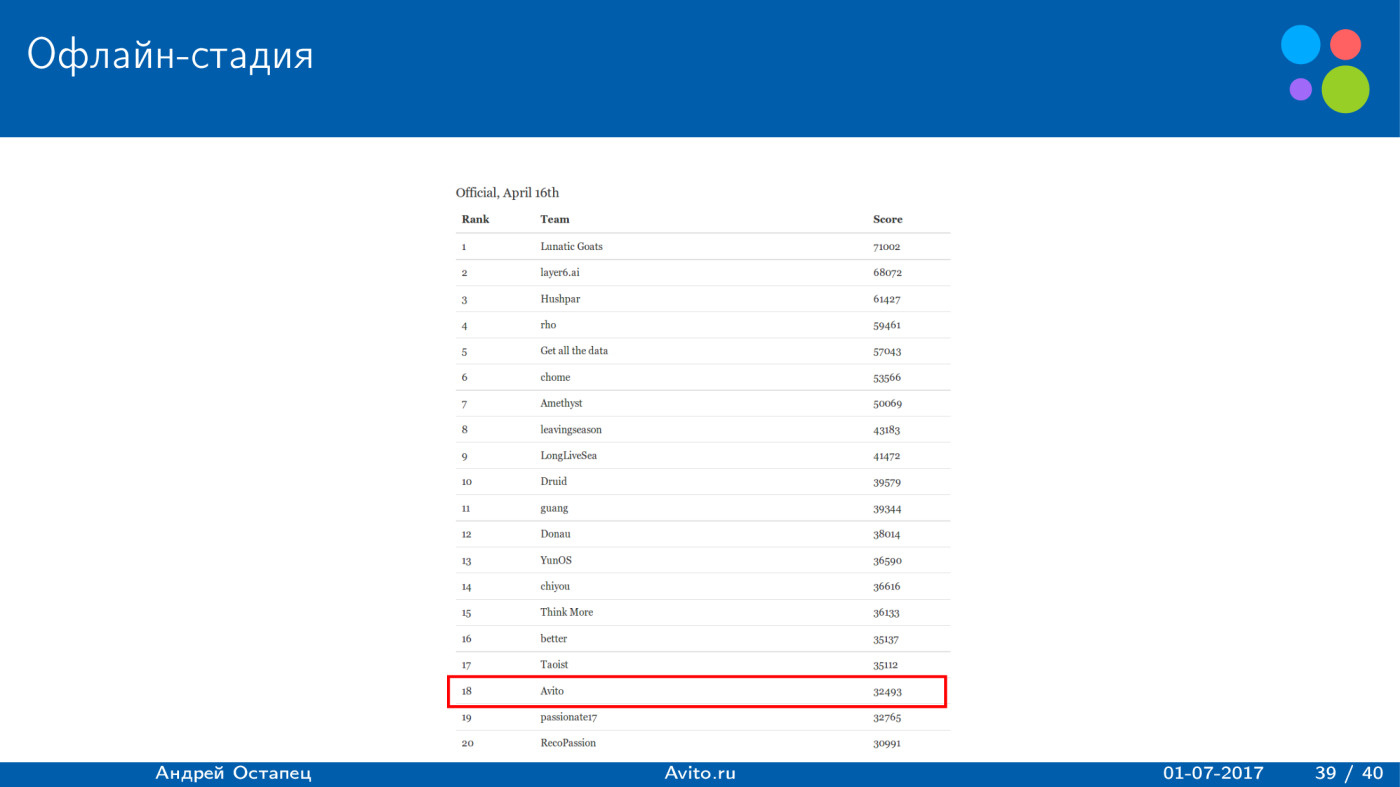
-20 . , , 18 , -.
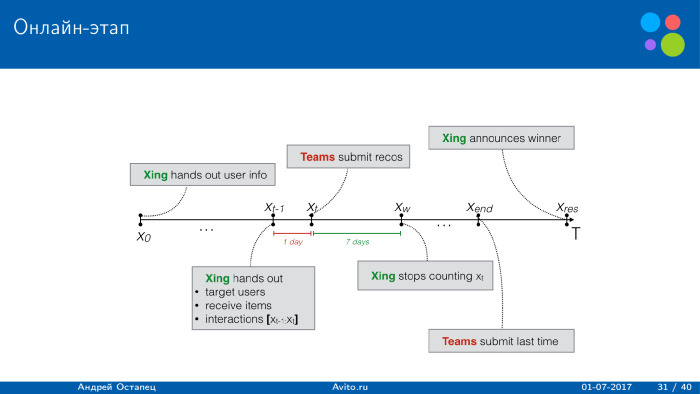
- : XING , . XING , , 24 . 24 . , . 24 , .
. 7 , , - , 8 — . .

, . 11 . , , , , , . , , score .
, score . .

. , : , , 10 , .

, , , score . 4800, 3800, . , , , , 50 . , 10 . . , 50 . — . , , — .
Avito, : . , . LCE, Avito Data Science meetup — .
, 8%, . , .
, score .

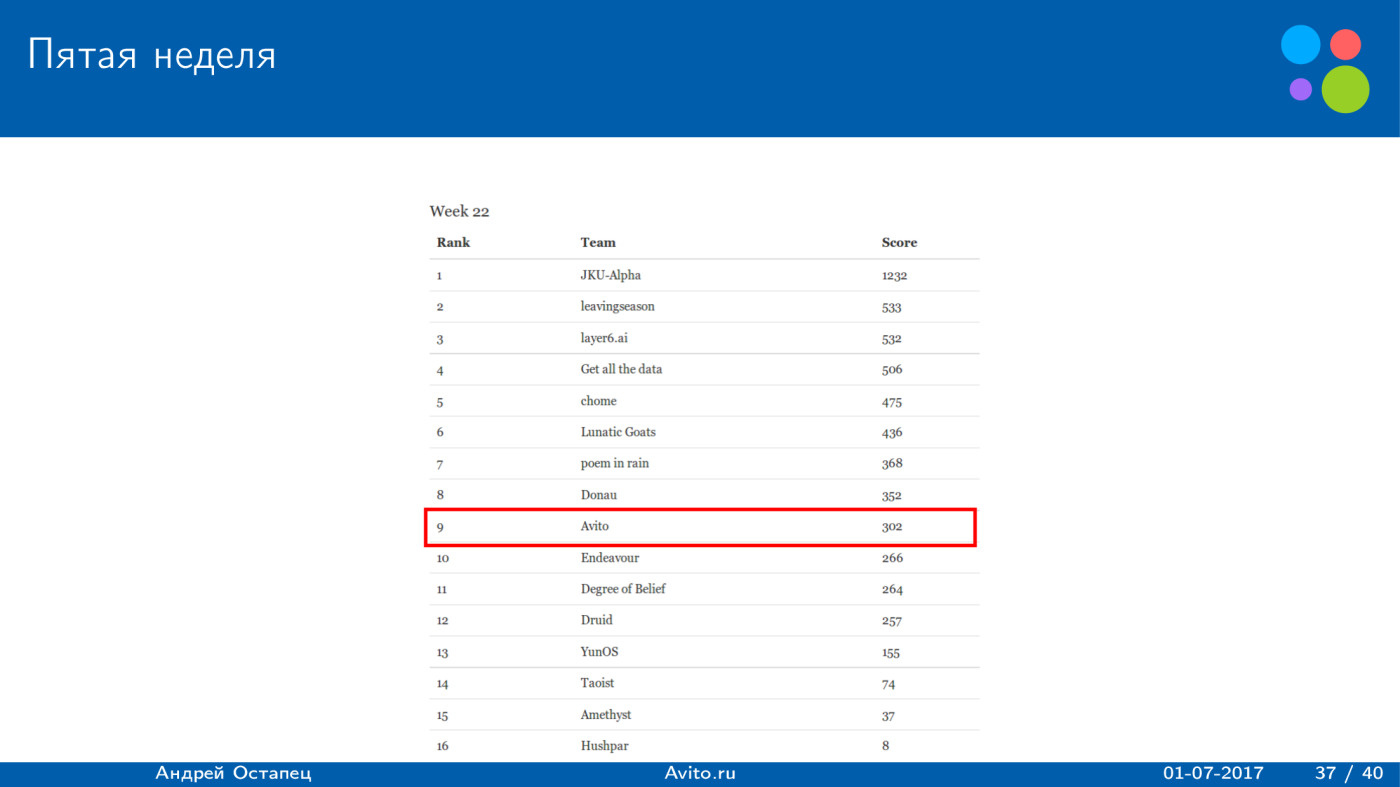
: score . 5 . , 2 . , , , , , . . , - , , score . , 21 , . , , , score , .
, , , . , , , , score. score — .
score , 300 . , , .
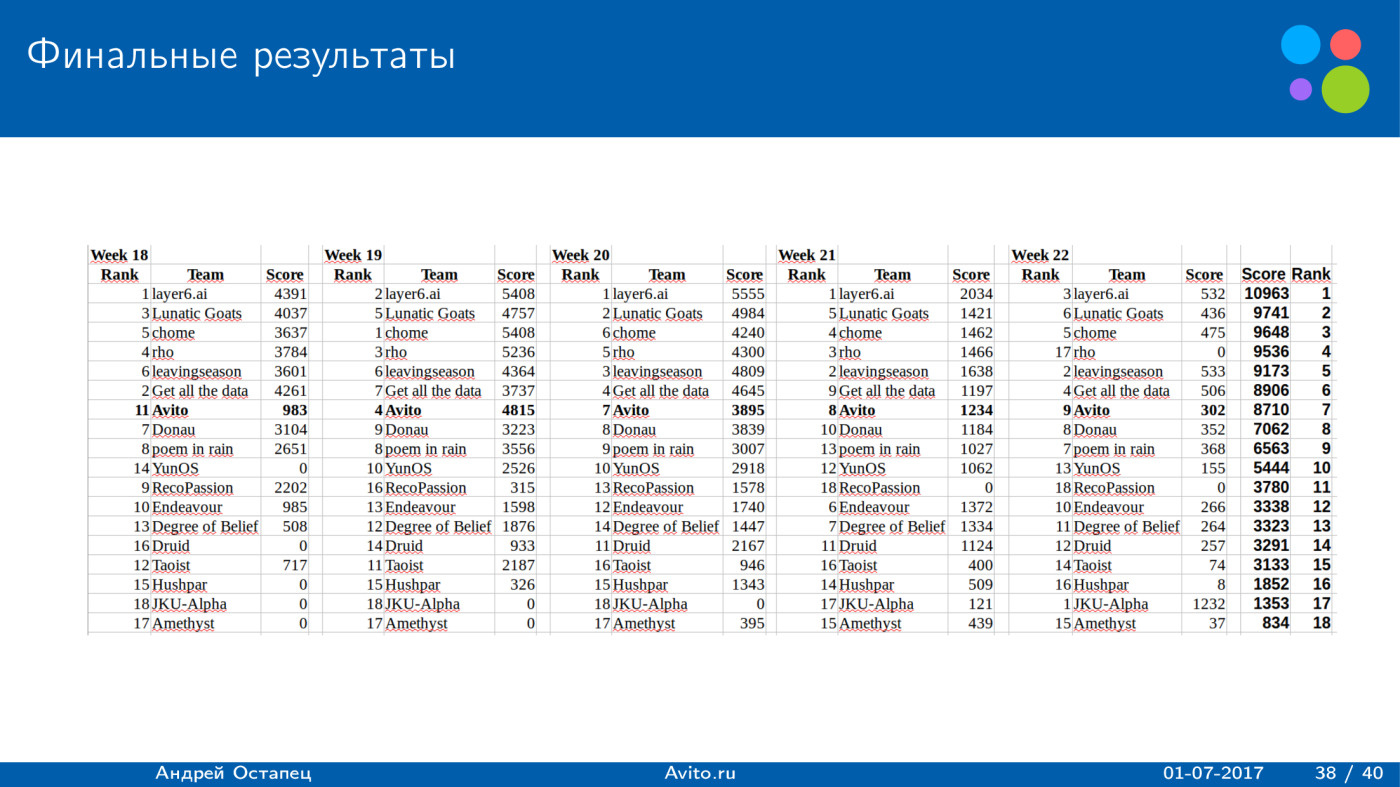
8700 . — 11 . . , . — 9700, 8700, . 1700 . , , , , , , . , score. ? , .
: , , - , , , 18 . , 18 .
, , , .
?
— . , 1 , 50. , , - , , , . — score -. .
— . , , — , . -, - , . , score . . , -, score.
— -. . /-: 50 . , , , — , , , 25 . . . score , , . , , .
, , — , , , score 7 . , 7 . : .
— . , — — - . score , . , , , .
- Hello! My name is Andrey, I work in Avito, and today I’ll tell you about our team’s participation in the RecSys Challenge 2017 competition.
First, I will tell about the contest itself and about what task was being solved. Then I will tell you about the decision of our team and at the end about the results obtained.
')
RecSys Challenge is a competition held within the framework of the RecSys conference. This is a major conference, this year it will be held for the 11th time. There are a lot of scientific reports at the conference, but from the very beginning, the organizers had a tradition to hold a competition on recommendations. Every year a company organizes a competition, various teams participate. In the end, all come to the workshops and talk about their decisions. This is a plus compared to Kaggle: you can tell about your algorithm, publish an article in a separate journal devoted to the conference workshop, find out some details from the contest organizers and see what solutions other participants used.
Last year, as in this, the competition was held by XING. This is the German equivalent of LinkedIn, which is dedicated to the recommendations of the work. Last year, the Avito team also participated in the RecSys Challenge, we took the seventh place and talked about this in a training session at the SAD. Here is a link to our story.
Last year we were given a fairly standard task. Interactions were given for the year, and it was required to predict which vacancies the site users would click on. We obtained quite good results, used factorization machines, everything was quite good, but there were also several problems for the organizers.
First of all, those algorithms that selected the best vacancies among those recommended by the XING platform worked well. Known fact: recommendations have an impact on user actions. Thus, the algorithms that tried to predict what the platform would show, and based on this, ranked jobs, worked well. On the one hand, this is not bad, but if you try to inject such an algorithm into production, you will encounter a problem when the algorithm essentially depends on another algorithm.
The second problem was that users often made repeated clicks. Approximately 30% of clicks were repeated. And it was a pretty strong feature. If the user has already clicked on this vacancy - recommend it again. This may not be such a big problem, but it is unlikely that users in the recommendations want to see only items for which they have already clicked. Most likely, they want to see something new.
In 2017, XING fixed these problems. To solve the first problem, they organized a two-stage competition. Offline - everything is standard, given a training sample, a test sample that is historical, you need to send solutions and try to guess how users clicked. All this - on historical data.
The second stage is an online stage when each team was given a separate traffic section, which showed only the recommendations of the team. Thus, all traffic was completely dependent on the team and all the clicks depended on the recommendations given by the team.
To solve the problem of repeated clicks, the organizers focused on the cold start task regarding vacancies. All vacancies that were laid out were new. There was no history of clicks on them, it was possible to rely only on the content of the vacancy.
It was necessary to identify users who may be interested in getting push for the online stage. After the team sent the solution, users received a push if the application was installed. They could click on this job.
It was necessary to identify those users who are suitable candidates for the specified vacancy. More on this later.
For the two phases, practically the same metrics and data sets were used. Offline stage served only as a selection of teams in the second stage of the competition. Those teams that occupied the top places, passed into the second stage, and they already had a part of traffic, where they could send recommendations. The second stage lasted five weeks. Every day it was necessary to send recommendations. The final result is the sum for the two best weeks.
How to use the recommendations?
With the offline stage, everything is clear, this is historical data. You send the file with the solution - you immediately get the result. The only restriction: no more than a hundred users could be recommended for vacancies. For the online stage all the more interesting. The organizers laid out targeted vacancies to target users, and were given 24 hours to prepare a submission file that included these users and these vacancies. For each job, you could provide a list of no more than 255 users. This is done so that some vacancy does not get biased when all recommendations go to this vacancy. The user could get no more than one push per day, so as not to burden users, so that they would not get tired of the recommendations.
There were four different ways to deliver recommendations. The first is a list of recommendations. This is the desktop version. If the user had a mobile version installed, then he came to push, he followed the link and immediately saw the vacancies that were recommended to him. With the desktop version, there was a Jobs link. When a new recommendation arrived, it was all updated on the site, and the user could see the new vacancy.
Further recommendations were shown on the home page. When a user visits the site, he shows the news, among which could be shown and recommendation.
The third option is email. If the organizers saw that the user did not visit the site, they sent him a letter saying that a new vacancy was recommended to you. If you're interested, follow the link.
The fourth part is quite curious. This is a recruiter recommendation list. XING is aimed not only at users, but also at recruiters, so for each job there is a separate page where the recruiter can see the recommendations that XING gives him. In them - those users who, according to XING, are suitable for this vacancy. Here is indicated for each person his current job, previous work and the opportunity to contact the person if the recruiter considers that he is suitable for this vacancy.
On the slide - the data that were provided to participants.
For users, data was mostly taken from the questionnaire. Of the interesting things: the organizers provided keywords from the current or possibly previous work of the user, but they themselves carried out word processing, and the data were provided in the form of a list of natural numbers. This reduced the range of work with texts. It was possible to apply many things, but here we did not know the original words and did not know whether these numbers were original words or digrams, trigrams, etc.
The current career level was also provided - a natural number from 1 to 6. The higher, the higher the career level. Discipline, industry, geography, etc.
An interesting feature was provided for the offline stage - interest in changing jobs. But she was no longer in the second stage. The user could be a premium, he could pay XING money. This will affect the functionality and quality.
Similar signs were provided for vacancies. The difference is that the keywords were taken from the title of the vacancy and from the description of the company. All other signs are similar. Also, the vacancy could be paid or free.
The interaction file included only four fields: which user for which vacancy clicked at which point and what was the type of interaction. There were six types. The first is a show: this job was shown to the user. The second is the option to add to bookmarks: the user has added a vacancy to the bookmarks to return later. Third, he clicked on the "contact recruiter" button. Fourth, he deleted the vacancy, said that I was no longer interested in it, I do not want to see it anymore. The last is the recruiter's interest: the recruiter has moved from his page to the profile of this user.
For small statistics, the distribution of the training sample in the online stage is shown. There were a million users in training, 750 thousand vacancies, about 90 million impressions, about 4 million interactions. That is, users click less frequently, and most of the interactions are clicks. In second place is the removal of the recommendation. Users quite often delete recommendations and say they do not want to see them anymore. The remaining types were less.
What quality functionality was used? He was rather unusual. Participants were required to provide a list of recommendations for each job. The total amount received by the decision was calculated for all vacancies. And the assessment for each vacancy was divided into two parts: user success, which determines how successful it is for users, and item success - whether this list of recommendations was successful for this vacancy.
User success was considered simple. If a user clicked on a vacancy, it turned out 1 point. If I clicked the button “Add to bookmarks” or “Answer” - 5 points, and if he performed both actions, only 5 points would still be added. If a recruiter showed interest in him, 20 points were added to the assessment. If the user removed the job - minus 10 points. And this whole amount was multiplied by two, if the user was a premium and paid XING money.
With item success, everything is a little more interesting. For each vacancy, a list of users was provided, and if at least one user had a successful recommendation, then if item was paid, it turned out to be 50 points, and if the free recommendation was 25. Well, if there were no successful candidates for the vacancy, one person did not click and did not receive an amount greater than zero, then 0 was added to the estimate, we did not receive anything.
The question may immediately arise: what is the maximum estimate that could be obtained for one user-vacancy pair, based on this functional? 102. Clicked on the job - plus 1, added to bookmarks - plus 5, the recruiter showed interest - plus 20, the user of the premium - multiply by two. We get 52, and this user is a successful recommendation for this job. If item is paid, we get another 50 points, totaling 102.
Obviously, the minimum for a recommendation is just 1 point. This is if the user just clicked on the job and there is an item that is already successful for this job.
What are the challenges from the organizers?
The balance between the interests of users and recruiters is based on the functionality of quality. User click means nothing, it is much more profitable if a recruiter showed interest in him.
The second challenge is the balance between relevance and earnings. As shown, the score was highly dependent on whether the user and the item are premium or whether the XING platform receives money from them.
The third is the “cold start” problem. All jobs did not have a history, and this is a more difficult task, since we could only use ad content.
The fourth is the clever sending of pushes. It is necessary to determine which user to send a push to which is not, and at what time. About this later.
First, the organizers, as in many competitions, provided the baseline. It was extremely simple, but showed a good result. There were only six signs in it, five of which were binary: the number of matches for user titles and vacancies, the natural number, and then simple matching of the discipline, career level, industry, country and region. For learning, only interaction was used. If the user removed a vacancy, the target variable was obtained equal to zero, and if the user performed a positive action - one. It was trained on XGBoost and gave the result of 10,000 on the leaderboard. Pretty good.
If we simply recommend the top 100 most active users for all vacancies on the offline stage, we get a result of 519. XGBoost gives a lot more.
What was the sample size? Only 300 million interactions, 75 million target users for whom recommendations had to be built, and about 50 thousand targeted vacancies.
One of the features of dataset that you could immediately see: the interaction contains a huge amount of complete duplicates. If we clean them, we already get 220 million interactions, which allowed us to speed up the algorithm. We study only on interactions. There are fewer interactions - only 6 million. We get a training sample of 6 million.
To speed up the process, the prediction for the pair was made only if there is an intersection of the headers. As a result, the sample for which XGBoost should build a prediction is approximately 50 million. When I tried to reproduce this baseline, I ran into the problem that XGBoost did not work on the server, and I just rewrote on H2O, but this did not have a significant effect on the solution. .
It would seem a logical thing - just add new features to this baseline. Five binary features give a good result, so let's just throw in features and get better results.
After I added 19 more and it turned out 25, I really managed to slightly improve the result. He became about 11 thousand, but further improvements were not obtained. Moreover, at the end there were various experiments: to make a training sample differently, to give different events different weight, just add views with a small weight, which is more than the weight of removal, but less than the positive action. But all this led to the fact that the score fell, until finally the result turned out to be minus 5000. Badly, we mainly recommend what users delete.
Why did this happen? Most likely, there are two problems. First - I could not set up a negative sampling. When I was just throwing scans, the algorithm started to give a lot of predictions about simple scans.
The second problem is that I optimized the standard deviation of XGBoost, and this is probably bad. The functional is ground on money, and we optimize RMSE. But with this it was necessary to do something.
Obviously, the attributes that were added are logical and should improve the score. So I decided to use some simple algorithm to check the quality of the signs. To calculate the estimate for a user-vacancy pair, I simply used the sums of three types, which are also reasonable. The proximity of the user profile to the vacancy profile — we look only at the correspondence of the content between them.
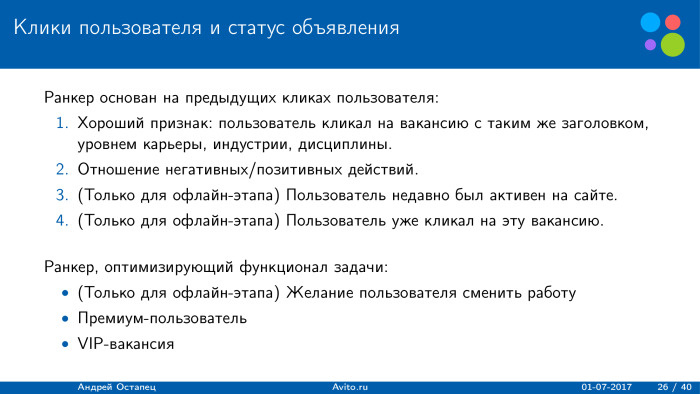
Then we build different interests to the parameters, based on the user's history. We do not use the user profile in any way; we only look at what he clicked and what he deleted.
The third part, which was relevant for the offline stage: for some items and users, previous interactions were specified. They were few, but still they allowed a little to raise the score.
It is logical that if there are 50 thousand users and 50 thousand vacancies, then it is impossible to overthrow them all. It is necessary to select a set of suitable. To reduce the amount of predictions, the following heuristics were used: for a couple, we calculate the estimate only if there is some intersection by the vacancy headings and the user profile, or if the user viewed an ad that intersects with the vacancy. For example, the user indicated that he is an analyst, and he once made just one click on the data scientist. Potential recommendations are vacancies, where there are words “analyst”, “data scientist” and that's it. Obviously, this is not the best heuristics, but it can significantly reduce the size of the sample for which it is necessary to build predictions.
How were the various intimacies considered? As an example, consider the proximity of keywords to a job title. The basic idea is that we can use an analogue of IDF in three dictionaries, that is, we have words from the user profile and from the title of the item, as well as tags of the item. For them, calculated analogue IDF. We simply take the logarithm of the number of unique tokens on the occurrence of tokens, and the less often the token is found, the more weight it receives. When we consider proximity by profile, we simply ration it by the number of unique user keywords. The less keywords he has, the more weight this amount will receive.
For each type of proximity, we select our own weight W. As a result, the final assessment for the user-vacancy pair is calculated as the sum of all user keyword transfers from the vacancy header with just the given weights. Such amounts were calculated for all possible options specified in the user profile and in the vacancy. We already get a lot of signs.
Another text counting option is the full embedding of keywords, the keywords from the job title. This also seems logical if the user, for example, has the “analyst” indicated, and the vacancy - “analyst to the bank”. Perhaps this is also a signal. But here the peculiarity is that it is not known how the organizers obtained these keywords, whether they deleted the stop words or not. Therefore, a fairly standard approach was used, and it worked quite well.
How were proximity considered on other grounds? On the career level, everything was quite simple: it was from 1 to 6, so by profile we can simply consider the difference. If the difference is small, we increase the weight; if it is large, we decrease. It is funny that users, for whom it was indicated that they were students, also sometimes looked for vacancies where directors of companies were required. , , - . , . — . .
, . . : , 1, .
, , . , , . , . , . , , , , . , 95% , . .
. . , score, — : , , . . , , - , — .
, : , . , . - , , . , - VIP. .
? . -, , , , . . , .
, P , . — , .
. « », , . : -. - , . , user success, - . , . 70% . , . , , . — - .
-, , , , . .
. 20 ., 32 . score , .
. , , 30 19 ., .
, , — , , , , . . , , — IDF. , . , , .
-20 . , , 18 , -.
- : XING , . XING , , 24 . 24 . , . 24 , .
. 7 , , - , 8 — . .
, . 11 . , , , , , . , , score .
, score . .
. , : , , 10 , .
, , , score . 4800, 3800, . , , , , 50 . , 10 . . , 50 . — . , , — .
Avito, : . , . LCE, Avito Data Science meetup — .
, 8%, . , .
, score .
: score . 5 . , 2 . , , , , , . . , - , , score . , 21 , . , , , score , .
, , , . , , , , score. score — .
score , 300 . , , .
8700 . — 11 . . , . — 9700, 8700, . 1700 . , , , , , , . , score. ? , .
: , , - , , , 18 . , 18 .
, , , .
?
— . , 1 , 50. , , - , , , . — score -. .
— . , , — , . -, - , . , score . . , -, score.
— -. . /-: 50 . , , , — , , , 25 . . . score , , . , , .
, , — , , , score 7 . , 7 . : .
— . , — — - . score , . , , , .
Source: https://habr.com/ru/post/335526/
All Articles