Load Average in Linux: Solving the Mystery

Load averages are industry-critical metrics. Many companies spend millions of dollars automatically scaling cloud instances based on this and several other metrics. But on Linux, it is shrouded in mystery. Tracking the average load on Linux is a task that works in an uninterrupted sleep state (uninterruptible sleep state). Why? I have never met an explanation. In this article I want to solve this mystery, and create a reference for the average load values for all who try to interpret them.
Linux load averages are “system load averages” that indicate the need for executable threads (tasks) in the form of an average number of executable and pending threads. This is a measure of the load that may exceed the system currently being processed. Most tools show three average values: for 1, 5 and 15 minutes:
$ uptime 16:48:24 up 4:11, 1 user, load average: 25.25, 23.40, 23.46 top - 16:48:42 up 4:12, 1 user, load average: 25.25, 23.14, 23.37 $ cat /proc/loadavg 25.72 23.19 23.35 42/3411 43603 Some interpretations are:
- If the values are 0.0, then the system is idle.
- If the average value for 1 minute is higher than for 5 or 15, then the load increases.
- If the average value for 1 minute is lower than for 5 or 15, then the load decreases.
- If the load values are higher than the number of processors, then you may have performance problems (depending on the situation).
For this set of three values, you can estimate the load dynamics, which is certainly useful. Also, these metrics are useful when you need a single assessment of resource requirements, for example, to automatically scale cloud services. But in order to deal with them in more detail, it is necessary to turn to other metrics. In itself, a value in the range 23-25 does not mean anything, but it makes sense if the number of processors is known, and if we are talking about the load related to the processor.
Instead of debugging average load values, I usually switch to other metrics. We will talk about this closer to the end of the article, in the chapter “More suitable metrics”.
Story
Initially, the average load values show only the need for processor resources: the number of running and pending processes. RFC 546 has a good description called "TENEX Load Averages", August 1973:
[1] TENEX average load is a measure of CPU resource requirements. This is the average number of executable processes over a period of time. For example, if the hourly average load is 10, then this means (for a uniprocessor system) that at any time during this hour 1 process is running and 9 are ready for execution (that is, not blocked for I / O) and waiting for the processor is free.
A version on ietf.org leads to a PDF scan of a hand-drawn graphic in July 1973, demonstrating that this metric has been used for decades:
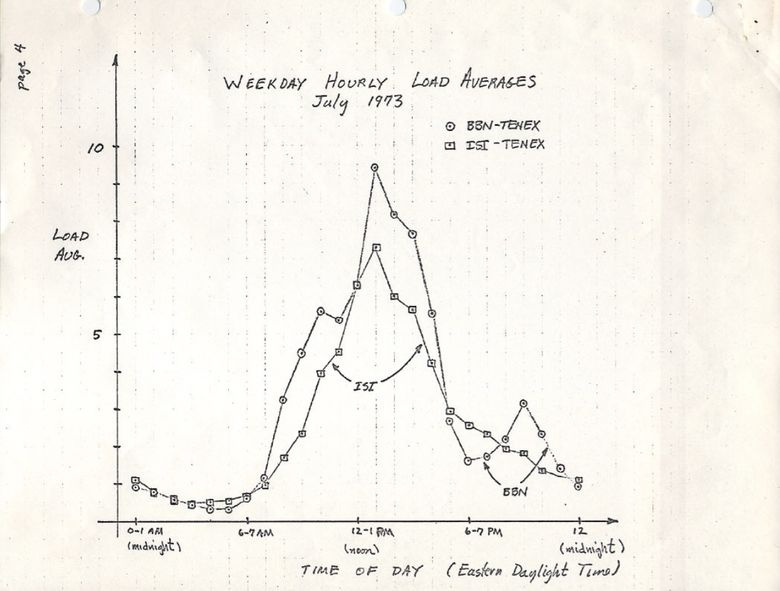
source: https://tools.ietf.org/html/rfc546
Today you can find the source code of old operating systems on the web. Here is a snippet from TENEX (early 1970's) SCHED.MAC, on the DEC macro assembler:
NRJAVS==3 ;NUMBER OF LOAD AVERAGES WE MAINTAIN GS RJAV,NRJAVS ;EXPONENTIAL AVERAGES OF NUMBER OF ACTIVE PROCESSES [...] ;UPDATE RUNNABLE JOB AVERAGES DORJAV: MOVEI 2,^D5000 MOVEM 2,RJATIM ;SET TIME OF NEXT UPDATE MOVE 4,RJTSUM ;CURRENT INTEGRAL OF NBPROC+NGPROC SUBM 4,RJAVS1 ;DIFFERENCE FROM LAST UPDATE EXCH 4,RJAVS1 FSC 4,233 ;FLOAT IT FDVR 4,[5000.0] ;AVERAGE OVER LAST 5000 MS [...] ;TABLE OF EXP(-T/C) FOR T = 5 SEC. EXPFF: EXP 0.920043902 ;C = 1 MIN EXP 0.983471344 ;C = 5 MIN EXP 0.994459811 ;C = 15 MIN And here is a fragment from modern Linux (include / linux / sched / loadavg.h):
#define EXP_1 1884 /* 1/exp(5sec/1min) as fixed-point */ #define EXP_5 2014 /* 1/exp(5sec/5min) */ #define EXP_15 2037 /* 1/exp(5sec/15min) */ The constants for 1, 5 and 15 minutes are also hard-coded in Linux.
Similar metrics were also found in older systems, including Multics , which contained an exponential average value of a queue of planned tasks (exponential scheduling queue average).
Three numbers
Three numbers are average load values for 1, 5 and 15 minutes. But they are not really average, and not for 1, 5 and 15 minutes. As can be seen from the above code, 1, 5, and 15 are the constants used in the equation, which calculates the exponentially decaying sliding sums of a five-second average (exponentially-damped moving average). So average loads for 1, 5 and 15 minutes do not reflect the load at all for the specified time intervals.
If you take an idle system and then feed it with a single-threaded load tied to the processor (one thread per cycle), what will be the one-minute average load value after 60 seconds? If it were just an average, we would get 1.0. Here is the experiment schedule:
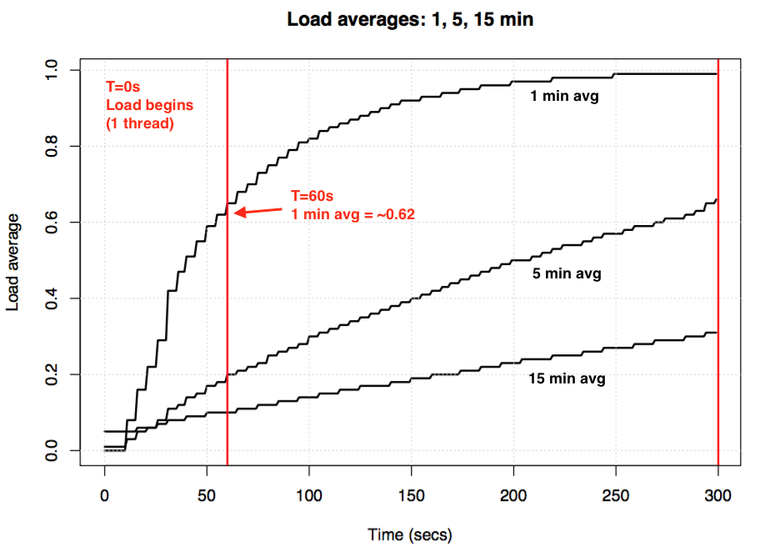
Visualization of the experiment on the exponential attenuation of the average load value.
The so-called "one-minute average" reaches about 0.62 at one minute. Dr. Neil Günther described this and other experiments in more detail in the How It Works article, there are also quite a few Linux-related comments on loadavg.c .
Linux Uninterrupted Tasks
When average load values first appeared in Linux, they reflected only the need for processor resources, as in other OSs. But later they underwent changes, they included not only the tasks performed, but also those that are in an uninterrupted state (TASK_UNINTERRUPTIBLE or nr_uninterruptible). This state is used by code branches that want to avoid signal interruptions, including tasks blocked by disk I / O, and some locks. You may have already encountered this state: it is displayed as the "D" state in the output of ps and top . On the ps (1) page, it is called “uninterruptible sleep (usually IO)”.
The introduction of an uninterrupted state means that in Linux, the average load values may increase due to disk (or NFS) I / O load, and not just processor resources. Anyone who is familiar with other operating systems and their average processor loads is initially confused by the inclusion of this state.
What for? Why was this done in Linux?
There are a myriad of articles on average loads, many of which mention nr_uninterruptible in Linux. But I did not see a single explanation, or at least a serious assumption, why they began to take this state into account. Personally, I would suggest that it should reflect more general resource requirements, and not just for a processor.
In search of an ancient patch for Linux
It's easy to see why something changes in Linux: you look at the history of git commits for the desired file and read the descriptions of the changes. I looked at the history on loadavg.c , but the change that adds the unchanged state is dated earlier than the file containing the code from the earlier file. I checked another file, but it gave nothing: the code “skipped” through different files. Hoping for good luck, I pushed git log -p around the entire Linux Github repository containing 4 GB of text, and started reading from the end, looking for the place where this code first appeared. That didn't help me either. The oldest change in the repository dates back to 2005, when Linus imported Linux 2.6.12-rc2, and the change was made earlier.
There are old Linux repositories ( 1 and 2 ), but there is no description of this change in them either. Trying to find at least the date of its introduction, I studied the archive on kernel.org and found that it was at 0.99.15, and at 0.99.13 it was not there yet. However, version 0.99.14 was missing. I managed to find it and confirm that the desired change appeared in Linux 0.99.14, in November 1993. I hoped that the description of this release would help me, but here I didn’t find an explanation:
“Changes in the last official release (p13) are too numerous to list (or even recall) ...” - Linus
He mentioned only the main changes, not related to the average value of the load.
By date, I managed to find the mailing list kernel archives and a specific patch, but the older letter was dated as early as June 1995:
"While working on a system that allows for more efficient scaling of mail archives, I accidentally destroyed the current archives (ay oh)."
I began to feel damned. Fortunately, I was able to locate the old linux-devel mailing list archives, pulled from the server backup, often stored as digest archives. I scanned over 6,000 digests containing over 98,000 letters, of which 30,000 were from 1993. But found nothing. It seemed that the original description of the patch was lost forever, and we would not get the answer to the question “why”.
The origin of the continuity
But suddenly on the site oldlinux.org in an archived mailbox file for 1993, I found this:
From: Matthias Urlichs <urlichs@smurf.sub.org> Subject: Load average broken ? Date: Fri, 29 Oct 1993 11:37:23 +0200 "" . . , , "", , /, . , , … , . , , . ;-) --- kernel/sched.c.orig Fri Oct 29 10:31:11 1993 +++ kernel/sched.c Fri Oct 29 10:32:51 1993 @@ -414,7 +414,9 @@ unsigned long nr = 0; for(p = &LAST_TASK; p > &FIRST_TASK; --p) - if (*p && (*p)->state == TASK_RUNNING) + if (*p && ((*p)->state == TASK_RUNNING) || + (*p)->state == TASK_UNINTERRUPTIBLE) || + (*p)->state == TASK_SWAPPING)) nr += FIXED_1; return nr; } -- Matthias Urlichs \ XLink-POP N|rnberg | EMail: urlichs@smurf.sub.org Schleiermacherstra_e 12 \ Unix+Linux+Mac | Phone: ...please use email. 90491 N|rnberg (Germany) \ Consulting+Networking+Programming+etc'ing 42 It was just incredible to read about the reflections of 24 years ago, which caused this change. The letter confirmed that the change in the metric should have taken into account the needs of other system resources, and not just the processor. Linux has moved from “average processor load” to something like “average system load”.
The above example with a disk with a slower swap is not without meaning: reducing the system performance, the need for resources (processes that are executed and waiting for the queue) should increase. However, the average load values decreased because they took into account only the CPU running states, but not the swapping states. Mattias rightly considered this illogical, and therefore corrected.
Continuity today
But do the average load values in Linux sometimes not rise too high, which can no longer be explained by disk I / O? Yes, this is true, although I assume that this is a consequence of a new branch of code that uses TASK_UNINTERRUPTIBLE, which did not exist in 1993. In Linux 0.99.14, there were 13 code branches that directly used TASK_UNINTERRUPTIBLE or TASK_SWAPPING (the paging state was later removed from Linux). Today in Linux 4.12 there are almost 400 branches using TASK_UNINTERRUPTIBLE, including some blocking primitives. It is likely that one of these branches should not be taken into account in the average load value. I will check if this is so when I see again that the value is too high, and see if this can be corrected.
I wrote to Mattias and asked him 24 years later about his change in the average load. He answered in an hour:
“The essence of the“ average load ”is to provide a numerical estimate of the employment of the system from the point of view of a person. TASK_UNINTERRUPTIBLE means (means?) That the process is waiting for something like a disk read, which affects the system load. A system that strongly depends on a disk can be very inhibited, but the average TASK_RUNNING value will be around 0.1, which is completely useless. ”
So Matthias is still confident in the correctness of this step, at least as to what TASK_UNINTERRUPTIBLE was intended for.
But today TASK_UNINTERRUPTIBLE corresponds to more things. Do we need to change the average load values so that they reflect only the CPU and disk resource requirements? Peter Zijstra has already sent me a good idea: consider task_struct->in_iowait instead of TASK_UNINTERRUPTIBLE in the average load, because it more closely corresponds to disk I / O. However, this raises another question: what do we really want? Do we want to measure system resource requirements as threads of execution, or do we need physical resources? If the first, then you need to take into account uninterrupted blocking, because these threads consume system resources. They are not idle. So the average load in Linux is probably already working as it should.
To better understand the uninterrupted code branches, I would like to measure them in action. Then you can evaluate different examples, measure the time spent and understand whether this makes sense.
Measurement of uninterrupted tasks
Here is an off-processor (off-CPU) flame graph from a production-server covering 60 seconds and showing only kernel stacks, on which I left only the TASK_UNINTERRUPTIBLE ( SVG ) state.
The graph reflects many examples of uninterrupted code branches:
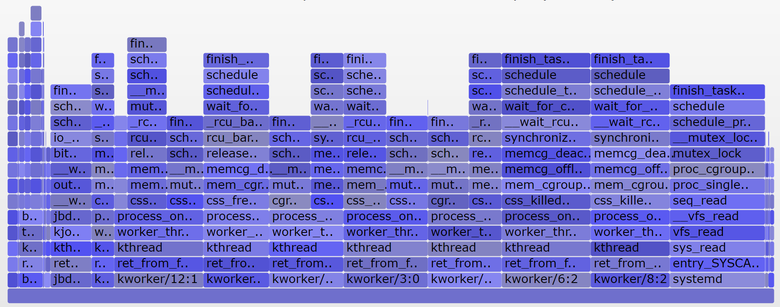
If you are not familiar with flame graphs: you can click on the blocks, examine the whole stacks, which are displayed as columns of blocks. The size of the X axis is proportional to the time spent blocking out of the processor, and the sort order (from left to right) does not matter. For non-processor stacks, the color blue is selected (for the internal processor stacks I use warm colors), and variations in saturation indicate different frames.
I generated the graph using my bcc offcputime tool (for working, it needs the eBPF capabilities of Linux 4.8+), as well as applications for creating flame graphs :
# ./bcc/tools/offcputime.py -K --state 2 -f 60 > out.stacks # awk '{ print $1, $2 / 1000 }' out.stacks | ./FlameGraph/flamegraph.pl --color=io --countname=ms > out.offcpu.svgb> I use awk to change the output from microsecond to millisecond. Offcputime "--state 2" corresponds to TASK_UNINTERRUPTIBLE (see sched.h), this is an option I added for the sake of this article. For the first time, Joseph Bachik did this with his kernelscope tool, which also uses bcc and flame graphics. In my examples, I only show kernel stacks, but offcputime.py also supports custom stacks.
As for the above graph: it displays only 926 ms out of 60 seconds spent in a state of uninterrupted sleep. This adds a total of 0.015 to our average load values. This is the time spent by some cgroup branches, but this server does not perform many disk I / O operations.
But a more interesting graph covering only 10 seconds ( SVG ):
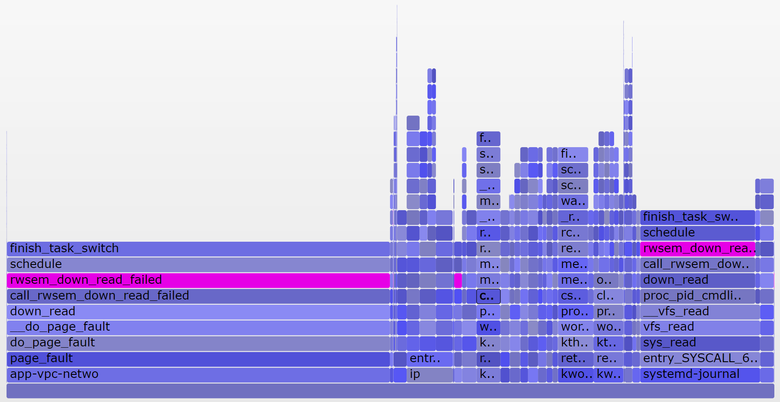
The wider tower on the right refers to the systemd-journal proc_pid_cmdline_read() being blocked systemd-journal proc_pid_cmdline_read() (reading / proc / PID / cmdline), which adds 0.07 to the average load. On the left, a wider page fault tower, also ending in rwsem_down_read_failed() (adds 0.23 to the average load). I painted these functions in purple using the search feature in my tool. Here is the code snippet from rwsem_down_read_failed() :
/* wait to be given the lock */ while (true) { set_task_state(tsk, TASK_UNINTERRUPTIBLE); if (!waiter.task) break; schedule(); } This is a lock acquisition code using TASK_UNINTERRUPTIBLE. Linux has interrupted and uninterrupted versions of mutex acquire functions (for example, mutex_lock() and mutex_lock_interruptible() , down() and down_interruptible() for semaphores). Interruptible versions allow you to interrupt tasks by a signal, and then wake up to continue processing before a lock is acquired. The time spent sleeping in uninterrupted blocking usually adds little to the average load, and in this case the gain reaches 0.3. If there were much more, it would be worthwhile to find out whether it is possible to reduce blocking conflicts (for example, I start digging into systemd-journal and proc_pid_cmdline_read() !) In order to improve performance and reduce the average load value.
Does it make sense to consider these branches of the code in the average load? I would say yes. These threads are stopped in the middle of execution and blocked. They are not idle. They need resources, even if they are software, not hardware.
Analyzing average load values in Linux
Is it possible to fully decompose into components the average load? Here is an example: on an idle 8-processor system, I launched tar to archive several uncached files. The application took a few minutes, for the most part it was blocked by disk read operations. Here are the statistics from three different terminal windows:
terma$ pidstat -p `pgrep -x tar` 60 Linux 4.9.0-rc5-virtual (bgregg-xenial-bpf-i-0b7296777a2585be1) 08/01/2017 _x86_64_ (8 CPU) 10:15:51 PM UID PID %usr %system %guest %CPU CPU Command 10:16:51 PM 0 18468 2.85 29.77 0.00 32.62 3 tar termb$ iostat -x 60 [...] avg-cpu: %user %nice %system %iowait %steal %idle 0.54 0.00 4.03 8.24 0.09 87.10 Device: rrqm/s wrqm/sr/sw/s rkB/s wkB/s avgrq-sz avgqu-sz await r_await w_await svctm %util xvdap1 0.00 0.05 30.83 0.18 638.33 0.93 41.22 0.06 1.84 1.83 3.64 0.39 1.21 xvdb 958.18 1333.83 2045.30 499.38 60965.27 63721.67 98.00 3.97 1.56 0.31 6.67 0.24 60.47 xvdc 957.63 1333.78 2054.55 499.38 61018.87 63722.13 97.69 4.21 1.65 0.33 7.08 0.24 61.65 md0 0.00 0.00 4383.73 1991.63 121984.13 127443.80 78.25 0.00 0.00 0.00 0.00 0.00 0.00 termc$ uptime 22:15:50 up 154 days, 23:20, 5 users, load average: 1.25, 1.19, 1.05 [...] termc$ uptime 22:17:14 up 154 days, 23:21, 5 users, load average: 1.19, 1.17, 1.06 I also built a non-CPU flame graph exclusively for uninterrupted state ( SVG ):
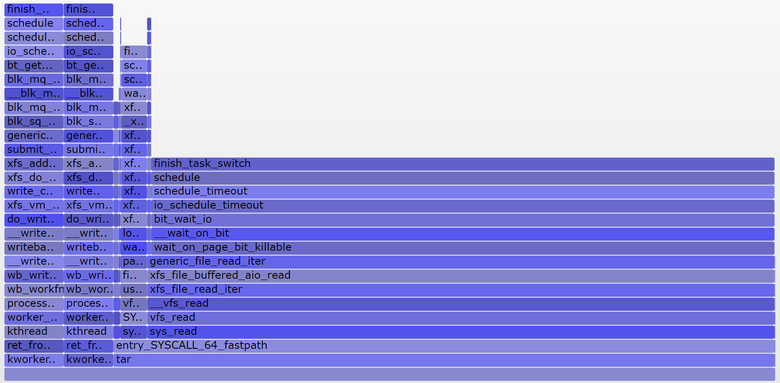
Average last minute load was 1.19. Let's decompose into components:
- 0.33 - processor time tar (pidstat)
- 0.67 - uninterrupted reads from the disk, presumably (on the graph 0.69, I believe that for him the data collection began a little later and covers a slightly different time range)
- 0.04 - other processor consumers (user mpstat + system, minus processor consumption by tar from pidstat)
- 0.11 - uninterrupted disk input / output of the core workers, dumps to disk (on the chart there are two towers on the left)
The total is 1.15. Not enough yet 0.04. In part, this may include rounding and measurement errors of the interval shifts, but mainly this may be due to the fact that the average load is an exponentially decaying sliding sum, while the other metrics used (pidstat, iostat) are normal averages. Up to 1.19, the one-minute average load was 1.25, which means that one of the above still pulls the metric up. How much? According to my earlier schedules, at one minute mark, 62% of the metric accounted for the current minute, and the rest - for the previous one. So 0.62 x 1.15 + 0.38 x 1.25 = 1.18. Close enough to get 1.19.
In this system, one thread (tar) performs the work, plus a little more time is spent on threads of the kernel workers, so the Linux average load report at 1.19 looks reasonable. If I measured the “average processor load,” I would be shown only 0.37 (calculated value from mpstat), which is correct only for processor resources, but does not take into account the fact that more than one thread needs to be processed.
I hope this example showed you that these numbers are not taken from the ceiling (processor + uninterrupted), and you can decompose them yourself into components.
The meaning of load average Linux
I grew up on operating systems in which the average load values applied only to the processor, so the Linux version always strained me. Perhaps the real problem is that the term “average load” is as ambiguous as “input-output”. What kind of input / output? Drive? File system? Networks? .. Similarly, average loads of what? CPU? Systems? :
- Linux — ( ) « » , . (, , ). , , . : .
- — « » . , . : ( ).
: « » , ( ).
, - Linux , , : , , . .
«» «» ?

: , , . .
- , 1,0, . , ( ) . 1,5 , , .
, 11 16 ( 5,5 8). , . : / 2.
Linux: , , . : , 20, 40, , , .
Linux (, , ), , . , . , :
- (per-CPU utilization): ,
mpstat -P ALL 1. - (per-process CPU utilization): ,
top, pidstat 1. - () (per-thread run queue (scheduler) latency): , /proc/PID/schedstats, delaystats, perf sched
- (CPU run queue latency): ,
/proc/schedstat,perf sched, runqlat bcc . - (CPU run queue length): , vmstat 1 'r',
runqlen bcc.
— , — (saturation metrics). , — . — ( ): , / , . . , . , .
Linux 4.6 schedstats ( sysctl kernel.sched_schedstats ) , . (delay accounting) cpustat , htop , . , , , ( ) /proc/sched_debug:
$ awk 'NF > 7 { if ($1 == "task") { if (h == 0) { print; h=1 } } else { print } }' /proc/sched_debug task PID tree-key switches prio wait-time sum-exec sum-sleep systemd 1 5028.684564 306666 120 43.133899 48840.448980 2106893.162610 0 0 /init.scope ksoftirqd/0 3 99071232057.573051 1109494 120 5.682347 21846.967164 2096704.183312 0 0 / kworker/0:0H 5 99062732253.878471 9 100 0.014976 0.037737 0.000000 0 0 / migration/0 9 0.000000 1995690 0 0.000000 25020.580993 0.000000 0 0 / lru-add-drain 10 28.548203 2 100 0.000000 0.002620 0.000000 0 0 / watchdog/0 11 0.000000 3368570 0 0.000000 23989.957382 0.000000 0 0 / cpuhp/0 12 1216.569504 6 120 0.000000 0.010958 0.000000 0 0 / xenbus 58 72026342.961752 343 120 0.000000 1.471102 0.000000 0 0 / khungtaskd 59 99071124375.968195 111514 120 0.048912 5708.875023 2054143.190593 0 0 / [...] dockerd 16014 247832.821522 2020884 120 95.016057 131987.990617 2298828.078531 0 0 /system.slice/docker.service dockerd 16015 106611.777737 2961407 120 0.000000 160704.014444 0.000000 0 0 /system.slice/docker.service dockerd 16024 101.600644 16 120 0.000000 0.915798 0.000000 0 0 /system.slice/ [...] , , . . , . ( ), ( ), . , .
, , — . , , , , . , .
Conclusion
1993 Linux- , « » « ». , , . ( , ). , 1, 5 15 . , .
Linux , . ( , ), , .
, Linux 1993- — , — . bcc/eBPF Linux- , -. , , . , .
kernel/sched/loadavg.c Linux:
, . , . , tickless-.
Links
- Saltzer, J., and J. Gintell. “ The Instrumentation of Multics ,” CACM, August 1970 ( ).
- system_performance_graph Multics ( ).
- TENEX ( SCHED.MAC).
- RFC 546 "TENEX Load Averages for July 1973" ( ).
- Bobrow, D., et al. “TENEX: A Paged Time Sharing System for the PDP-10,” Communications of the ACM, March 1972 ( ).
- Gunther, N. "UNIX Load Average Part 1: How It Works" PDF ( ).
- Linux 0.99 patchlevel 14 .
- oldlinux.org ( alan-old-funet-lists/kernel.1993.gz, linux-, ).
- Linux kernel/sched.c : 0.99.13 , 0.99.14 .
- Linux 0.99 kernel.org .
- Linux: loadavg.c , loadavg.h
- bcc , offcputime , TASK_UNINTERRUPTIBLE.
- - , .
')
Source: https://habr.com/ru/post/335326/
All Articles