Materialize the search results, or how we released 25 processor cores
Not so long ago, we solved the problem of optimizing the resource consumption of our elasticsearch cluster. Having failed to customize the elastic itself, we did something like a search results cache, using the approach called "reverse" search or percolator. Under the cut there is a story about how we work with metadata of metrics and the percolator itself.
The purpose of the monitoring service that we develop is to show the causes of the problems, for this we remove a lot of detailed metrics about different subsystems of the client's infrastructure.
On the one hand, we solve the problem of recording a large number of metrics from thousands of hosts, on the other hand, metrics do not lie dead in our repository, but are constantly read:
- Clients look at graphs that, when drawn, can read several thousand metrics.
- we have a lot of pre-configured triggers for detecting typical problems, and each of them can constantly be read by a lot of metrics
What is a metric
When we started the development of okmeter (at that time there were no public versions of the influxdb, prometheus), it was immediately clear to us that the metrics should not be "flat". In our case, the metric identifier is a key-value dictionary (we historically call it label_set):
{ "name": "nginx.requests.rate", "status": "403", "source_hostname": "front3", "file": "/var/log/access.log", "cache_status": "MISS", "url": "/order" } For each such metric, we have values that are tied to specific points in time (time series).
How we store metrics
Based on the hash from label_set, for each metric a string key is calculated by which we identify the metrics in the repository. And here we share the task of storing metric values by key from the task of storing and processing meta information about metrics:
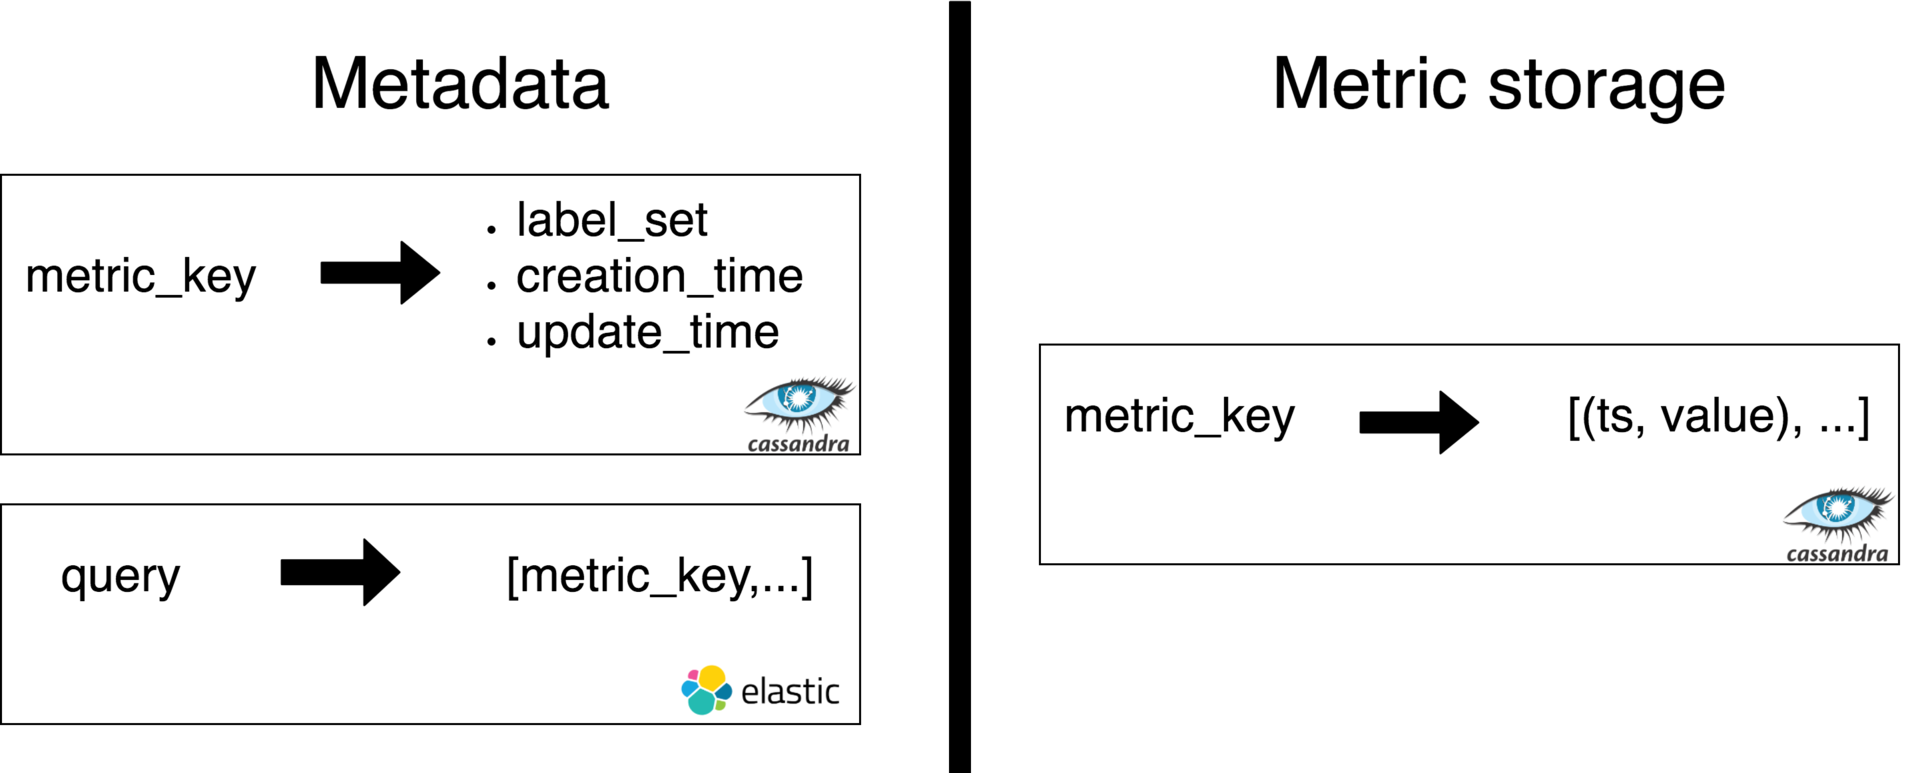
We will not discuss the storage of metric values in this article, but we will talk about metadata in more detail.
The meta information of a metric is the key itself, a label_set, creation time, update time, and several other service fields.
We store this information in cassandra and can receive it through the key metrics. In addition to the main metadata repository, we have an index in elasticsearch, which by some search query of the user returns a set of keys of metrics.
Record metrics
When a packet of metrics comes from an agent installed on the client’s server, the following for each metric occurs on the server:
We calculate metric_key, check if this metric is in the meta information storage (C *)
Register a new one if needed (recorded in C * and ES)
We raise the updated_ts and calculate whether it is time to update it (updated every 12 hours, in order to reduce the load on indexing in ES)
If it's time, update the updated_ts in C * and ES
- We write value in metric_storage
Reading metrics
We have 2 main sources of requests for reading metrics: user requests for drawing graphs and a trigger check system. Such requests are some kind of expression on our dsl:
top(5, sum_by(url, metric(name=“nginx.requests.rate”, status=“5*”))) This expression contains:
The "selector" of metrics (arguments of the metric () function), which is a search query for selecting all metrics interesting to the user. In this case, we select all metrics with the name "nginx.requests.rate" and the status label, which has a prefix of "5" (we want to count all http-5xx errors)
- Metric conversion functions. In this case, we will group all the selected metrics (by sum) by url label (for example, values from different servers or files are added), and then we take only 5 of the largest total values, and fold the tail into a value labeled "~ other"
At the same time, our request always works in a certain time interval: [since_ts = X, to_ts = Y]
The metric selector is converted to approximately the same query to elasticsearch (a valid json query is much more verbose):
{"name": “nginx.requests.rate”, "status_prefix": "5", "created_lt": "Y", "updated_gt": "X+12h"}Received N (often thousands) of keys
We go to C * to receive label_sets on keys
We go to metric_storage to receive data on keys
- We calculate the expression top (5, sum_by (...))
Load and data size
At the moment, our cloud is processing just over 100 thousand metrics per second per record. The average number of requests per request is about 350 rps (90% of them are from triggers). Each search query is 1-3 ES indexes, each index ~ 100 million documents (~ 30GB).
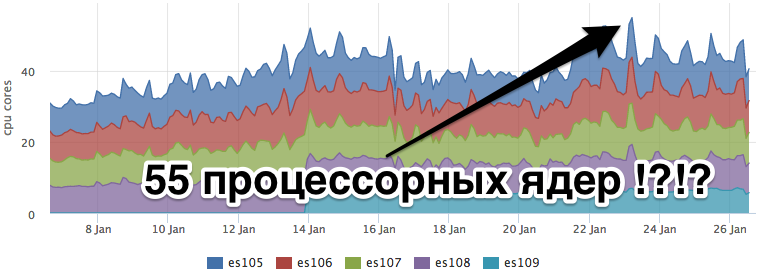
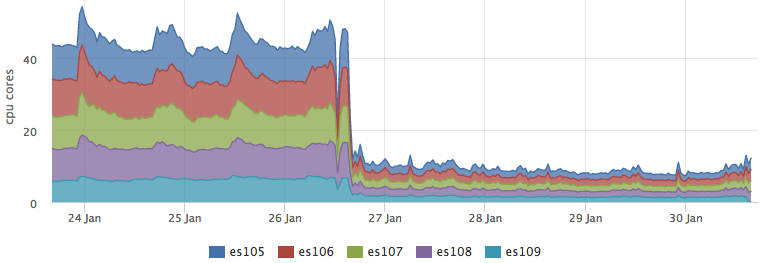
At the same time, CPU consumption by an elastic will not leave anyone indifferent who counts the money spent on hosting :)
Elasticsearch
We tried to turn the elasticsearch settings, expecting that the built-in query cache was created just for our case of repeated queries. There was an attempt to model an index to which for some queries no updates come in to exclude cache invalidation for these queries.
But unfortunately, all our exercises did not give a decrease in the resources consumed, nor a decrease in the elastic response time.
External cache
We decided to make the search results cache external to ES and formulated the following requirements for it:
The search is always on a time interval.
Metrics that stopped coming should go out of cache
- New metrics should be included in search results within 1 minute.
With such requirements, you can just cache the ES response for only 1 minute, while it is clear that there will be no hit rate. As a result, we came to the conclusion that we will not only do a cache, but something like a materialized view with the search results for each search query we know.
Percolator
The idea was that with each metric entry we would check what known search query it matches. In case of a match, the metric is written to our cache.
Such an approach is called a "prospective search" , it is also a "reverse search", it is also a "percolator".
As I understand it, the term "percolation" is used here because of the similarity of the process, we somehow check the "flow" of a document through many search queries.
In the usual search task, we have documents, we build an index of them, in which (very simplistic) each "word" corresponds to a list of documents in which this word occurs.
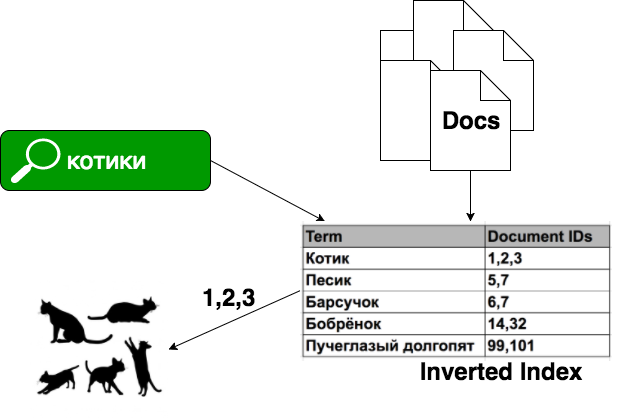
In the case of percolation, we have previously known search queries, and each document is a search query:

Percolator implementations:
- In elasticsearch there is percolate query
- In solr there is an open ticket , maybe they will finish it sometime
- Luwak - library for java based on Lucene
- Google App Engine Prospective Search API is a service for GAE, but it is already deprecated
We considered only elasticsearch, there the percolator is a special type of index in which we describe the structure of our future documents: what will be the fields of the document and their types (mapping). Further in this index we save our requests, and then we search by submitting documents for input.
Inside the ES, with each percolation request, a temporary index is created in memory, consisting of only one document that we submitted for input. Of all the saved queries, those that are obviously not suitable for the document on a set of fields are discarded. After that, for each remaining candidate request, a search is performed on our temporary index.
On our simple benchmark, we received 2-10ms on checking 1 document for compliance with 1 request in the percolator. With our flow of documents, it will be very expensive. In addition, we have not learned to "cook" elasticsearch :)
Naive homemade percolator
Let's return to our metrics. As I said above, our document is a key-value dictionary. Our search query is a search by exact or prefix match fields. That is, as such, full-text search is not required.
We decided to try to make a "naive" implementation of the percolator, that is, to check on the forehead that each metric matches all known queries. We have a write stream of ~ 100 thousand metrics per second, each metric needs to be checked for compliance with ~ 100 queries.
One test benchmark (this piece of our code works on golang, it was the prototype that was written on it) showed ~ 300ns. Since this is a completely cpu bound task, we have the right to sum up the time, we get:
100k * 100 = 10M10M * 300ns = 3 = 3
The logic of our cache turned out something like this:

Additional steps were added to the process of recording metrics:
- Raise all saved queries for this client from *
- We check every metric that arrives for a match for each request.
- In case of coincidence, we write the meta information about the metric in the cache, the same metric can be written into the cache many times (duplicates will be removed by cassandra)
It is worth noting that after we register a new request, the cache for it was not validated immediately. We have to wait until the end of the write requests that have already begun and have not seen the new request in the list of known ones. Therefore, we move the cache initialization time by the timeout value of the request to write metrics.
How does the cache
We keep the cache in Cassandra, the results for each query are beaten to pieces in time (each piece is 24 hours). This is done in order to ensure the leaching of the results of the metrics that have stopped coming.

Upon request, we read all daily pieces that fall into the time interval of interest to us and combine the results into memory.
The value is the dictionary key metrics and the json label_set view. Thus, if we use the results from the cache, we don’t need to additionally go to the cassandra for the metadata on the key as we did after receiving the results from ES.
Rolled out in production
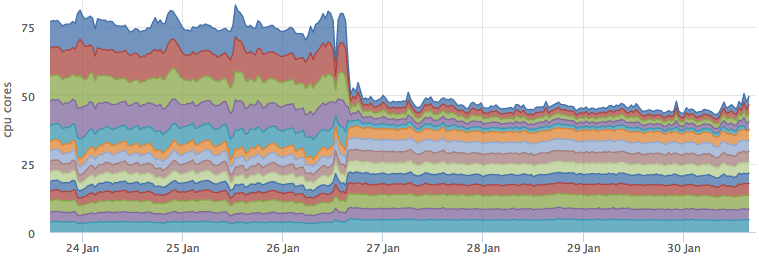
After we rolled the cache into the battle and it became valid for most requests, the load on the ES dropped dramatically:
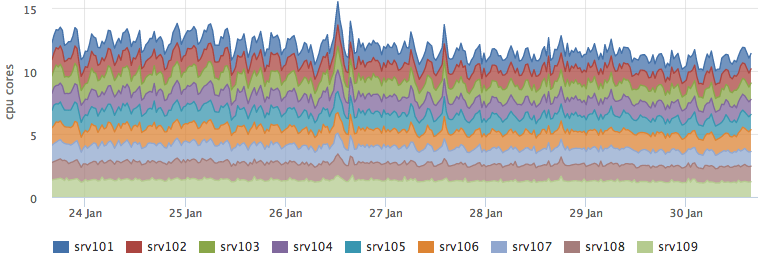
At the same time, resource consumption of cassandra has not changed:
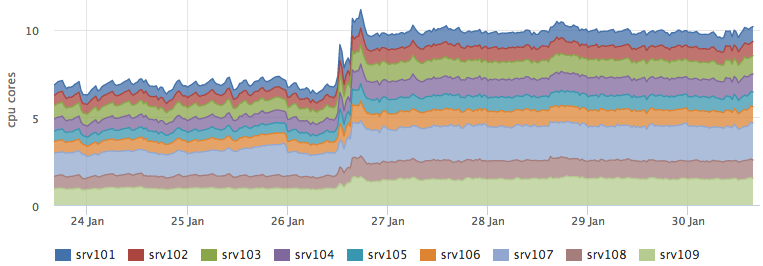
And the backend that performs the percolation grew just by the predicted ~ 3 cores:
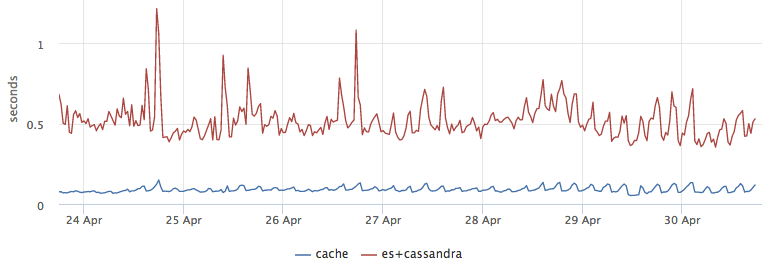
As a bonus, we got a good latency optimization, taking the results from the cache turned out to be about 5 times faster than going to ES and then getting the meta information from C *:
Consistency check
To make sure that we didn’t get anywhere with the logic of the cache, the first few days the search went simultaneously on both the ES and the cache, and we compared the results and wrote the corresponding metric. After switching the load to the cache, we did not begin to cut the validation logic of the cache and make speculative requests in ES for 1% of requests. The same requests are also a “hot-water bottle” for ES, otherwise without a load, the indices may not get into page cache and user requests will be blunt.
Total
We tried not to make an external cache, but to force ES to use an internal one. But I had to do cycling. But there is a plus: we will hang additional logic on the percolator.
According to the results, we shrank well along the glands, while our homemade percolator scales quite well. This is quite important for us, as we are rapidly growing both in the number of clients and in the number of metrics from each client server.
')
Source: https://habr.com/ru/post/335266/
All Articles