Visual Plugin Pack in OBIEE: what it is eaten with and how it is prepared

Hi, Habr! In this post we will talk about an interesting development for Oracle Business Intelligence called Visual Plugin Pack.
One of the products in the Oracle BI suite, Interactive Dashboard, is based on a web interface and supports a set of visualization tools: scales, charts, summary reports, and analysis scripts based on conditions. It also implements a drilldown mechanism, which can be configured both as a hierarchy in OBIEE, and as a link to another action. Thus, unlimited specification of reported indicators is provided.
Standard Visualization Tools in OBIEE
The most popular among standard visualization tools, in my opinion, are several views.
')
- Table and slice table, bar and pie chart .


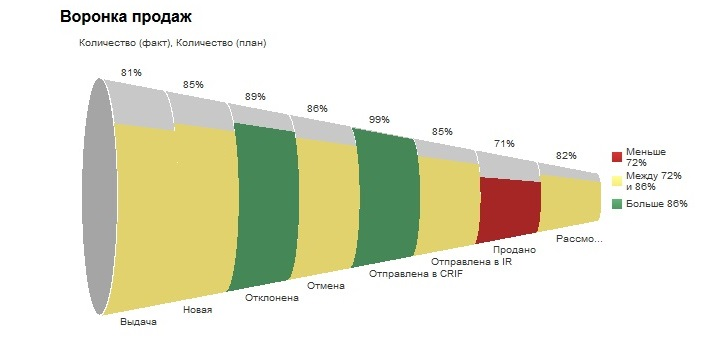
- Sales funnel . A very convenient analytical tool that allows you to get information about how a potential customer goes from the first interest in buying a product or service to the time of purchase.
- Mosaic performance . This element is needed to display the most significant indicators on the information panel. Performance mosaic views contain one piece of data aggregation. The illustration below shows an information panel with several performance tile elements.

- Tree cards . Organize data by grouping them into rectangles (known as tiles). Tree maps display tiles based on the size of one indicator and the color of another indicator.

What does the Visual Plugin Pack give?
The Visual Plugin Pack (VPP) extends the OBIEE visual capabilities by adding 18 new views. The most interesting of them - below.
- Calendar - displays the calendar for the year in which the values of max \ min are highlighted. For example: the number of sales per day per year. The best / worst days.

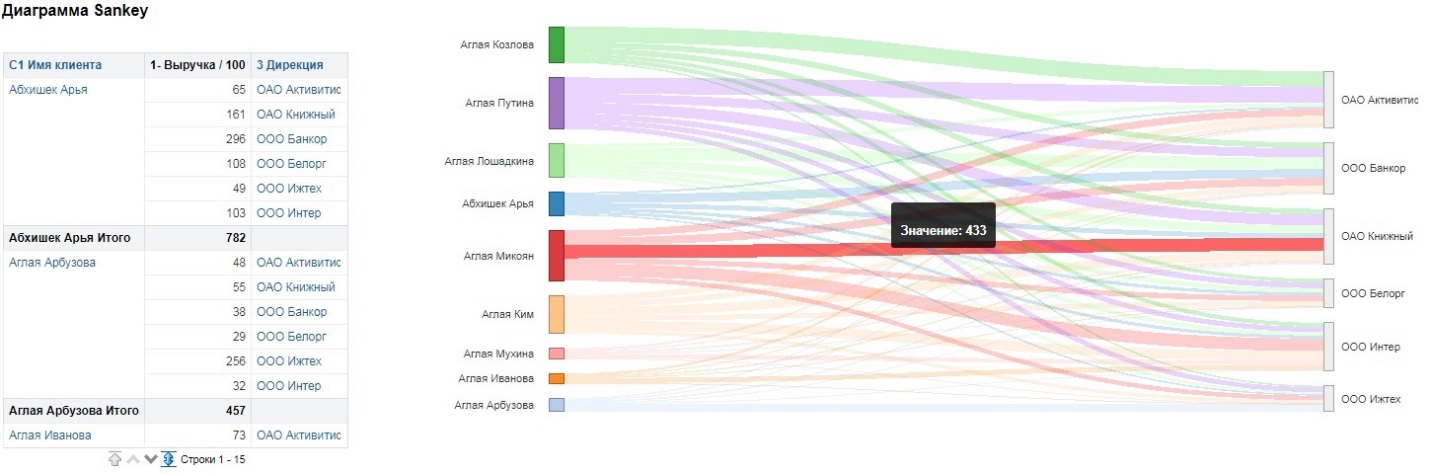
- Sankey diagram - view allows you to track various threads. For example, we have large legal entity clients who work with different managers. Managers, in turn, also work with different clients. You can see which sales (stream width) are most effective. A similar view exists in the Visual Analyzer.
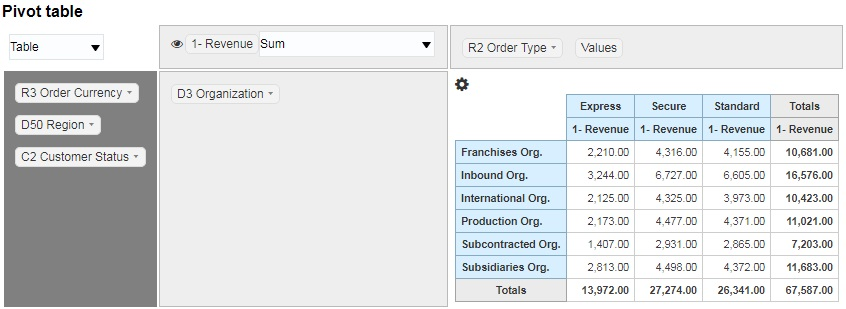
- Pivot table - pivot table. A similar representation is in OBIEE. The main difference is that the user has a new user-friendly interface for working with the slice table. You can exclude unnecessary columns, then return them back, change the ways of aggregation of indicators, change the presentation. And all this without using the report builder.
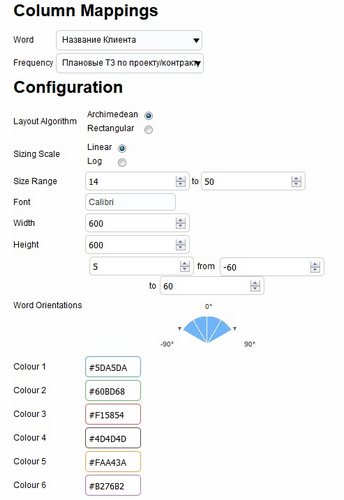
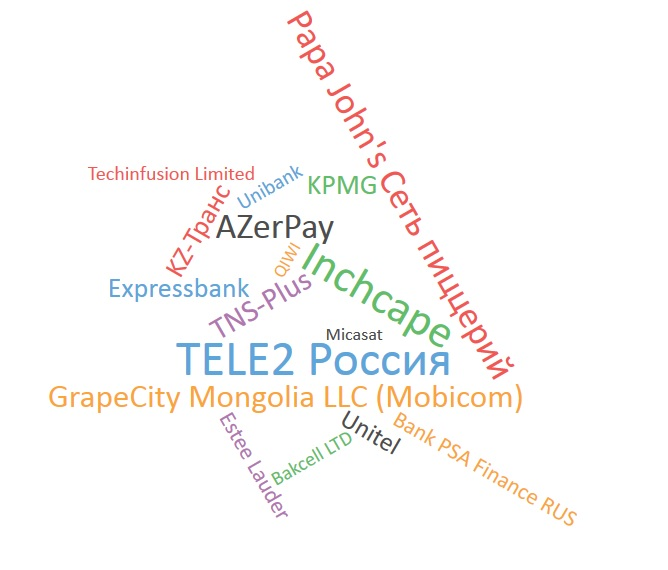
- Word Cloud . The word cloud is composed of the attributes most commonly used in the analysis. Orientation levels, colors and dimensions of indicators are configured in the presentation options.
- Indicators . Indicators are excellent for demonstrating overwork or other similar indicators.

VPP installation
To install the Visual Plugin Pack in OBIEE 12c, the following preparatory conditions must be met:
- download RMVPP repository by reference ;
- access the Weblogic console, for example,
http://localhost:9500/console; - have access to the folder with the set OBIEE (FMW_HOME);
- have access to the folder with the unpacked RMVPP. It is advisable not to use the folder in the OBIEE itself, but to create, for example, C: \ deployment \ rmvpp.
Next, proceed directly to the installation:
- expand the RMVPP directory to Weblogic as an application;
- select the bi_cluster cluster (All servers in the cluster) ;
- select " I will make the deployment accessible from the following location " and specify the folder in which the VPP was placed;
- go to the tab "Configuration" and install:
Servlet Reload Check (in seconds): 1Resource Reload Check (in seconds): 1JSP Page Check (in seconds): 1;
- activate and launch a new application.
It remains to edit the 3 common.js files:
$FMW_HOME/user_projects/domains/bi/servers/bi_server1/tmp/_WL_user/analytics
/eiguw6/war/res/b_mozilla/common.js
$FMW_HOME/user_projects/domains/bi/servers/bi_server1/tmp/_WL_user/analytics
/za01ic/war/res/b_mozilla/common.js$FMW_HOME/user_projects/domains/bi/servers/obips1/tmp/earmanager/analytics
/yFQcjPLJ6hS6h3PCt4KoZA/res/b_mozilla/common.js
Some subdirectories that follow the Analytics folder may have randomly generated names, so you have to manually search for files.
Paste the following line at the beginning of each file:
var src = document.createElement('script');src.setAttribute("type", "text/JavaScript");src.setAttribute("src", "/rmvpp/rmvpp.js");parent.document.getElementsByTagName("head")[0].appendChild(src);Save the changes and restart OBIEE. The Visual Plugin Pack button will appear in OBIEE.

Adding custom plugins
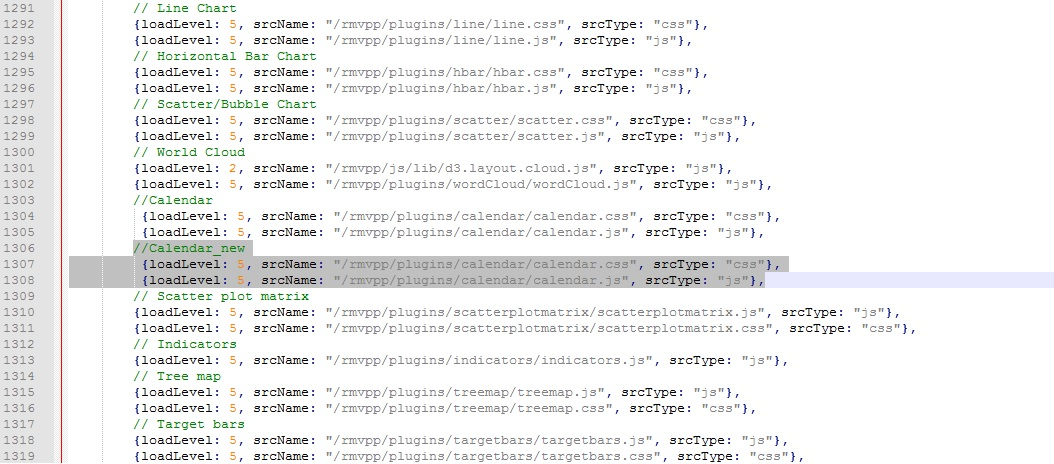
You can start small and try to add already existing views with your own modifications. To do this, create a folder along the path $ VPP_HOME \ plugins, copy into it the presentation scripts that we want to edit and add the location information for the new scripts to the rmvpp.js file.
In general, the development of new plug-ins is a rather deep topic with its own nuances and pitfalls that deserves a separate material. But I think there is no need for it, since the main points are perfectly described in the article by the VPP developer, RittmanMead. And in addition - installation guide .
Conclusion
The views discussed above are a small part of the set available for use in VPP. The rest of the submissions are also interesting in their own way and may suit you or your customer, however, the main VPP feature is different.
The Visual Plugin Pack is a whole structure that allows developers to create their own Javascript visualization plug-ins, which report developers can then use and customize using the OBIEE user interface.
For example, in the calendar presented above, we added a display of the days of the month, and adapted the beginning of the week to the Russian standard (Monday instead of Sunday). All these pleasant things for perception were “finished” by adding a couple of lines of code to the original presentation scripts.
In addition, you can add new elements to the column bindings, as well as configuration components, which will determine the scale / color / you_ think of what your future presentation will be. The potential of the tool is huge and is limited only by your imagination.
Oleg Zemnukhov, developer of Jet Infosystems business systems implementation center
Source: https://habr.com/ru/post/335082/
All Articles