Leaflet 1.xx vs Openlayers 4.xx Part 2. How maps are drawn
In the last article, I promised that this would be about communities and plugins, but then I decided that it would be better to first talk about how maps are drawn in these frameworks. I'll start with Openlayers, then Leaflet, then its plugins.

At first, the common and the banal: when the user acts, both frameworks change the internal state of the card (or the internal state changes itself from callback or by timer), and it already gives the command to redraw.
Openlayers uses two drawing options — Canvas and WebGL (the DOM render for tiles and images has been removed from the current 3rd version). The map component creates a div in which these two renders work. A strongly simplified sequence of calls is something like this:
')
Both renders work well, however, if you switch to webgl, you should remember that resources (for example, tile images) will need to be started via a proxy, otherwise you will receive:
If the server supports cross-origin, and still gives an error, put in the settings of the image source, crossOrigin: 'anonymous'
To begin with, here is a good class diagram , which is displayed again through leaflet.
A drawing leaflet creates several panels (Pane), which are DOM elements (div) that layers already work with.
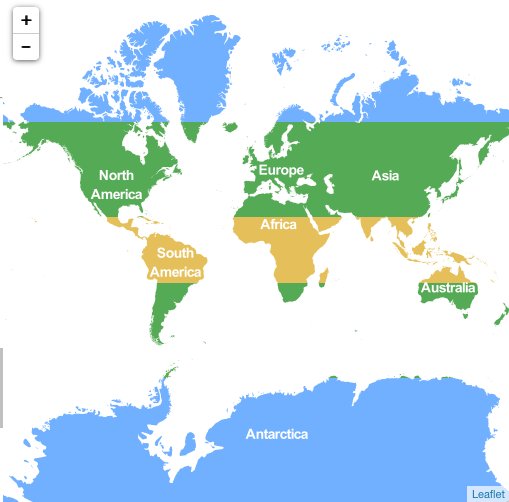
And here is the first interesting detail, if in Openlayers the numbering by zIndex is through for all layers by default, then in Leaflet, the layers are grouped. If you suddenly want your tile layer to ever be “above” vectorial, you need to either force a specific tile layer in options pane: overlay, or if all layers need pass through numbering, then put them all into one. By the way, you can create your own pane and it doesn’t have to be inside the mapPane.
And then the most interesting begins, if in Openlayers for all layers, the same set of renders is used, then Leaflet, each of the layers chooses how and what to draw. For example, tile layers and ImageOverlay are drawn only by DOM elements (although plug-ins have variations on the theme of drawing tiles using WebGl and Canvas). SVG or Canvas are used for vector layer layers; if both are supported by the browser, SVG is used by default.
As I said, despite the fact that Leaflet doesn’t have a webgl render out of the box, some plugins use this technology. Leaflet.TileLayer.GL , for example, creates a canvas instead of an image of a tile that draws a Webgl render. With this plugin, you can play with GPU performance with pixels in tiles. Here is an example of coloring pixels in tiles in latitude:
Or, from the same author, Leaflet.GLMarkers allows you to draw large volumes of points on the map (markers can be animated), although it looks crooked, especially the non-working zoom animation is annoying.
There are severe cases of plug-ins, which are served by serious companies. For example, esri-leaflet in DynamicMapLayer with each refresh creates a new layer ImageOverlay, and creates it when the corresponding image is loaded, i.e. The order of the layers on the map is constantly mixed, it is impossible to work with z-index. Your humble servant even had to make an improved version of this layer , also there is a transition through the 180 meridian, which is not in the original plugin.
Another common problem: different plug-in support for 2 main leaflet versions - 0.7 and 1.0. There are a lot of critical changes between them, and plugins may not work in a specific version. It also happens this way: one plug-in works only in version 1.0, and the other plugin we need is not updated by the author or has completely scored on his service (although now there are less and less) and it works only under the old one.
In short, the main problem of drawing a leaflet is that every plugin does everything as it pleases, someone creates an html img, someone paints on a canvas, someone webgl paints a canvas on a tile, and so on. And further work with this in the complex becomes problematic.
PS: The next article will be about the sources of map data and the possibilities of working with them in each of the frameworks, as well as the final conclusions about which framework to choose in your case.
At first, the common and the banal: when the user acts, both frameworks change the internal state of the card (or the internal state changes itself from callback or by timer), and it already gives the command to redraw.
How to draw openlayers
Openlayers uses two drawing options — Canvas and WebGL (the DOM render for tiles and images has been removed from the current 3rd version). The map component creates a div in which these two renders work. A strongly simplified sequence of calls is something like this:
')
- The renderFrame function is called in the map component.
- The layers that are visible at this scale are determined.
- Each of the visible layers draws its own image. In addition to dividing into driver types (canvas and webgl), then renders are also divided by layer types (ol.renderer.canvas.TileLayer, ol.renderer.canvas.VectorLayer, etc.).
- Transparency, transformations and cutting (clip, if any) are added to the resulting layer images and they are all drawn in the general context of the map.
Both renders work well, however, if you switch to webgl, you should remember that resources (for example, tile images) will need to be started via a proxy, otherwise you will receive:
Uncaught DOMException: Failed to execute 'texImage2D' on 'WebGLRenderingContext': The cross-origin image at may not be loaded.
If the server supports cross-origin, and still gives an error, put in the settings of the image source, crossOrigin: 'anonymous'
How to draw a leaflet
To begin with, here is a good class diagram , which is displayed again through leaflet.
A drawing leaflet creates several panels (Pane), which are DOM elements (div) that layers already work with.
| Title | Description | zIndex |
|---|---|---|
| mapPane | the main panel contains all the rest | auto |
| tilePane | tile panel | 200 |
| overlayPane | panel for vector layers | 400 |
| shadowPane | shadow panel | 500 |
| markerPane | marker bar | 600 |
| tooltipPane | toolbar | 650 |
| popupPane | panel for appearing data on objects | 700 |
And here is the first interesting detail, if in Openlayers the numbering by zIndex is through for all layers by default, then in Leaflet, the layers are grouped. If you suddenly want your tile layer to ever be “above” vectorial, you need to either force a specific tile layer in options pane: overlay, or if all layers need pass through numbering, then put them all into one. By the way, you can create your own pane and it doesn’t have to be inside the mapPane.
And then the most interesting begins, if in Openlayers for all layers, the same set of renders is used, then Leaflet, each of the layers chooses how and what to draw. For example, tile layers and ImageOverlay are drawn only by DOM elements (although plug-ins have variations on the theme of drawing tiles using WebGl and Canvas). SVG or Canvas are used for vector layer layers; if both are supported by the browser, SVG is used by default.
Features drawing in different Leaflet plugins
As I said, despite the fact that Leaflet doesn’t have a webgl render out of the box, some plugins use this technology. Leaflet.TileLayer.GL , for example, creates a canvas instead of an image of a tile that draws a Webgl render. With this plugin, you can play with GPU performance with pixels in tiles. Here is an example of coloring pixels in tiles in latitude:
Or, from the same author, Leaflet.GLMarkers allows you to draw large volumes of points on the map (markers can be animated), although it looks crooked, especially the non-working zoom animation is annoying.
There are severe cases of plug-ins, which are served by serious companies. For example, esri-leaflet in DynamicMapLayer with each refresh creates a new layer ImageOverlay, and creates it when the corresponding image is loaded, i.e. The order of the layers on the map is constantly mixed, it is impossible to work with z-index. Your humble servant even had to make an improved version of this layer , also there is a transition through the 180 meridian, which is not in the original plugin.
Another common problem: different plug-in support for 2 main leaflet versions - 0.7 and 1.0. There are a lot of critical changes between them, and plugins may not work in a specific version. It also happens this way: one plug-in works only in version 1.0, and the other plugin we need is not updated by the author or has completely scored on his service (although now there are less and less) and it works only under the old one.
In short, the main problem of drawing a leaflet is that every plugin does everything as it pleases, someone creates an html img, someone paints on a canvas, someone webgl paints a canvas on a tile, and so on. And further work with this in the complex becomes problematic.
PS: The next article will be about the sources of map data and the possibilities of working with them in each of the frameworks, as well as the final conclusions about which framework to choose in your case.
Source: https://habr.com/ru/post/334676/
All Articles