JetBrains MPS for those interested # 3
Bingo Bongo and Jimbo Jumbo, dear friends!
I had no light for 2 days at the dacha, I was practically a witch and went into hibernation, but here I am again! In this post, we will start writing weather predictions and write a little code, rather than poking it with a mouse ! Hooray! Finally!
What predictions do we want to make
Very simple! For now, we will only forecast the next day, and think up the rules ourselves; rather, the rules will not be. We will simply display the temperature the next day, absolutely the same as today. Let's make one prikolchik, demonstrating the possibilities of projectional editor.
Concepts
In this case, we will resort to a cool feature - we will create a concept that will contain only a link to the original data, and we will output the data as a graph on our Swing component. About how we can, although I do not like swinging horror.
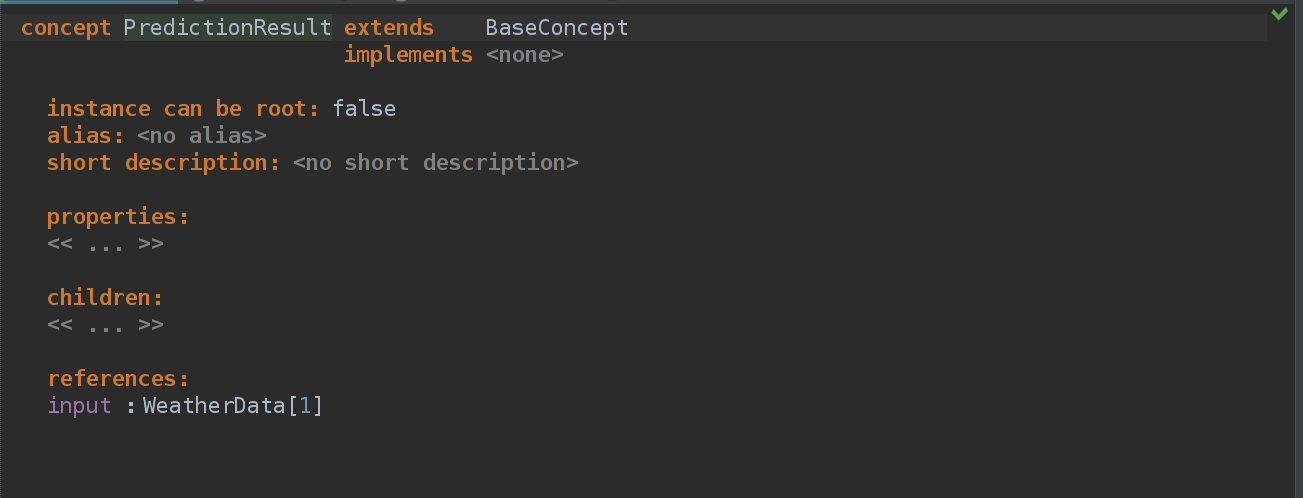
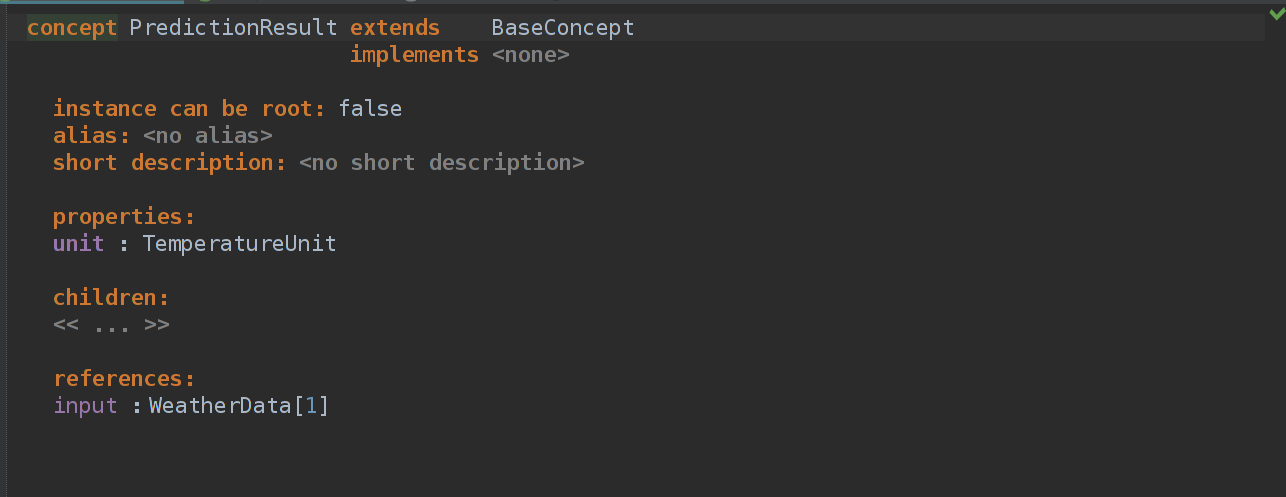
Create a PredictionResult concept, add reference "input" to it, which is a link to the concept implementation in the current scope of AST! But since we do not need scopes, or scope , then we’ll get to search for all elements of this type. (By the way, Scopes is not the easiest topic in MPS + for it is quite complicated documentation, sometimes incomprehensible, so I’ll roll over an article about Scope Someday.) But now you need to add authentication for WeatherData , change the structure and the Editor aspect a bit.
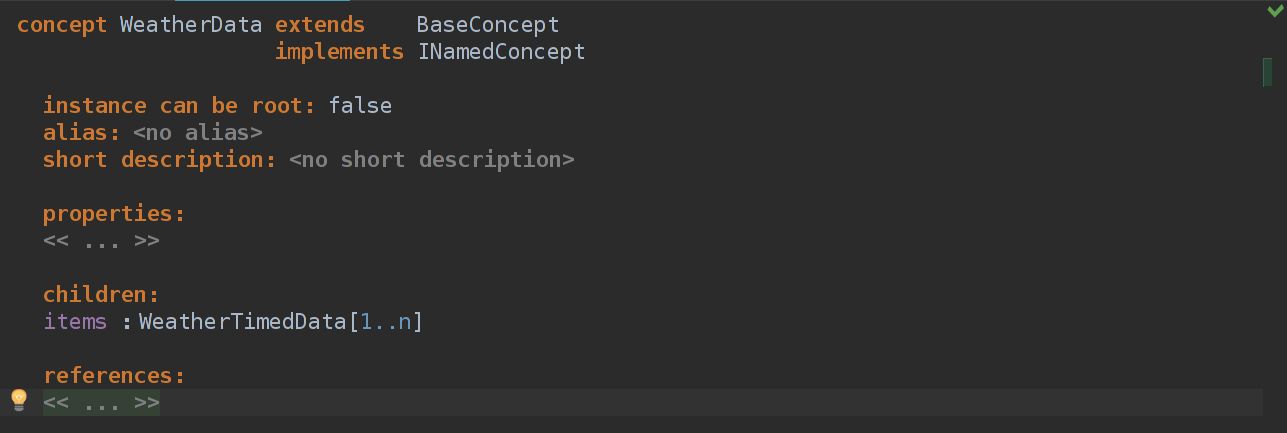
I added INamedConcept after implements , and now our WeatherData concept has a name, but we don’t give it a name, so we’ll change the Editor .
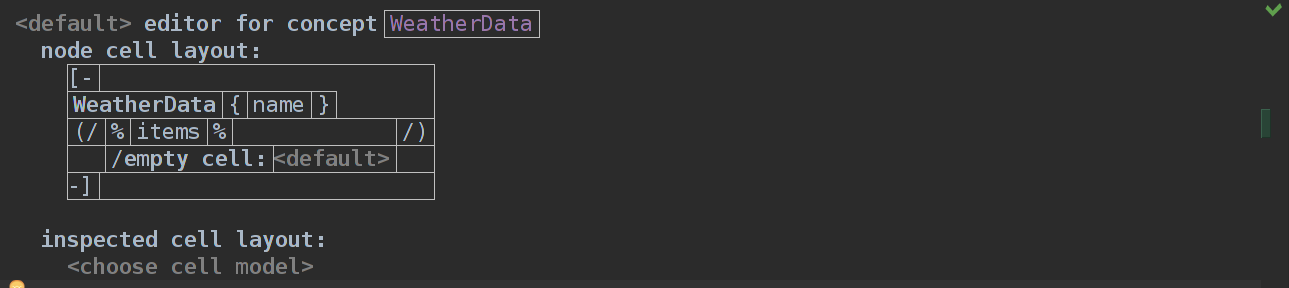
Here we just added 1 line, which will contain the name. Reassemble the language and see what happened.

')
Hurray, now call this WeatherData named "today" and return to the concept of PredictionResult and change its Editor aspect.
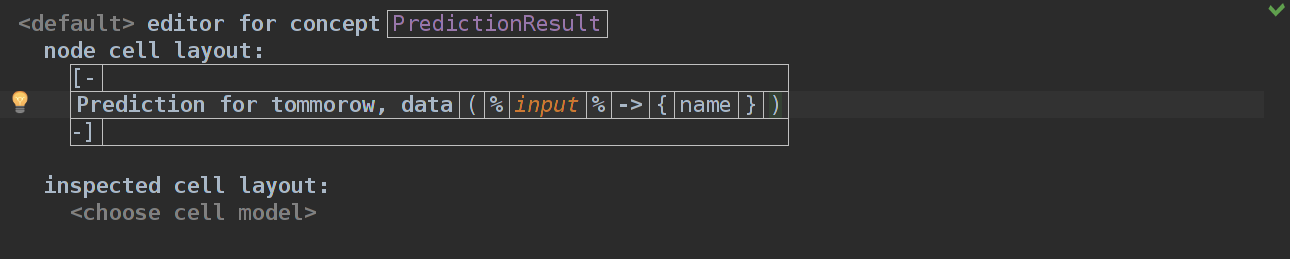
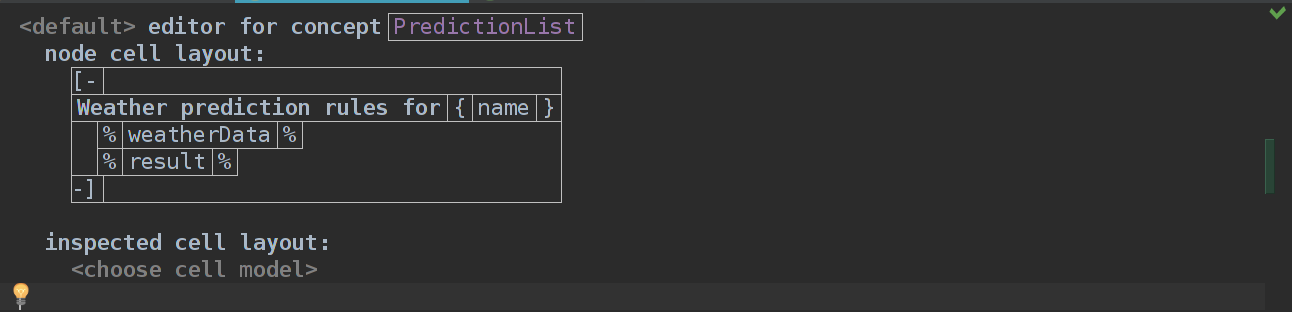
Let it be for now. We will have Prediction for tommorow, data% name_of_weather_data%
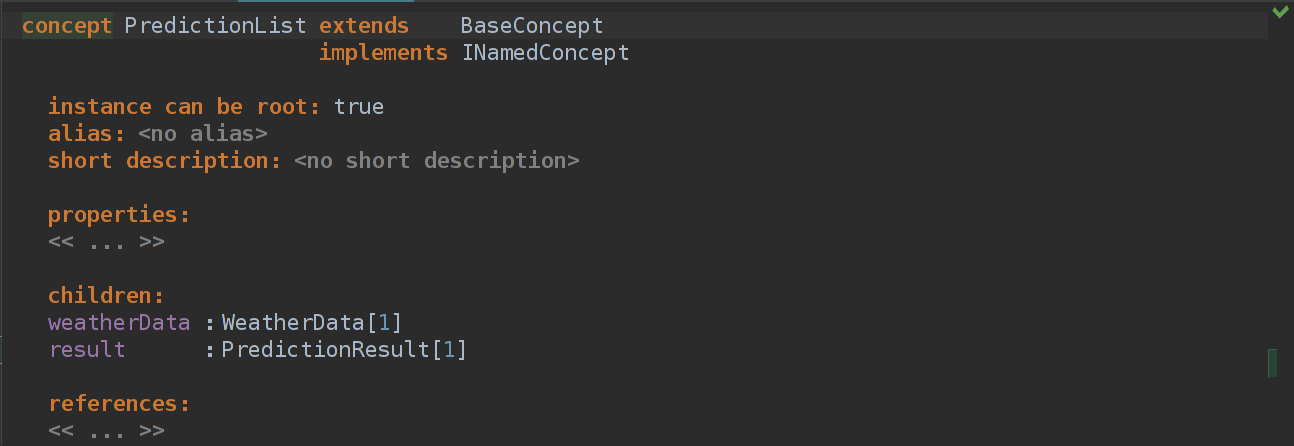
Add a concept to PredictionList - our root concept, where only input data is still available.
If you collect, you get
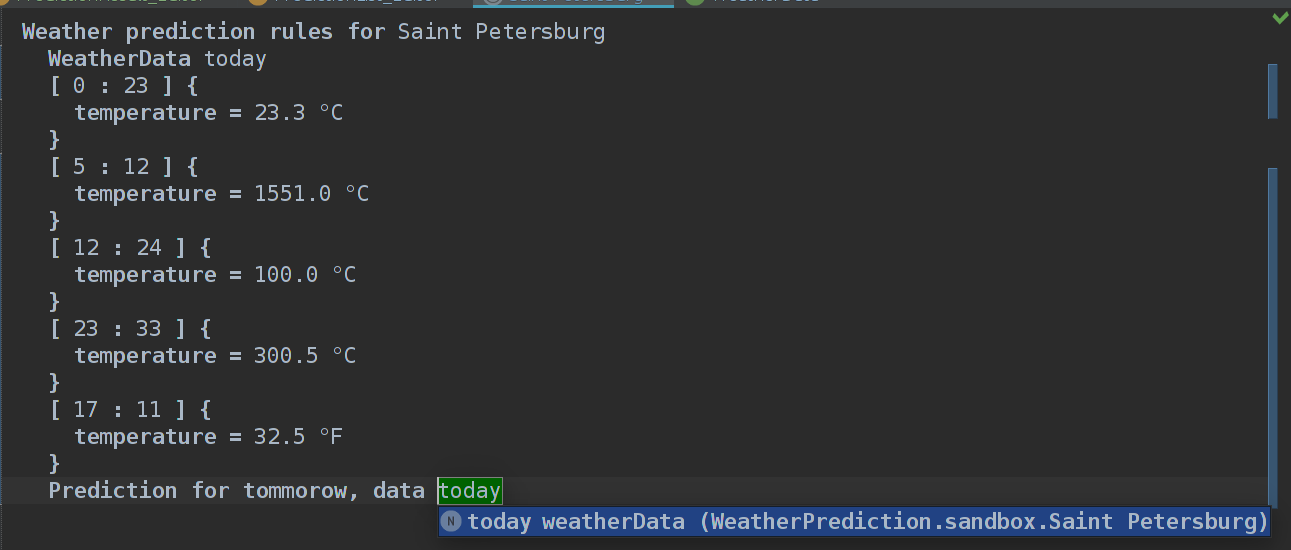
... just what we wanted. We can choose WeatherData from the list (it's okay that we only have 1 WeatherData, but it’s expandable).
Great, now we need to somehow cool to display our forecasts. I have already written that we will output them on the swing component, if anyone does not know - javax.swing. - package for the development of native graphical interfaces in Java. It is built IntelliJ. Swing components can be used in the editor. Urya.
Before you draw the whole thing, write out the points, how we act.
We take the width of the graph in pixels and divide it by 60 * 24 - the number of minutes per day. This is necessary in order to correctly display the points on the x-axis.
We translate all temperatures into one unit of measurement, for example, Celsius (then we adjust it so that we can choose, show in Celsius or in Fahrenheit) and find the highest temperature and the lowest. Subtract the smallest from the largest and get the full "height" in degrees. The bottom line is that if we divide the height of the graph by this value, we get how many "pixels in one degree." This is required in order to project temperatures on a graph.
We sort the array of input data by time (the closer to 00:00 - the less, of course) and pass through it. We calculate x by the formula
$$ display $$ time_in_minutes * coefficient_ of_point_1 $$ display $$
a y
$$ display $$ temperature * coefficient __ from __ item 2 $$ display $$
PS formula is terrible
- We draw!
In order not to torment you with a phased writing of lines, I will throw off the whole and go through more or less difficult places.
{ final int chartWidth = 400; final int chartHeight = 200; final JPanel panel = new JPanel() { @Override protected void paintComponent(final Graphics graphics) { super.paintComponent(graphics); editorContext.getRepository().getModelAccess().runReadAction(new Runnable() { public void run() { string unit = node.unit; final list<Point2D.Double> labels = node.input.items.where({~it => !it.temperature.concept.isAbstract(); }).select({~it => message debug "Woaw!" + it.temperature.concept.isAbstract(), <no project>, <no throwable>; double x = it.time.hours * 60 + it.time.minutes; double y = it.temperature.getValueFromUnit(unit.toString()); new Point2D.Double(x, y); }).sortBy({~it => it.x; }, asc).toList; final double minTemp = labels.sortBy({~it => it.y; }, asc).first.y; final double maxTemp = labels.sortBy({~it => it.y; }, asc).last.y; final double yKoef = chartHeight / (maxTemp - minTemp); final double xKoef = chartWidth / (60.0 * 24.0); int prevY = chartHeight; int prevX = -1; Graphics2D g2 = ((Graphics2D) graphics); labels.forEach({~it => message debug unit + "/" + it.y, <no project>, <no throwable>; int xTranslated = (int) (it.x * xKoef); int yTranslated = chartHeight - (int) ((it.y - minTemp) * yKoef); g2.setStroke(new BasicStroke(1)); if (prevX > 0) { // It is first element, no need to draw trailing line g2.drawLine(prevX, prevY, xTranslated, yTranslated); } g2.drawString(String.format("%.2f", it.y) + unit, xTranslated + 3, chartHeight - Math.abs(chartHeight - (yTranslated + 20))); g2.setStroke(new BasicStroke(5)); g2.drawLine(xTranslated, yTranslated, xTranslated, yTranslated); prevX = xTranslated; prevY = yTranslated; }); } }); } }; panel.setPreferredSize(new Dimension(chartWidth, chartHeight)); return panel; } The first thing that catches the eye is editorContext.getRepository().getModelAccess().runReadAction...
This is such a feature of the MPS editor: in order to access the model / node from anywhere, we need to request the execution of this code. This is similar to runOnUIThread in android, the meaning is about the same. In short, if you need to get something from the main thread, then you need to do it that way. There is runWriteAction , it is needed for making changes and we still need it.
What happens inside:
1) We define the units
2) Determine the width and height of the chart
3) Transform an array of type WeatherTimedData into a list of type java.awt.geom.Point2D.Double , where
and y = temperature in the selected measurement, for example, in Celsius.
We use the baseLanguage syntax, which makes working with collections easier and allows for the normal use of various patterns, such as map , filter , flatMap . Naturally,
instead of the usual names, select , where , selectMany are used, respectively.
Attention! A piece of code that is responsible for filtering WeatherTimedData , namely where({~it => !it.temperature.concept.isAbstract(); }) - when we initialize a new WeatherTimedData , then our temperature is not initialized. That is, we have no default in Celsius or Fahrenheit, so we have an abstract temperature, and if we didn’t add this filtering, then our editor would hang. Here it is, experience!
4) We obtain the upper and lower limits of temperature, then we get the very "coefficients" for the projections on the axes
5) Drawing on the component is a very simple part. If we draw the first point - we draw only a point and a signature about the temperature, if we draw NOT the first - we draw a line between the previous and current points. Well, plus all sorts of visual prikolchiki, ala indents from the edges, so that you can see the text.
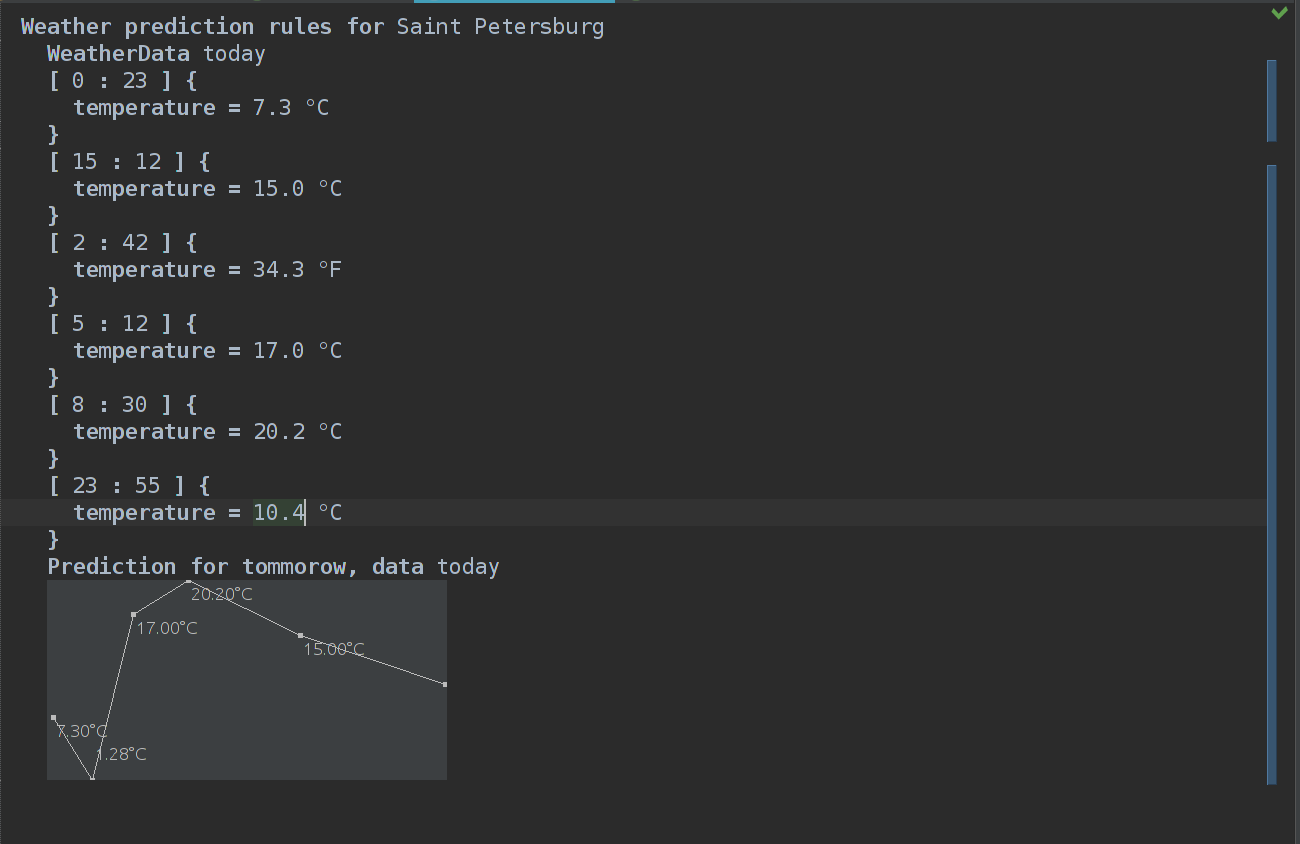
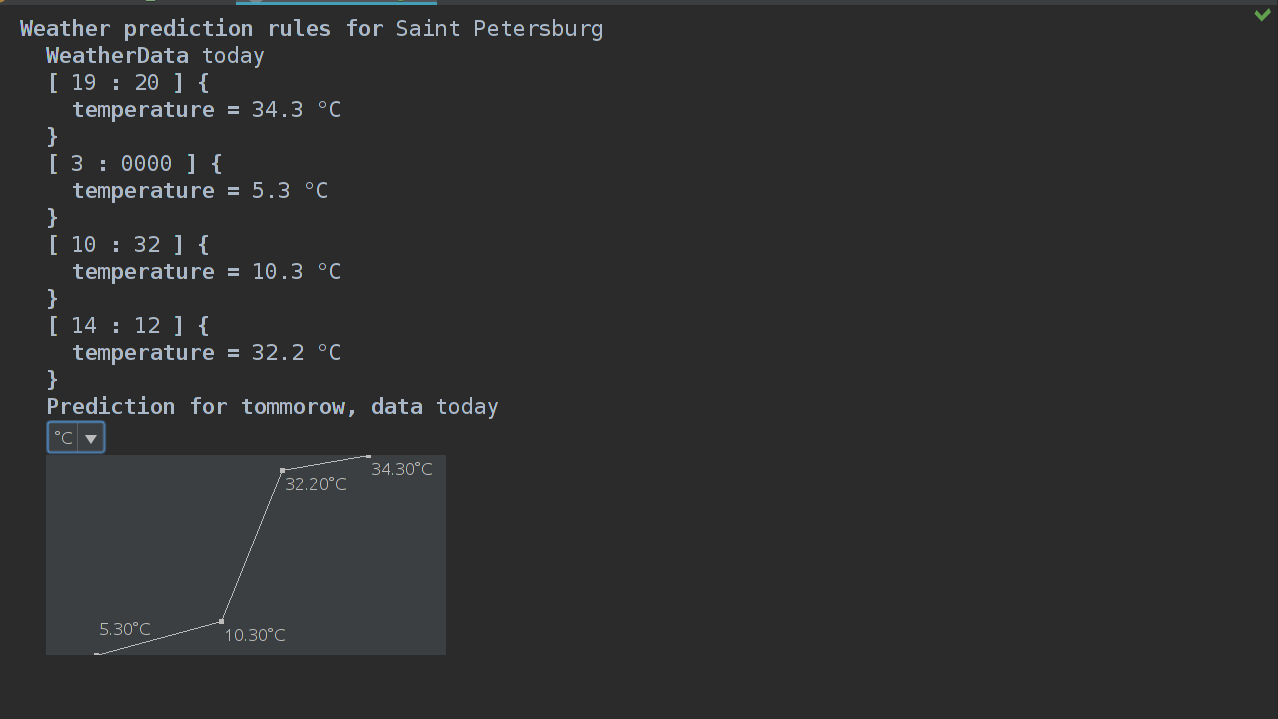
Wow What is this - really schedule? Right in the code editor? Which is reactively updated if you change the temperature or time? Wow
Nevertheless, now the width and height of the chart are hardcoded, and we cannot choose units of measurement.
Now is the time to replace our hard-core "° C", "° F" with enumeration datatype everywhere. I think it’s not worth explaining the essence of enumeration, only in the context of the MPS.
enumeration datatype is a simple enum class that can be used in property.
If earlier we used only string , integer and _FPNumber_String , then now we can create an enum for temperature measurement units, in which there will be 2 elements: Celsius and Fahrenheit.
PCM on WeatherPrediction.structure → New → Enum Data Type → TemperatureUnit .
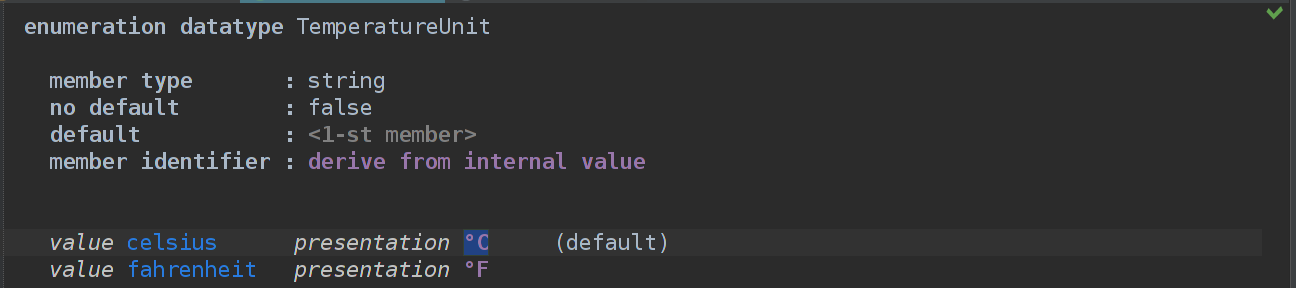
We select type, in this case string
We need the default value, so we leave false in no default
default = first member (celsius)
member identifier - is responsible for determining the item by input. To change the TemperatureUnit value, you need to input a string that is compared with each internal or external value, whichever you choose.
I explain: what is left and blue is the inner value of the element enum. It is hidden. Right - external, it is used to display in the editor.
That is, if we choose derive from internal value in the member identifier , then we will have to set the value to either celsius or fahrenheit . And if we choose to derive from presentation , then we will have to set the value in ° C or ° F. You can also add custom identification, for example, so that you can set a value by internal and external value, but we don’t need it ourselves.
Select derive from presentation and add 2 elements.
Clearly!
Add the unit property to the PredictionResult .
Now we need to add a drop-down list in which we will select the unit of measurement.
string[] units = enum/TemperatureUnit/.members.select({~it => it.externalValue; }).toArray; final ModelAccess modelAccess = editorContext.getRepository().getModelAccess(); final JComboBox<string> box = new JComboBox<string>(units); box.addActionListener(new ActionListener() { public void actionPerformed(ActionEvent p0) { modelAccess.executeCommand(new EditorCommand(editorContext) { protected void doExecute() { Object selectedItem = box.getSelectedItem(); node.unit = selectedItem.toString(); } }); } }); box.setSelectedIndex(0); box; This is the code for another $ swing component $ in the PredictionResult code editor. We get a list of possible temperature units, create a drop-down list, hang the event handler. It also uses the "funny MPS", instead of readAction or writeAction you can simply executeCommand . Apparently, 2 previous exist for readability.
When the selected item is changed from JComboBox, the node.unit is changed , which is set to a string value, as I explained above.
We collect language, we look.

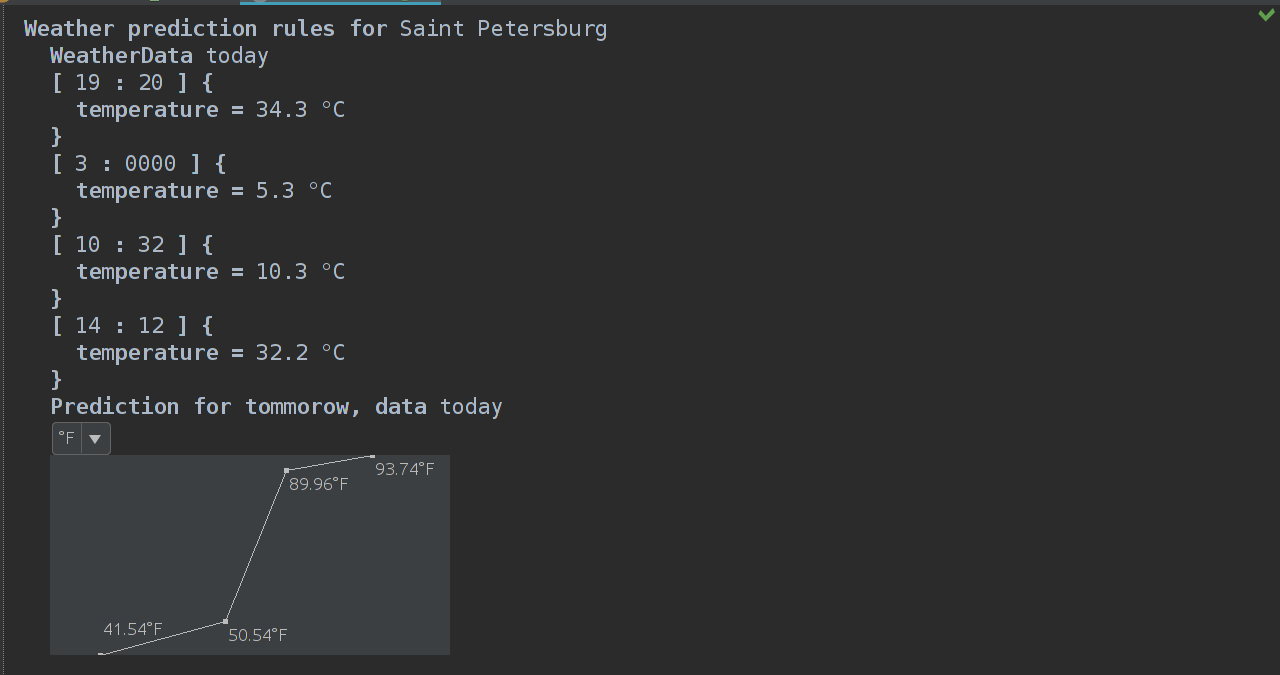
Believe me, it really falls there and fahrenheit. It remains only to link the JComboBox and the schedule, and on this you can finish, and it will be easy to do. I cite the original graphics rendering code.
{ public void run() { string unit = "°C"; final list<Point2D.Double> labels = node.input.items.select({~it => double x = it.time.hours * 60 + it.time.minutes; double y = it.temperature.getValueFromUnit(unit.toString()); new Point2D.Double(x, y); }).sortBy({~it => it.x; }, asc).toList; final double minTemp = labels.sortBy({~it => it.y; }, asc).first.y; final double maxTemp = labels.sortBy({~it => it.y; }, asc).last.y; final double yKoef = chartHeight / (maxTemp - minTemp); final double xKoef = chartWidth / (60.0 * 24.0); int prevY = chartHeight; int prevX = -1; Graphics2D g2 = ((Graphics2D) graphics); labels.forEach({~it => message debug unit + "/" + it.y, <no project>, <no throwable>; int xTranslated = (int) (it.x * xKoef); int yTranslated = chartHeight - (int) ((it.y - minTemp) * yKoef); g2.setStroke(new BasicStroke(1)); if (prevX > 0) { // It is first element, no need to draw trailing line g2.drawLine(prevX, prevY, xTranslated, yTranslated); } g2.drawString(String.format("%.2f", it.y) + unit, xTranslated + 3, chartHeight - Math.abs(chartHeight - (yTranslated + 20))); g2.setStroke(new BasicStroke(5)); g2.drawLine(xTranslated, yTranslated, xTranslated, yTranslated); prevX = xTranslated; prevY = yTranslated; }); } } Yes, dare? We only need to replace string unit = "°C"; on string unit = node.unit; and we are guchi!
And now the result: the schedule in Celsius and Fahrenheit, wah!
PS
I think it is in this article that there are a lot of typos, discrepancies, because I was distracted a lot, at least to realize what I wanted to tell in this article. Every day, the opening, so please write in the comments all the points that seem strange to you, most likely I dropped out of the context of the story and wrote some kind of heresy.
In the next article, we will look at an aspect like TextGen. We will generate a weather forecast in text form!
Source: https://habr.com/ru/post/334672/
All Articles