PERFEXPERT Monitoring System - Database Management Problem Solving
 Specialized software package "PERFEXPERT" is an independent software product that allows you to collect, log and visually display information about the load on the MS SQL database system, evaluate the effectiveness of their work and identify the causes of low performance.
At the beginning of summer, SOFTPOINT, the developer of this software, and STSS, a manufacturer of server hardware, launched a campaign: when buying any server or storage, the client receives a Certificate for free testing of the PERFEXPERT DBMS diagnostics software for a period of 3 months. The action will last until the end of the summer.
Given the positive result of the action, we decided to expand the range of its coverage. From today, within 3 months, any reader of this article gets 2 weeks of PERFEXPERT testing in their database infrastructure.
Description of the functional
Below are data from official documents for PERFEXPERT version 3.3. Since the product is constantly being improved, after a while the relevance of the data from this article may partially decrease.
')
General information and working principle
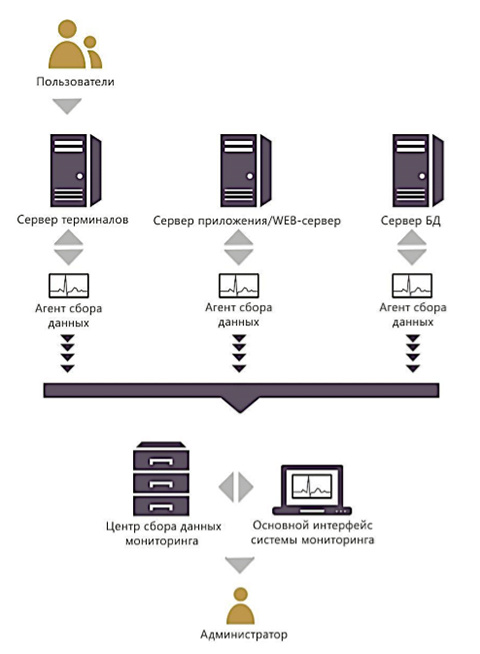
PERFEXPERT, a system for monitoring performance and analyzing databases, allows you to get a complete picture of everything that affects the performance of the SQL server (including servers in the AlwaysOn availability group and fault tolerant clusters), replication servers, terminal servers, and 1C application servers with a high degree of detail.
The system has a simple connection to any database running MS SQL Server since version 2005 and is fully integrated with most popular information systems such as: 1C: Enterprise, Microsoft DynamicsAX and DocsVision.
The great advantage of PERFEXPERT is the possibility of simultaneous work with several databases both in on-line mode and in subsequent work with archival data accumulated over previous periods. It uses a single management and analysis console for data from all servers (nodes).
In addition, PERFEXPERT monitoring allows you to analyze statistics on all collected data sources with maximum detail, which makes it possible to determine with high accuracy problem modules, non-optimal SQL queries, as well as identify the causes of server slowdowns, both in terms of operating system settings and MS SQL server settings.
The ability to create flexible reports in PERFEXPERT in any sections of the information system, allows you to analyze many factors and subsequently make correct and optimal management decisions to eliminate performance problems.
Using our own development of Softpoint Point Cluster Technologies, PERFEXPERT, by conducting round-the-clock (24x7) active event monitoring on all servers at the same time , it allows using no more than 3% of operating system resources when monitoring information systems in real time.
The information obtained during the monitoring can be used by personnel both for self-response to critical situations leading to the suspension or loss of a part of the system functionality, as well as in the framework of productivity projects developed by SOFTPOINT.
The functioning of the complex is based on the collection and subsequent analysis of factors affecting the quality characteristics of servers, such as: response time, throughput, processor load (including, in the context of each MS SQL session, individual groups of queries, databases), the volume of input operations - conclusion, etc.
The PERFEXPERT system collects tracks that are configured using different templates:
- for long SQL queries
- SQL queries that consume significant memory and disk resources
- on locks and deadlocks
First of all, the PERFEXPERT software package analyzes the following factors:
- server load dynamics in the context of MS SQL sessions, databases, groups of SQL queries
- causes of locks and deadlocks with details on objects of locks
- load on the computing server subsystem
- network subsystem load
- dynamic resource sharing between MS SQL Server and OS
- client side bottlenecks
- database service quality
At the same time, the result obtained may reflect not only the text of a non-optimal SQL query, but also the user name, module number, and a line of code creating a greater load on the system. This allows you to quickly get information about problems and users who create them.
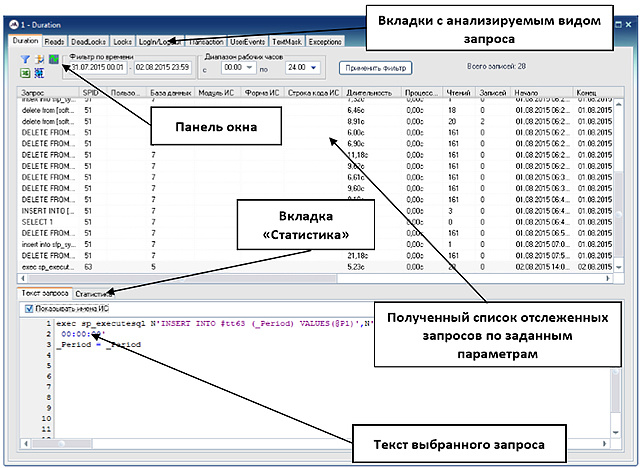
Interface
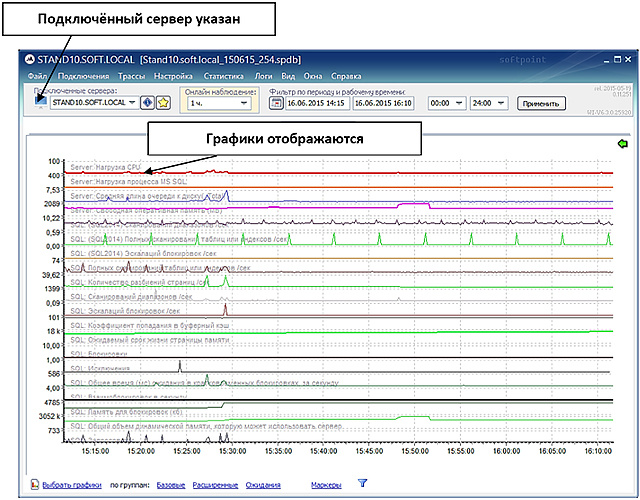
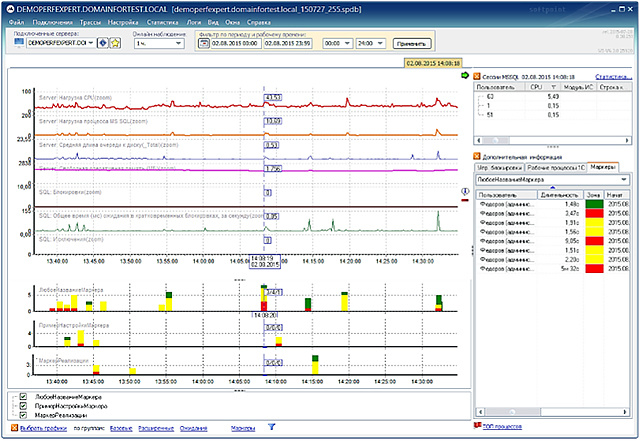
When the program is started correctly, the main window will open, in which the monitoring results will be displayed in the form of graphs and, with the appropriate settings for the window view, a number of additional windows and panels.
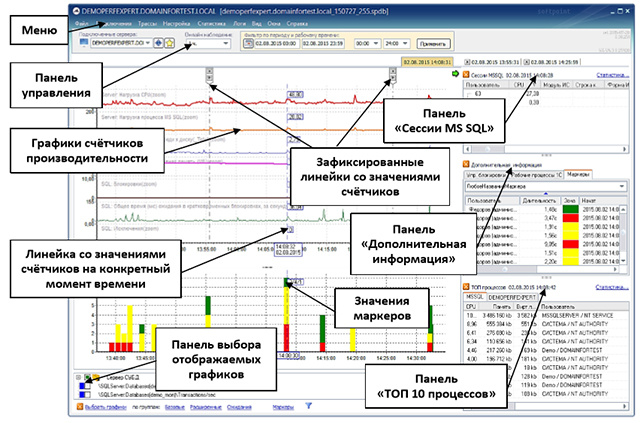
The information displayed in this application window allows you to monitor and promptly inform the DBMS administrator about the problem encountered in on-line mode. In this case, observation and analysis can be performed with different levels of detail.
The primary information for the user of the program is, first of all, the graphs of the observed processes, the display that the operator can select and group, depending on the specifics of the tasks to be solved. Additional panels allow you to organize and specify the information of interest.
The control panel displays information about the connected server. This control allows you to switch between monitored database servers. At the same time extinguished icon
 indicates that the data collection agent is disabled or does not show activity for more than 20 seconds. Blue icon
  - indicates the activity of the agent.
The drop-down list “Online observation” allows you to select the observation time interval displayed on the graphs, counting from the moment of receipt of the latest data.
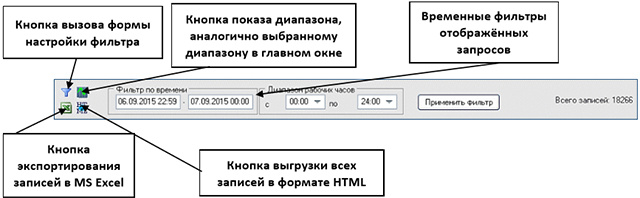
Filter by period and working time allows you to select the display range of graphs, which makes it possible to view data for the past period.
To accurately determine the values of the counters on the graphs at a certain point in time, a ruler is used - a straight vertical line that appears when the mouse cursor moves over the graph window.
When the ruler intersects with each of the graphs, the values of the corresponding graphs are displayed. On the “MS SQL Sessions” “Additional Information” and “TOP 10 Processes” panels, measurements are displayed at the point in time selected by the mouse cursor on the graph.
To fix the tables with measurements on the “MS SQL Sessions”, “Additional Information” and “TOP 10 Processes” panels, double-click the graph image. A new tab for the selected point in time will appear.

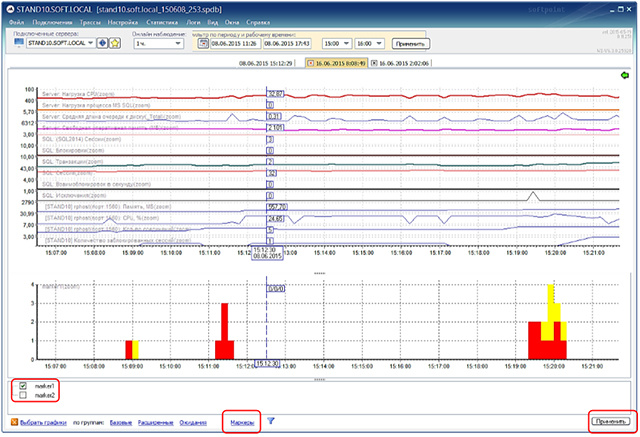
On the main monitoring window, a separate option displays the ability to display custom measurements (markers). It appears on the main monitoring window only after they have been entered and configured.
The markers set in the configuration of the observed information systems, when enabled, the corresponding panel in the main monitoring window allows you to visually determine “good”, “bad”, “excellent” in online mode by the duration of the operation per unit time
The vertical scale of the marker bar displays the number of operations per unit of time, the horizontal one is the time scale.
Options from the "Menu" panel allow you to effectively manage the viewing of incoming or recorded information from servers, to generate statistics on the collected data.
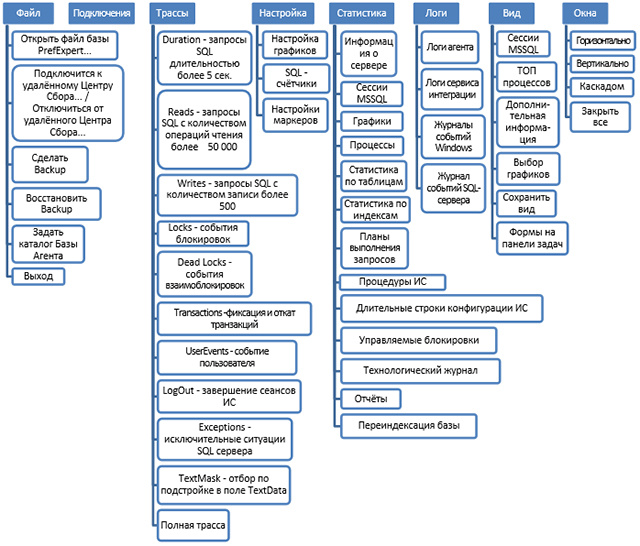
The Menu panel provides ample opportunities for the operator to customize the appearance of the program, to easily navigate between the viewing windows of the collected statistics in the context of various data groups, which allows optimizing the search process for the causes of system performance degradation.
Further, under the spoiler, there is a detailed user manual PERFEXPERT. I recommend disclosing it if you seriously thought about testing this monitoring and diagnostic system, or have already begun to use it.
For general acquaintance with this software, it is better to use the 40-minute overview video just below. It describes both the actual application and the description of the functional.
Description of each program submenu
The main purpose of the “File” submenu is to control the operation modes of the Data Collection Center, archive and restore from monitoring archives created earlier, fast navigation.
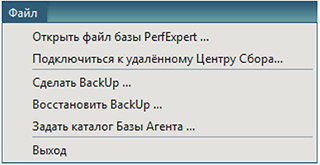
The option “Open PerfExpert database file ...” - selects a previously recorded recorded observation file with the extension * .fdb or * .spdb .
This option is intended both for working with PERFEXPERT archive files and for situations when it is not possible to connect to the server via a local network. For example, a database file is received from a remote affiliate by email.
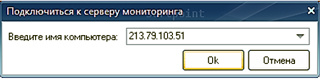
The option “Connect to remote Collection Center ...” creates a connection to the monitoring server. When you select it, a window will appear in which you need to specify the network name of the computer or its IP address to establish a remote connection and, if the connection is successful, ask for the user name, the access password and the port that will be used for data exchange.

After a successful connection, the option will change the name to “Disconnect from the remote Collection Center ...”, choosing which user returns to the Collection Center located on the local computer.
The “Make BackUp ...” option allows you to save the collected information of the observed database to a file (backup) and, if necessary, add a backup copy to the archive.
The monitoring system creates a new database every Monday at one o'clock in the morning, and in the name of the database file, by default, the domain name and server name are specified, as well as the date of its creation (for example, 2014-05-14-dbs.local_140512_234).
If you select this option in the window that opens, you will be asked to choose the option to save the databases and two fields will open:
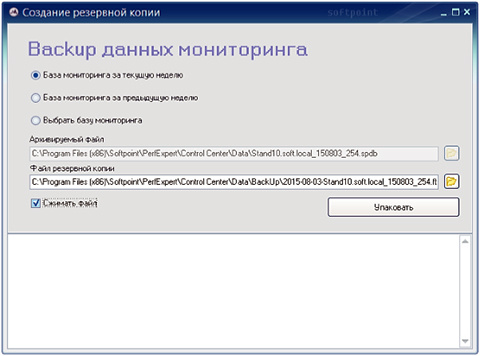
If you need to make a backup copy of the PERFEXPERT monitoring database for the previous or the current week, then you need to select the corresponding item, and click the “Pack” button. After a while, the backup file will be ready.
If you need to make a copy of the database for a different period, or in the case of an expired license, you must act as follows:
The “Restore BackUp ...” option is the inverse function of the “Make BackUp ...” option, which allows you to restore the collected information from the backup file from the backup file.
Recovery occurs both from the extension file * .7z, and * .fbk. The unzipped file will have the extension * .spdb.
The “Set Agent Base Directory” option allows you to set a local directory that will be used by data collection agents to create their own databases.

By default, the collection bases are located in the folder where the monitoring system was installed in the \ data subdirectory. The name of the database consists of the fully qualified domain name of the computer being monitored and has the extension * .fdb.
The “Exit” option is the completion of the PERFEXPERT program.
The "Connections" submenu displays a list of MS SQL servers on which data collection agents are installed that are connected to the Collection Center. It is used to switch between several MS SQL servers connected and on-line that collect data in a single Collection Center.
In MS SQL, there are frequent situations when a particular query is slow, and there are no obvious problems in the query text. Usually in this case it is necessary to investigate the problem at a deeper level.
The PERFEXPERT software package in the course of work creates traces on the MS SQL server side, which continuously record a stack of running queries that meet the criteria for a duration of more than 5 seconds or more than 50,000 logical reads, and also collects blocking and deadlock events.
The "Trails" submenu is used to identify the bottlenecks of the information system in the context of groups of SQL queries and is designed to create and analyze trace results and identify problems encountered during query execution.
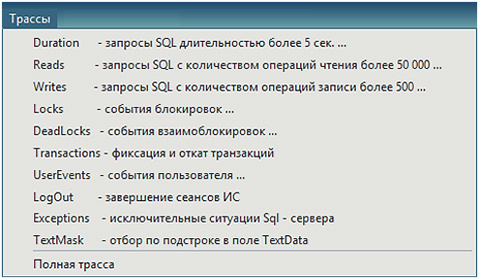
The option “Duration - SQL queries for more than 5 seconds” - allows you to display and analyze long-term SQL queries, which are the main source of information when examining the increased load on the MS SQL server computing subsystem.
As a result, a separate window will display lists of long-running queries, with the ability to view the text of the selected query, as well as to obtain statistical data on the groups of queries that create the largest total load on the server.
The “Statistics” tab allows you to group queries by their different parameters and estimate the load generated by queries, for example, in the context of databases, user terminals / sessions, query type, modules / forms / procedures of the information system. The user has the ability to both independently select the fields for which the grouping takes place, as well as use the 3 most requested grouping templates.
The option "Reads - SQL queries with the number of read operations more than 50,000" - allows you to display and analyze SQL queries that are the main source of information when examining the increased load on the disk array, problems with the MS SQL data cache of the server.
The option "Writes - SQL queries with the number of write operations over 500" - allows you to display and analyze SQL queries that load the disk system with write operations.
The option “Locks - blocking events” displays the blockings that occurred during the observation, at the SQL level and, in the first place, allows you to determine their type, duration, status and blocking resource.
The option "Dead Locks - deadlock events" - displays the deadlocks that occurred during the observation, when transactions block each other and violate the order of access to objects. Allows you to find out, if possible, the cause of deadlocks, blocking and blocking sessions, problem queries.
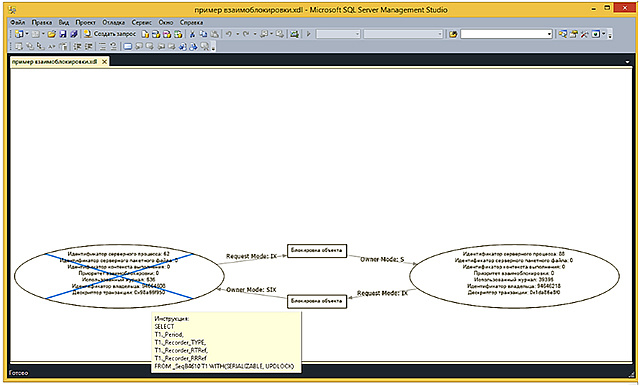
In the received sample, in the “Request” field you can see a notification about the deadlock that occurred, a description of the threads that were interlocked, or the interlocking graph, the full text of which can be examined in the “Request Text” tab.
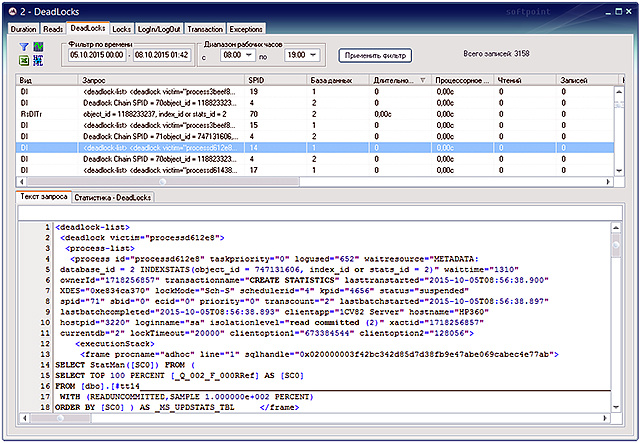
If this graphic description of the tasks and resources involved in the deadlock is copied and saved to a file with the * .xdl extension, then opening it in Microsoft SQL Management Studio you can visually see the deadlock in the graphical representation.
The option “Transactions - commit and rollback of transactions” allows you to display and analyze the duration of completed and rollback of incomplete transactions. The window view of this option has a structure that is different from the majority of options in the “Routes” submenu.
The option "UserEvents - user event" - allows you to identify requests that load the server with events that are created by custom code.
The option “LogOut - completion of IP sessions” - displays forced or abnormally terminated database connections recorded during the observation time.
The “Exceptions - SQL Server Exceptions” option displays errors that occurred during the observation process, which make it impossible to continue executing SQL commands.
The option “TextMask - selection by adjustment in the TextData field” allows you to analyze all queries that contain a substring from the configurator of the Data Collection Agent in the Text mask field in the text.
The “Full trace” option allows you to enter a trace entry in the mode in which all requests are collected without prior filtering. In the settings of the full trace, you can specify the following limiting factors as the maximum trace file size and the maximum trace duration.
Enabling full tracing has a significant load on the SQL server. Therefore, it is advisable to use this option when you need to define queries that are not visible in standard routes: queries of less than 5 seconds (duration), or queries that performed less than 50 thousand logical reads (reads).
In the "Setup" submenu , the user has the ability to customize the composition of graphs displayed in the main monitoring window, including custom SQL counters, as well as custom measurements (markers)
The option “Configure graphs” brings up a window in which you can choose the displayed color of graphs in the main monitoring window. Double-clicking on the counter, which needs to change the color, will cause the standard Windows color selection window. After the changes are made and clicking the "Apply" button, the selected settings will be applied.
Pressing the “Save as template” button allows you to return to the selected color setting of the displayed counters by pressing the “Use template” button.
The “SQL-counters” option allows you to create custom SQL-counters designed to monitor the performance of MS SQL server. When you add a SQL counter, it will automatically appear in the general list of counters after a while, which will mean that the collection of this counter is correct.
The “Marker Settings” option allows you to customize the collection and select the mode of displaying the values of the markers (custom measurements), the type of graphs displaying them, and the color settings. Each user metering will be displayed in the main window, under the main form with regular graphs, in the form of a three-zone graph.
Markers are configured in the “Marker Collecting” tab of the marker settings window.
To add a marker, you must click on the “Add” button and fill in all the necessary parameters of the marker, and then click on the “Apply” button to save the settings.
To temporarily disable markers in the “Active” field opposite to the selected measurement, the corresponding flag is removed.
If it is necessary to delete a custom metering, the marker is selected in the table to be deleted, the “Delete” button is pressed, and further, the “Apply” button is used to confirm the action.
The settings for displaying markers in the main monitoring window are made in the “Display” tab of the settings window for markers.
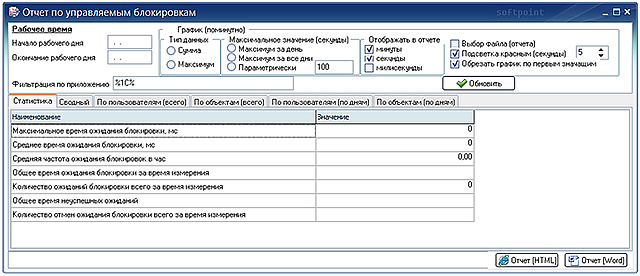
In the "Statistics" submenu, the user has the ability to generate statistical information on the collected data, as well as display them in the form of reports.
The options of this submenu allow you to assess the activity of the database, its users, the workload and the efficiency of the system. The presented statistical information can be used to set up exploited programs, troubleshoot, etc., allowing you to quickly identify their bottlenecks.
Viewing statistical data and analyzing reports will allow you to timely and reliably identify the most resource-intensive SQL queries, allowing the administrator to focus on optimizing precisely those queries that most affect the database performance.
The "Server Information ..." option opens a window for viewing detailed information about the monitored database server.
The monitoring agent updates the server information daily at night. In the field, you can select a date. The left part of the window shows a tree that allows you to conveniently view the operating system settings, hardware, database settings and MS SQL server settings.

The “MS SQL Sessions” option brings up a window for calculating statistics on MS SQL sessions. The same option is called by the “Statistics” button located above the “MS SQL Sessions” panel of the main monitoring window.
Provides the ability to group loading processes by the following values:
Using the “Filters” button, you can set the necessary restrictions on the statistics being formed.
After selecting the reflected fields, filtering parameters, period and working time and clicking the “Generate” button, the requested statistical information will be calculated and presented in the table.
In the menu, called by the right mouse button, as well as the key combination "Ctl + A" and "Ctl + C", you can select all the rows of the table of the result, respectively, or copy the selected result lines to the clipboard.
The “Charts” option brings up a window for calculating the statistics of counters on charts displayed in the main monitoring window.
Formed according to a given period and working time, the statistical data reflect the averaged, maximum and total values of the specified counters, with a breakdown by period: days, hours.
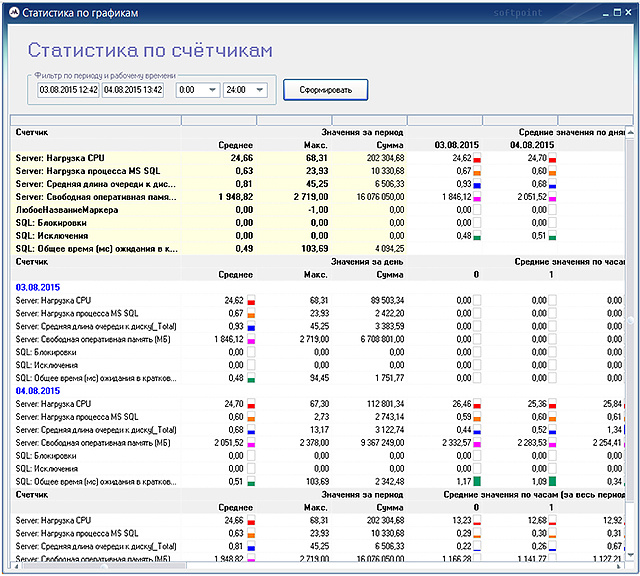
The presented table is also divided vertically into 3 parts:
When changing the set of visible graphs, when a new statistics window is opened on the graphs, the set of counters automatically changes and corresponds to the graphs displayed in the main monitoring window.
«» MS SQL, .
, , , , .
« » , .
, , , , .
2 :

, , MS SQL .
« » , . . , .
, . « », .
, .
3 :
, «» , . 5 :
« » , SQL-, Microsoft SQL Management Studio.
, - , - .
. , SQL- .
, , , .
, : .
« MS Studio» Microsoft SQL Management Studio.
« » . , on-line , .
, . «» – . « » – , .
:
« » , , 100 .
. « », «».
«» , .
HTML, , , MS Office, , PERFEXPERT.
« » . , .. , .
PERFEXPERT . PERFEXPERT . , .
«» , Windows, .
« » , , . , :
, , .
. : «» « » .
« Windows» , , .
«» (, , ) «».
« SQL-» , SQL-, .
«» , .
« MS SQL» , .
« MS SQL» , ( ) :
MS SQL, «», «» .
:
« 10 » 10 Windows .
, , , ( ).
« 10 » , ( ):
«» , . « » «».
« » , 4 :
, , .
« » . .
, :
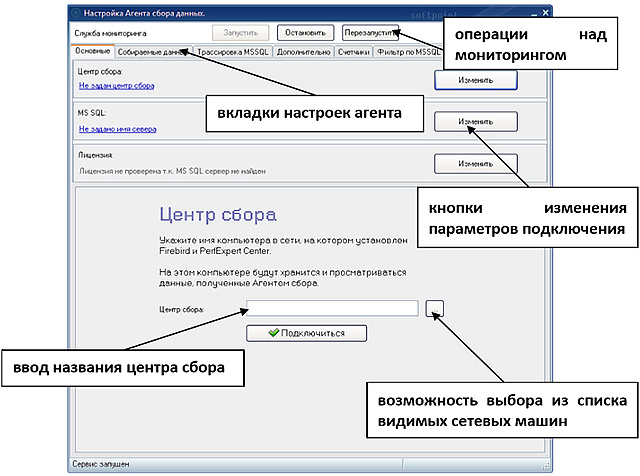
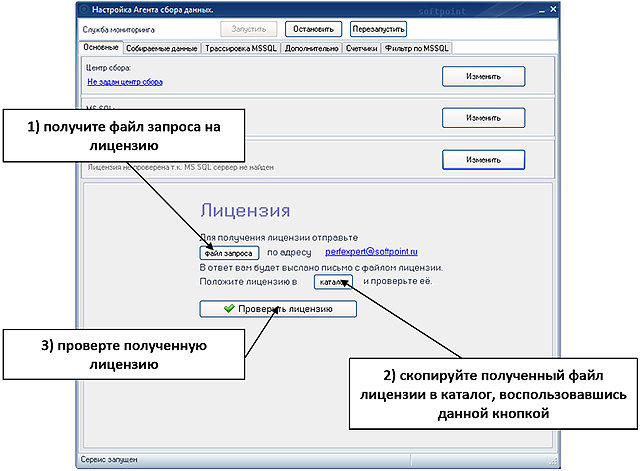
« » , PerfExpert Center.
« » OC Windows.
Windows . – ().
«» .
.
Submenu "FILE"
The main purpose of the “File” submenu is to control the operation modes of the Data Collection Center, archive and restore from monitoring archives created earlier, fast navigation.
The option “Open PerfExpert database file ...” - selects a previously recorded recorded observation file with the extension * .fdb or * .spdb .
This option is intended both for working with PERFEXPERT archive files and for situations when it is not possible to connect to the server via a local network. For example, a database file is received from a remote affiliate by email.
The option “Connect to remote Collection Center ...” creates a connection to the monitoring server. When you select it, a window will appear in which you need to specify the network name of the computer or its IP address to establish a remote connection and, if the connection is successful, ask for the user name, the access password and the port that will be used for data exchange.
After a successful connection, the option will change the name to “Disconnect from the remote Collection Center ...”, choosing which user returns to the Collection Center located on the local computer.
The “Make BackUp ...” option allows you to save the collected information of the observed database to a file (backup) and, if necessary, add a backup copy to the archive.
The monitoring system creates a new database every Monday at one o'clock in the morning, and in the name of the database file, by default, the domain name and server name are specified, as well as the date of its creation (for example, 2014-05-14-dbs.local_140512_234).
If you select this option in the window that opens, you will be asked to choose the option to save the databases and two fields will open:
- “Archived file”, i.e. base file to be archived
- “Backup File”, i.e. the BackUp file itself is the backup save path
If you need to make a backup copy of the PERFEXPERT monitoring database for the previous or the current week, then you need to select the corresponding item, and click the “Pack” button. After a while, the backup file will be ready.
If you need to make a copy of the database for a different period, or in the case of an expired license, you must act as follows:
- For example, today is August 07, 2017.
- To create a BackUp (backup) of the database for the week before last, in the “Archived file” field, select a database (this is a file with the * .spbd extension) in the name of which% 170724% is specified. July 24, 2017, Monday the week before last.
- In the field “Backup file” we indicate where to save it. Click the "Pack" button. After a while the file is ready.
- As a result of performing the procedures, two files with the same name but different extensions - * .fbk and * .7z are obtained. If the “Compress file” option is not enabled in the BackUp window, the archive file with the * .7z extension will not be created.
The “Restore BackUp ...” option is the inverse function of the “Make BackUp ...” option, which allows you to restore the collected information from the backup file from the backup file.
Recovery occurs both from the extension file * .7z, and * .fbk. The unzipped file will have the extension * .spdb.
The “Set Agent Base Directory” option allows you to set a local directory that will be used by data collection agents to create their own databases.
By default, the collection bases are located in the folder where the monitoring system was installed in the \ data subdirectory. The name of the database consists of the fully qualified domain name of the computer being monitored and has the extension * .fdb.
The “Exit” option is the completion of the PERFEXPERT program.
SUBMENU “CONNECTIONS”
The "Connections" submenu displays a list of MS SQL servers on which data collection agents are installed that are connected to the Collection Center. It is used to switch between several MS SQL servers connected and on-line that collect data in a single Collection Center.
SUBMENU “TRACKS”
In MS SQL, there are frequent situations when a particular query is slow, and there are no obvious problems in the query text. Usually in this case it is necessary to investigate the problem at a deeper level.
The PERFEXPERT software package in the course of work creates traces on the MS SQL server side, which continuously record a stack of running queries that meet the criteria for a duration of more than 5 seconds or more than 50,000 logical reads, and also collects blocking and deadlock events.
The "Trails" submenu is used to identify the bottlenecks of the information system in the context of groups of SQL queries and is designed to create and analyze trace results and identify problems encountered during query execution.
The option “Duration - SQL queries for more than 5 seconds” - allows you to display and analyze long-term SQL queries, which are the main source of information when examining the increased load on the MS SQL server computing subsystem.
As a result, a separate window will display lists of long-running queries, with the ability to view the text of the selected query, as well as to obtain statistical data on the groups of queries that create the largest total load on the server.
The “Statistics” tab allows you to group queries by their different parameters and estimate the load generated by queries, for example, in the context of databases, user terminals / sessions, query type, modules / forms / procedures of the information system. The user has the ability to both independently select the fields for which the grouping takes place, as well as use the 3 most requested grouping templates.
The option "Reads - SQL queries with the number of read operations more than 50,000" - allows you to display and analyze SQL queries that are the main source of information when examining the increased load on the disk array, problems with the MS SQL data cache of the server.
The option "Writes - SQL queries with the number of write operations over 500" - allows you to display and analyze SQL queries that load the disk system with write operations.
The option “Locks - blocking events” displays the blockings that occurred during the observation, at the SQL level and, in the first place, allows you to determine their type, duration, status and blocking resource.
The option "Dead Locks - deadlock events" - displays the deadlocks that occurred during the observation, when transactions block each other and violate the order of access to objects. Allows you to find out, if possible, the cause of deadlocks, blocking and blocking sessions, problem queries.
In the received sample, in the “Request” field you can see a notification about the deadlock that occurred, a description of the threads that were interlocked, or the interlocking graph, the full text of which can be examined in the “Request Text” tab.
If this graphic description of the tasks and resources involved in the deadlock is copied and saved to a file with the * .xdl extension, then opening it in Microsoft SQL Management Studio you can visually see the deadlock in the graphical representation.
The option “Transactions - commit and rollback of transactions” allows you to display and analyze the duration of completed and rollback of incomplete transactions. The window view of this option has a structure that is different from the majority of options in the “Routes” submenu.
The option "UserEvents - user event" - allows you to identify requests that load the server with events that are created by custom code.
The option “LogOut - completion of IP sessions” - displays forced or abnormally terminated database connections recorded during the observation time.
The “Exceptions - SQL Server Exceptions” option displays errors that occurred during the observation process, which make it impossible to continue executing SQL commands.
The option “TextMask - selection by adjustment in the TextData field” allows you to analyze all queries that contain a substring from the configurator of the Data Collection Agent in the Text mask field in the text.
The “Full trace” option allows you to enter a trace entry in the mode in which all requests are collected without prior filtering. In the settings of the full trace, you can specify the following limiting factors as the maximum trace file size and the maximum trace duration.
Enabling full tracing has a significant load on the SQL server. Therefore, it is advisable to use this option when you need to define queries that are not visible in standard routes: queries of less than 5 seconds (duration), or queries that performed less than 50 thousand logical reads (reads).
SUBMENU "SETTING"
In the "Setup" submenu , the user has the ability to customize the composition of graphs displayed in the main monitoring window, including custom SQL counters, as well as custom measurements (markers)
The option “Configure graphs” brings up a window in which you can choose the displayed color of graphs in the main monitoring window. Double-clicking on the counter, which needs to change the color, will cause the standard Windows color selection window. After the changes are made and clicking the "Apply" button, the selected settings will be applied.
Pressing the “Save as template” button allows you to return to the selected color setting of the displayed counters by pressing the “Use template” button.
The “SQL-counters” option allows you to create custom SQL-counters designed to monitor the performance of MS SQL server. When you add a SQL counter, it will automatically appear in the general list of counters after a while, which will mean that the collection of this counter is correct.
The “Marker Settings” option allows you to customize the collection and select the mode of displaying the values of the markers (custom measurements), the type of graphs displaying them, and the color settings. Each user metering will be displayed in the main window, under the main form with regular graphs, in the form of a three-zone graph.
Markers are configured in the “Marker Collecting” tab of the marker settings window.
To add a marker, you must click on the “Add” button and fill in all the necessary parameters of the marker, and then click on the “Apply” button to save the settings.
To temporarily disable markers in the “Active” field opposite to the selected measurement, the corresponding flag is removed.
If it is necessary to delete a custom metering, the marker is selected in the table to be deleted, the “Delete” button is pressed, and further, the “Apply” button is used to confirm the action.
The settings for displaying markers in the main monitoring window are made in the “Display” tab of the settings window for markers.
Submenu "STATISTICS"
In the "Statistics" submenu, the user has the ability to generate statistical information on the collected data, as well as display them in the form of reports.
The options of this submenu allow you to assess the activity of the database, its users, the workload and the efficiency of the system. The presented statistical information can be used to set up exploited programs, troubleshoot, etc., allowing you to quickly identify their bottlenecks.
Viewing statistical data and analyzing reports will allow you to timely and reliably identify the most resource-intensive SQL queries, allowing the administrator to focus on optimizing precisely those queries that most affect the database performance.
The "Server Information ..." option opens a window for viewing detailed information about the monitored database server.
The monitoring agent updates the server information daily at night. In the field, you can select a date. The left part of the window shows a tree that allows you to conveniently view the operating system settings, hardware, database settings and MS SQL server settings.
The “MS SQL Sessions” option brings up a window for calculating statistics on MS SQL sessions. The same option is called by the “Statistics” button located above the “MS SQL Sessions” panel of the main monitoring window.
Provides the ability to group loading processes by the following values:
- Database
- Module
- User
- The form
- Program
- Computer
- Day
- Request text
- Windows user
- Lock Resource
- Wait type
- Procedure
- Line of code
Using the “Filters” button, you can set the necessary restrictions on the statistics being formed.
After selecting the reflected fields, filtering parameters, period and working time and clicking the “Generate” button, the requested statistical information will be calculated and presented in the table.
In the menu, called by the right mouse button, as well as the key combination "Ctl + A" and "Ctl + C", you can select all the rows of the table of the result, respectively, or copy the selected result lines to the clipboard.
The “Charts” option brings up a window for calculating the statistics of counters on charts displayed in the main monitoring window.
Formed according to a given period and working time, the statistical data reflect the averaged, maximum and total values of the specified counters, with a breakdown by period: days, hours.
The presented table is also divided vertically into 3 parts:
- Values for the entire specified period by days of the specified period
- Values of each given day with hourly breakdown for a given period of time
- Values for the entire selected period with hourly breakdown for a given period of time
When changing the set of visible graphs, when a new statistics window is opened on the graphs, the set of counters automatically changes and corresponds to the graphs displayed in the main monitoring window.
«» MS SQL, .
, , , , .
« » , .
, , , , .
2 :
- «» , , 5 . , –
- «» , , . «» , «» — , . , — , ,
, , MS SQL .
« » , . . , .
, . « », .
, .
3 :
- ,
- , . « »
- , . , . , ,
, «» , . 5 :
- ,
- , ,
- ScanDensity . 100
- LogicalFragmentation . , 0
- ExtentFragmentation . , 0
« » , SQL-, Microsoft SQL Management Studio.
, - , - .
. , SQL- .
, , , .
, : .
« MS Studio» Microsoft SQL Management Studio.
« » . , on-line , .
, . «» – . « » – , .
:
- SQL, . SQL-,
- , , . . « », «». ,
- . .
« » , , 100 .
. « », «».
«» , .
HTML, , , MS Office, , PERFEXPERT.
« » . , .. , .
«»
PERFEXPERT . PERFEXPERT . , .
«» , Windows, .
« » , , . , :
- ( , , )
- ( )
- MS SQL ( MS SQL )
- ( MS SQL)
- ( )
- ( )
- ( MS SQL)
- ( MS SQL)
- ( )
- ( , )
- ( SQL-)
- ( )
, , .
. : «» « » .
« Windows» , , .
«» (, , ) «».
« SQL-» , SQL-, .
«»
«» , .
« MS SQL» , .
« MS SQL» , ( ) :
- . , 5 , SPID
MS SQL, «», «» .
:
- –
- –
- –
- – SQL-
- – SQL-
« 10 » 10 Windows .
, , , ( ).
« 10 » , ( ):
- (CPU)
- (PID)
«» , . « » «».
« » , 4 :
- 1
- sql – job
, , .
« » . .
, :
- –
- – *.xml
- – *.xml ,
- –
- –
- – , (.) (.) ( 67). , , , ( Drug-n-Drop)
- – , (, )
« » , PerfExpert Center.
« » OC Windows.
Windows . – ().
«»
«» .
.
PERFEXPERT
PERFEXPERT .
, , .
«» «» . , , «». «».
, .
, , HTML, , , MS Office , PERFEXPERT.
, .
, .
, , , , . , , , .
:
.
– (), . « » :
«», , .
. , .
, , , .
. , - , , . , .
.
( ) :
, « » «».
« » , . «» . «» .

.
:
, , .
«» «» . , , «». «».
, .
, , HTML, , , MS Office , PERFEXPERT.
, .
, .
, , , , . , , , .
:
- ( )
- «» ( ) . ,
- « » . « [HTML]» « [Word]»
,
.
– (), . « » :
- Windows
- Computer name
- application
«», , .
. , .
, , , .
. , - , , . , .
.
( ) :
- CPU
- RAM
- Disk subsystem
- Locks
- MS SQL
, « » «».
« » , . «» . «» .
.
:
- / 20
- 20
- / 20
- 20 ,
- 20 ,
- 20 ,
- 20 ,
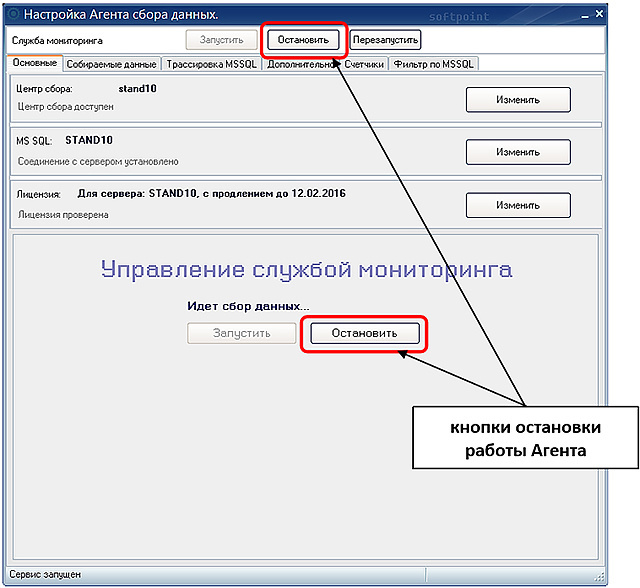
To control the situation in the system, make timely decisions, such as: quick shutdown of the system user who has created a serious load on the system and preventing other working users, or a signal to administrators about the launch of an uncontrolled process, it is necessary to track the information correctly and efficiently, maximally using all available tools provided by monitoring program.
The result of the search for problems in the system are clear conclusions about the unavailability of a resource with justifications, the selection of the most difficult list from the total number of queries to the database server, the call module and the application code line with an approximate contribution to the system load.
There are only a few typical ways to determine the presence of bottlenecks on the server, which can be used to determine the possible causes of high system load. The performance troubleshooting process involves a series of actions to localize and determine the cause of a decrease in application performance. To do this, you must first determine the source of the performance problem.
Practice shows that in most cases, the administrator can quickly identify the problem using a number of standard situation analysis algorithms.
After your server has been running for a while, it may have problems with performance degradation. The conditions in which the server operates usually change dynamically, therefore, in order to identify and then choose a method for solving the existing problems, it is necessary to collect data for some time in order to track the server status and identify bottlenecks in its functioning.
There are five potentially problematic server locations where the likelihood of problems is highest:
At the same time, server operating conditions may vary depending on the time of day. Therefore, at the beginning of the survey, it is necessary to determine the time of the collected data - all the time, a certain period, working or non-working time. To do this, in the main monitoring window in the control panel, set the filter by period and working time.
To determine the server bottlenecks, first of all, it is necessary to visually, using the ruler counters (fixed and current) to analyze the monitoring schedules taking into account the filter. If the graphs you need are not shown in the main monitoring window, click the “Graphs selection” button and adjust the graphs display.
The above server trouble spots are represented by the following types of graphs, which are studied and analyzed first:
Locks are often a bottleneck in multi-user systems.
A lock is a mechanism by which synchronized access of several users to one piece of data is synchronized.
Waiting on a lock is a situation that occurs when two users attempt to simultaneously capture the same data. In this case, one of these users is blocked, that is, must wait until the end of the first user’s transaction.
For the analysis it is necessary to use the graphs of the number of locks and the waiting time on the locks.
Unfortunately, there is no criterion by which it can be determined that locking has a significant impact on system performance. In general, the fewer locks and the shorter the wait on locks, the better.
The most dangerous in terms of performance degradation are long-term transactions, within which resources and a high level of locks were blocked.
The MSSQL Session Panel shows the lock tree. The hierarchy is represented as follows: the parent process is the one who blocks; child process - the one who is blocked. Using the lock tree, you can quickly make decisions about disabling blocking users.
After identifying potential server bottlenecks, it is necessary to analyze the statistics of the processes in the TOP 10 processes panel for additional processes that load the processor and memory — antivirus, archiving, etc.
To optimize the load, you can try to transfer part of the resource-intensive processes to another server, or to change the time of their execution.
Identification of problem areas in the operation of the information database by analyzing the results of traces and identifying problems encountered in the process of executing queries in most cases makes it possible to identify specific causes of poor performance.
It is advisable to proceed to this analysis after visual examination of graphs in the main monitoring window. Depending on the detected problems, Reads traces (if problems with disk queues or memory) or Duration (if problems with increased processor load) are being studied, the display window of which is called in the “Trails” submenu of monitoring with the same options: “Duration” ( queries), or "Reads" (number of readings).
In the analysis of the traces, the filter is set according to time and the range of working hours, depending on the analyzed area. Clicking the “Apply Filter” button will select data depending on the filter settings.
Grouping by the information system module and the line number in the Statistics tab, or applying custom filters in the Group By Fields group will form the selection required for the analysis.
Having sorted the table by column “% CPU share” , or “% reading share” , the constructions that contributed the most to the load of the central processor unit or create the most reads are determined.
It is advisable to consider only the first 3 - 8 records, the share of which does not exceed 3 - 5%.
Double clicking on the selected record allows you to see and analyze requests in the central part of the trace analysis window. Sorting out the columns "Duration" , "Readings" and "CPU time" , it is possible to identify the most "heavy" requests.
If necessary, you can switch to the Query Text tab to examine the query in detail, after selecting it in the central table part of the window.
For some information systems (1C, etc.), it is possible to match SQL queries with specific names of internal objects of the information system, which supplements standard SQL information with information about the module and the configuration code string that can be used by the IC developers to optimize them.
Creating and using user measurements (markers) in evaluating the information system allows you to estimate the time costs of specific operations or code sections for which they were previously set up and the parameters for displaying values using the "Marker settings" option in the "Settings" submenu.

The measurement results are displayed on the main monitoring window under the main form with regular graphs, in the form of a three-zone graph and specified in tabular form in the “Markers” tab of the “Additional Information” panel.
Taking into account that information about current user metering data corresponds to current time characteristics under the main line of graphs, the user can compare the measurement results with other graph values and determine the reasons for slowing down: lack of RAM, queue for disks, increased load on the central processing unit, etc. d. Fixing the values of the ruler makes it possible to study in detail the data obtained in the relevant tables.
In the example presented in Figures 83 and 84, the custom metering “Any Marker Name” is set to a value range from 1.5 to 3.0 seconds, i.e. time spent up to 1.5 seconds will be displayed in green (by default), falling within a specified period of time - yellow and exceeding 3.0 seconds - red. On the scale of markers, when hovering over the rulers through a fraction, the red / yellow / green markers (in this example: 3/4/1) are displayed respectively. When using the “Additional Information” panel located on the right in the main monitoring window (connected in the “View” submenu), the obtained values can be studied in detail.
The most common reasons for the non-optimal operation of the system are incorrect or untimely execution of routine operations at the DBMS level.
Therefore, with a sharp deterioration in performance, it is first recommended to thoroughly check the implementation of database maintenance procedures, and then proceed to analyze available software and hardware resources, application code, networks, disk arrays, etc.
In order to determine whether a database needs to improve its maintenance activities, it is necessary to analyze the status of its statistics and indexes, since, first of all, they are the basis for efficient query execution.
MS SQL Server will not be able to execute queries in a reasonable time if the databases have the following problems:
As a rule, the quality of service for indexes is monitored by tasks for rebuilding / reorganizing indexes on a schedule; however, this estimate is not always reliable, since the script may not work correctly, it may not take into account new tables and indexes.
A more accurate assessment of the degree of fragmentation of the index gives the parameter ScanDensity.
In PERFEXPERT, to determine this parameter, the index statistics window is used, which opens with the corresponding option of the Statistics submenu. Using this window, you can determine which indexes require additional maintenance, evaluate how efficiently they are maintained, and what state they are in.
Application of the described techniques is primarily advisable for tables with more than 10 thousand rows, since small tables with several hundred rows are quickly read completely, with the result that even strong fragmentation usually does not affect performance in any way.
By selecting the analyzed database in the upper part of the window, and the table in the middle, in the lower part of the window, you can analyze the degree of fragmentation of all indexes of the selected table. Enabling the "Display only the last measurement" option will allow you to view only the data with the latest poll results, disabling - examine their change.
Scan Density shows the percentage of perfect placement of pages. The closer the result to 100%, the less fragmentation. In the presented example, it is noticeable that this table is rather fragmented. Scanning constantly uses forward and backward switching from one extent to another, instead of using only the link from one page to the next within the extent.
As a rule, defragmentation of an index by its reorganization is expedient when the value of Scan Density is from 95% to 85%, restructuring - less than 85%.
Analysis of the distribution of data on the tables and on the basis of which the query optimizer determines the optimal execution plan of the query allows you to determine how much data has changed and how outdated the statistics are. This will allow you to understand the need to update statistics to equalize performance.
If the statistics are irrelevant, then an incorrect execution plan will be built for the execution of the SQL query, and accordingly the execution time of the same query may increase several times.
If, as a result of the analysis, it turned out that the speed of the execution of queries to a particular table is slowing down, then first of all it is necessary to check its statistics for the number of changes made.
In addition, such an analysis must be done if it is known in advance that a massive insertion took place in the table, or it was not served for a long time.
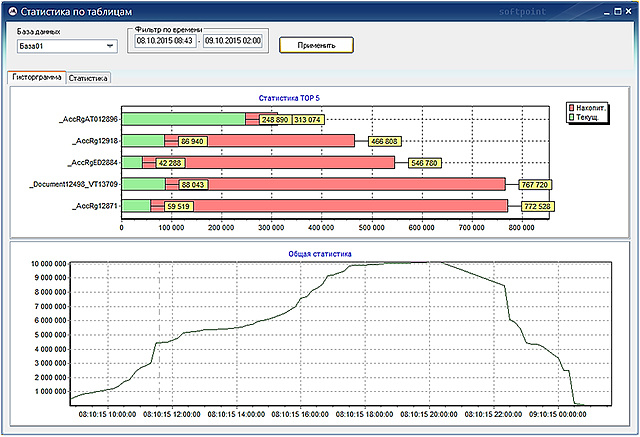
Using the "Statistics by Tables" window, you can determine how much data has changed and how outdated the statistics are. This will allow you to understand the need to update statistics to equalize performance.
The “Histogram” tab at the bottom of the window shows a graph that shows the total number of changes for all tables in the selected database. At the top of the window is a histogram of the first 5 most modified tables.
To determine the values of 5 of these tables on the chart at a certain point in time, a ruler is used - a straight vertical line that appears when the mouse cursor moves over the chart window.
At the same time, in the TOP 5 statistics, the green color shows the number of current changes at a selected point in time (changes since the last statistics survey), the red number shows the number of cumulative changes (changes since the last update of statistics on these tables).
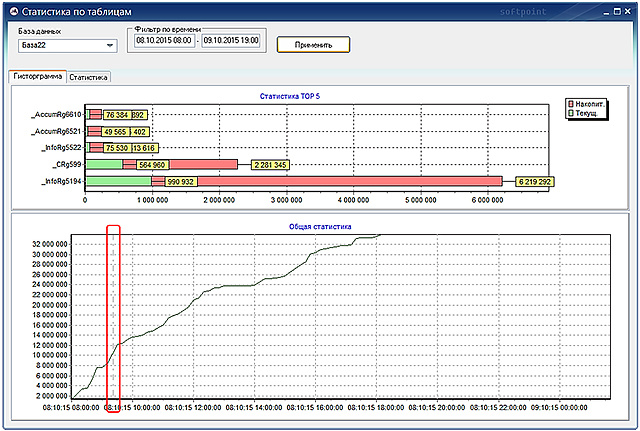
In the "Statistics" tab there is information for each table for each statistic. In the "Table" table is selected, in the "Statistics" - the statistics for which you want to track changes (see the number of changes). The statistics for indexed columns are named by the name of the corresponding index, and the statistics with names that start with WA_Sys are statistics that SQL Server automatically creates for columns that do not have an index.
In the right part there is a table where all updates are displayed since the last rebuild and a graph that dynamically shows the number of rows that have changed since the last recalculation of the statistics during the selected time period.
The table, in the corresponding columns, contains information about:
The information obtained will help in determining the rules of database maintenance.
So, if according to the results of checking the statistics, it will be established that about a million changes have accumulated, then it is advisable to make an additional recalculation of the statistics on the table being studied, since such an amount unambiguously adversely affects the decision-making process of the request handler.
Each time after updating the statistical set of the table, the counter with information on the amount of changes made over the fields from the index key or for which statistics were collected is reset.
In addition, analyzing information about tables helps to selectively determine the feasibility of updating statistics manually. As a rule, these are tables with a large number of rows, in which data changes very often.
In some cases, too frequent updating of table statistics, on the contrary, can significantly reduce database performance. Therefore, in a really working system, different tables require different statistics update frequency. The optimal frequency of updating the statistics depends on the size and nature of the load on the system and is determined experimentally.
Analyzing the collected information about the tables and correlating them with the data of the traces, you can determine which tables more often than others need to update the statistics frequently and set up several different procedural procedures: for example, for frequently updated tables and for all other tables. This approach can significantly reduce the time for updating statistics and the impact of updating statistics on the system as a whole.
The result of the search for problems in the system are clear conclusions about the unavailability of a resource with justifications, the selection of the most difficult list from the total number of queries to the database server, the call module and the application code line with an approximate contribution to the system load.
There are only a few typical ways to determine the presence of bottlenecks on the server, which can be used to determine the possible causes of high system load. The performance troubleshooting process involves a series of actions to localize and determine the cause of a decrease in application performance. To do this, you must first determine the source of the performance problem.
Practice shows that in most cases, the administrator can quickly identify the problem using a number of standard situation analysis algorithms.
USE OF STATISTICS AND ANALYSIS OF DATA GATE
After your server has been running for a while, it may have problems with performance degradation. The conditions in which the server operates usually change dynamically, therefore, in order to identify and then choose a method for solving the existing problems, it is necessary to collect data for some time in order to track the server status and identify bottlenecks in its functioning.
There are five potentially problematic server locations where the likelihood of problems is highest:
- CPU
- Memory
- Disk subsystem
- Network load
- Locks
At the same time, server operating conditions may vary depending on the time of day. Therefore, at the beginning of the survey, it is necessary to determine the time of the collected data - all the time, a certain period, working or non-working time. To do this, in the main monitoring window in the control panel, set the filter by period and working time.
To determine the server bottlenecks, first of all, it is necessary to visually, using the ruler counters (fixed and current) to analyze the monitoring schedules taking into account the filter. If the graphs you need are not shown in the main monitoring window, click the “Graphs selection” button and adjust the graphs display.
The above server trouble spots are represented by the following types of graphs, which are studied and analyzed first:
- Schedule Server: CPU Load . This graph shows the total load on the central processing unit.
If for a long time (from 10 minutes) the load on the CPU is 80-100%, then most likely you need to start analyzing information about the processes that load it.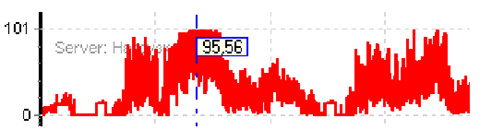
- Server Schedule : The average queue length to disk . If for a long time (from 1-2 minutes) the average queue length to the disk exceeds 4-8, it is first necessary to establish its cause. In most cases, this may be a shortage of RAM, which may be due to the execution of heavy queries or, for example, high utilization of the disk subsystem by third-party processes.

- Schedule Server: Free RAM (MB) . Potentially, memory can be a bottleneck if a long time of free RAM is less than 1 GB
- SQL graph (Name): The expected lifetime of a memory page . Memory could potentially be a bottleneck if the long life expectancy of a memory page is less than 300 s
- SQL Chart (Name): Locks, SQL (Name): Total Locking Time ...
Locks are often a bottleneck in multi-user systems.
A lock is a mechanism by which synchronized access of several users to one piece of data is synchronized.
Waiting on a lock is a situation that occurs when two users attempt to simultaneously capture the same data. In this case, one of these users is blocked, that is, must wait until the end of the first user’s transaction.
For the analysis it is necessary to use the graphs of the number of locks and the waiting time on the locks.
Unfortunately, there is no criterion by which it can be determined that locking has a significant impact on system performance. In general, the fewer locks and the shorter the wait on locks, the better.
The most dangerous in terms of performance degradation are long-term transactions, within which resources and a high level of locks were blocked.
The MSSQL Session Panel shows the lock tree. The hierarchy is represented as follows: the parent process is the one who blocks; child process - the one who is blocked. Using the lock tree, you can quickly make decisions about disabling blocking users.
After identifying potential server bottlenecks, it is necessary to analyze the statistics of the processes in the TOP 10 processes panel for additional processes that load the processor and memory — antivirus, archiving, etc.
To optimize the load, you can try to transfer part of the resource-intensive processes to another server, or to change the time of their execution.
TRASS MS SQL ANALYSIS
Identification of problem areas in the operation of the information database by analyzing the results of traces and identifying problems encountered in the process of executing queries in most cases makes it possible to identify specific causes of poor performance.
It is advisable to proceed to this analysis after visual examination of graphs in the main monitoring window. Depending on the detected problems, Reads traces (if problems with disk queues or memory) or Duration (if problems with increased processor load) are being studied, the display window of which is called in the “Trails” submenu of monitoring with the same options: “Duration” ( queries), or "Reads" (number of readings).
In the analysis of the traces, the filter is set according to time and the range of working hours, depending on the analyzed area. Clicking the “Apply Filter” button will select data depending on the filter settings.
Grouping by the information system module and the line number in the Statistics tab, or applying custom filters in the Group By Fields group will form the selection required for the analysis.
Having sorted the table by column “% CPU share” , or “% reading share” , the constructions that contributed the most to the load of the central processor unit or create the most reads are determined.
It is advisable to consider only the first 3 - 8 records, the share of which does not exceed 3 - 5%.
Double clicking on the selected record allows you to see and analyze requests in the central part of the trace analysis window. Sorting out the columns "Duration" , "Readings" and "CPU time" , it is possible to identify the most "heavy" requests.
If necessary, you can switch to the Query Text tab to examine the query in detail, after selecting it in the central table part of the window.
For some information systems (1C, etc.), it is possible to match SQL queries with specific names of internal objects of the information system, which supplements standard SQL information with information about the module and the configuration code string that can be used by the IC developers to optimize them.
USE OF USER MEASURES IN THE ANALYSIS OF PERFORMANCE
Creating and using user measurements (markers) in evaluating the information system allows you to estimate the time costs of specific operations or code sections for which they were previously set up and the parameters for displaying values using the "Marker settings" option in the "Settings" submenu.
The measurement results are displayed on the main monitoring window under the main form with regular graphs, in the form of a three-zone graph and specified in tabular form in the “Markers” tab of the “Additional Information” panel.
Taking into account that information about current user metering data corresponds to current time characteristics under the main line of graphs, the user can compare the measurement results with other graph values and determine the reasons for slowing down: lack of RAM, queue for disks, increased load on the central processing unit, etc. d. Fixing the values of the ruler makes it possible to study in detail the data obtained in the relevant tables.
In the example presented in Figures 83 and 84, the custom metering “Any Marker Name” is set to a value range from 1.5 to 3.0 seconds, i.e. time spent up to 1.5 seconds will be displayed in green (by default), falling within a specified period of time - yellow and exceeding 3.0 seconds - red. On the scale of markers, when hovering over the rulers through a fraction, the red / yellow / green markers (in this example: 3/4/1) are displayed respectively. When using the “Additional Information” panel located on the right in the main monitoring window (connected in the “View” submenu), the obtained values can be studied in detail.
USE OF STATISTICAL INFORMATION ON TABLES AND INDEXES
The most common reasons for the non-optimal operation of the system are incorrect or untimely execution of routine operations at the DBMS level.
Therefore, with a sharp deterioration in performance, it is first recommended to thoroughly check the implementation of database maintenance procedures, and then proceed to analyze available software and hardware resources, application code, networks, disk arrays, etc.
In order to determine whether a database needs to improve its maintenance activities, it is necessary to analyze the status of its statistics and indexes, since, first of all, they are the basis for efficient query execution.
MS SQL Server will not be able to execute queries in a reasonable time if the databases have the following problems:
- Indexes are becoming very fragmented.
- Some of the data on rows that once participated in an index has already been deleted, and because of this, the index takes up more disk space and requires more I / O operations when executing queries.
- Table statistics become essentially inaccurate, and it becomes clear by the server at the exact moment when it is needed.
As a rule, the quality of service for indexes is monitored by tasks for rebuilding / reorganizing indexes on a schedule; however, this estimate is not always reliable, since the script may not work correctly, it may not take into account new tables and indexes.
A more accurate assessment of the degree of fragmentation of the index gives the parameter ScanDensity.
In PERFEXPERT, to determine this parameter, the index statistics window is used, which opens with the corresponding option of the Statistics submenu. Using this window, you can determine which indexes require additional maintenance, evaluate how efficiently they are maintained, and what state they are in.
Application of the described techniques is primarily advisable for tables with more than 10 thousand rows, since small tables with several hundred rows are quickly read completely, with the result that even strong fragmentation usually does not affect performance in any way.
By selecting the analyzed database in the upper part of the window, and the table in the middle, in the lower part of the window, you can analyze the degree of fragmentation of all indexes of the selected table. Enabling the "Display only the last measurement" option will allow you to view only the data with the latest poll results, disabling - examine their change.
Scan Density shows the percentage of perfect placement of pages. The closer the result to 100%, the less fragmentation. In the presented example, it is noticeable that this table is rather fragmented. Scanning constantly uses forward and backward switching from one extent to another, instead of using only the link from one page to the next within the extent.
As a rule, defragmentation of an index by its reorganization is expedient when the value of Scan Density is from 95% to 85%, restructuring - less than 85%.
Analysis of the distribution of data on the tables and on the basis of which the query optimizer determines the optimal execution plan of the query allows you to determine how much data has changed and how outdated the statistics are. This will allow you to understand the need to update statistics to equalize performance.
If the statistics are irrelevant, then an incorrect execution plan will be built for the execution of the SQL query, and accordingly the execution time of the same query may increase several times.
If, as a result of the analysis, it turned out that the speed of the execution of queries to a particular table is slowing down, then first of all it is necessary to check its statistics for the number of changes made.
In addition, such an analysis must be done if it is known in advance that a massive insertion took place in the table, or it was not served for a long time.
Using the "Statistics by Tables" window, you can determine how much data has changed and how outdated the statistics are. This will allow you to understand the need to update statistics to equalize performance.
The “Histogram” tab at the bottom of the window shows a graph that shows the total number of changes for all tables in the selected database. At the top of the window is a histogram of the first 5 most modified tables.
To determine the values of 5 of these tables on the chart at a certain point in time, a ruler is used - a straight vertical line that appears when the mouse cursor moves over the chart window.
At the same time, in the TOP 5 statistics, the green color shows the number of current changes at a selected point in time (changes since the last statistics survey), the red number shows the number of cumulative changes (changes since the last update of statistics on these tables).
In the "Statistics" tab there is information for each table for each statistic. In the "Table" table is selected, in the "Statistics" - the statistics for which you want to track changes (see the number of changes). The statistics for indexed columns are named by the name of the corresponding index, and the statistics with names that start with WA_Sys are statistics that SQL Server automatically creates for columns that do not have an index.
In the right part there is a table where all updates are displayed since the last rebuild and a graph that dynamically shows the number of rows that have changed since the last recalculation of the statistics during the selected time period.
The table, in the corresponding columns, contains information about:
- Naming statistics for indexed columns
- Last recalculation time
- The number of changes since the last statistics recalculation
- The number of changes in the last 10 minutes
- Date and time of measurement
The information obtained will help in determining the rules of database maintenance.
So, if according to the results of checking the statistics, it will be established that about a million changes have accumulated, then it is advisable to make an additional recalculation of the statistics on the table being studied, since such an amount unambiguously adversely affects the decision-making process of the request handler.
Each time after updating the statistical set of the table, the counter with information on the amount of changes made over the fields from the index key or for which statistics were collected is reset.
In addition, analyzing information about tables helps to selectively determine the feasibility of updating statistics manually. As a rule, these are tables with a large number of rows, in which data changes very often.
In some cases, too frequent updating of table statistics, on the contrary, can significantly reduce database performance. Therefore, in a really working system, different tables require different statistics update frequency. The optimal frequency of updating the statistics depends on the size and nature of the load on the system and is determined experimentally.
Analyzing the collected information about the tables and correlating them with the data of the traces, you can determine which tables more often than others need to update the statistics frequently and set up several different procedural procedures: for example, for frequently updated tables and for all other tables. This approach can significantly reduce the time for updating statistics and the impact of updating statistics on the system as a whole.
Software monitoring options used only with 1C platforms
PERFEXPERT 1: , 1: ( ) (1 ), .
PERFEXPERT - «1» 1: .

1.
1: 8.1 , , .
MS SQL Server. . 1 , .
( , ).
« » «» 1 .
« ( )» «» 1 .
« » «» , .
1: « » :
() 1 10 .
« » 1 , .
1 , , , . , .
, .
« 1» , , , rphost.
. rphost ( ) . rphost , 1.
, , , , , rphost, .
PERFEXPERT 1: 8. .
« » «» 1, .
« » «».
«» «» .
, ( ).
, , :
PERFEXPERT - «1» 1: .
1.
, 1
1: 8.1 , , .
MS SQL Server. . 1 , .
( , ).
« » «» 1 .
« ( )» «» 1 .
« » «» , .
1: « » :
- – 1, .
- 1 – rphost 1 .
() 1 10 .
« » 1 , .
1 , , , . , .
, .
« 1» , , , rphost.
. rphost ( ) . rphost , 1.
, , , , , rphost, .
PERFEXPERT 1: 8. .
« » «» 1, .
« » «».
«» «» .
, ( ).
, , :
- ,
- , : , , , ,
- (), : , , , ,
- (), : , , , ,
- ( ), : , , , , ,
- ( ), : , (), , ,
/ PERFEXPERT 3.0
, .
PERFEXPERT 3.0 :
( ), .
. – . 1 5 .
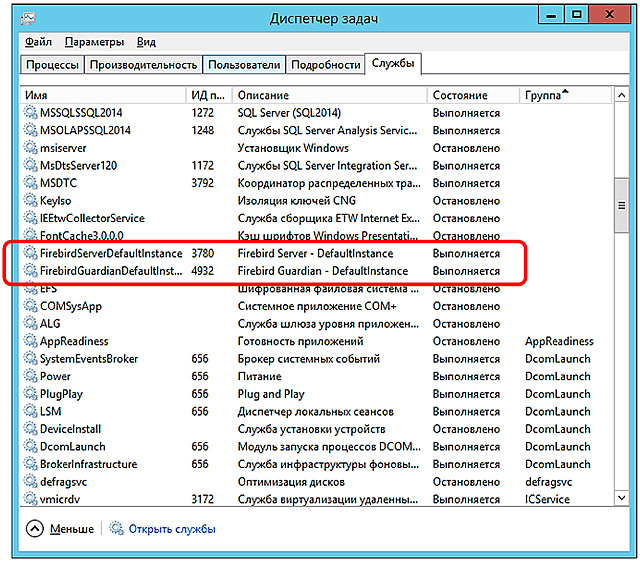
, , : FirebirdServer – , . , .
PerfExpertCenterSetup , .
(), .
. MS SQL . – , ( , ).
PerfAgentSetup, , MS SQL , .
.
Windows . .
, , CounterService, .
, .
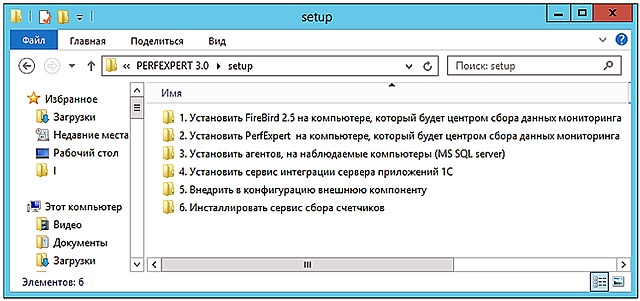
PERFEXPERT 3.0, 6 , ( – ):
:
:
:
:
Firebird, , .
Firebird Server 2.5 , . «1. FireBird 2.5 , » Firebird-2.5.. win32.exe Firebird-2.5.._x64. (32- 64- ) , Firebird.
Firebird Server « SuperServer» «», , :

Windows «Firebird Guardian» «Firebird Server». , .
, PerfExpertCenterSetup_3.0...exe 2. PerfExpert , » .
, MS SQL , .
, , 3. PerfAgentSetup_3.0...exe.
, , Softpoint PerfExpert Agent .
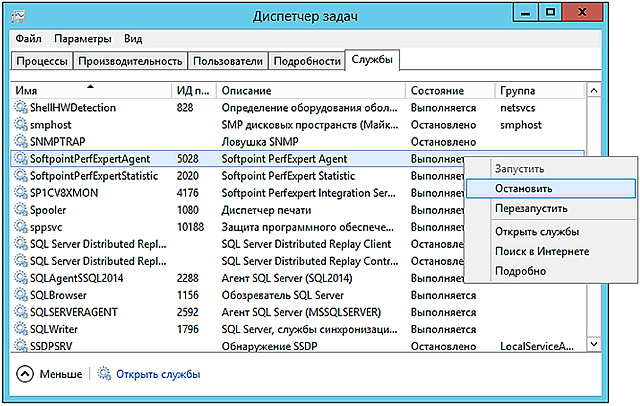
Softpoint PerfExpert Agent ,
, , « » . . « » .
, , .
, , 6 CounterService_1.0...exe.
.
MS SQL, .
PERFEXPERT :
:
FireBird :
:
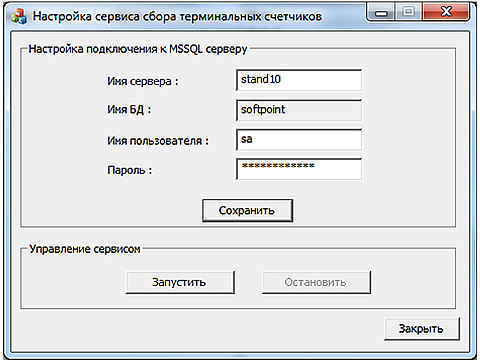
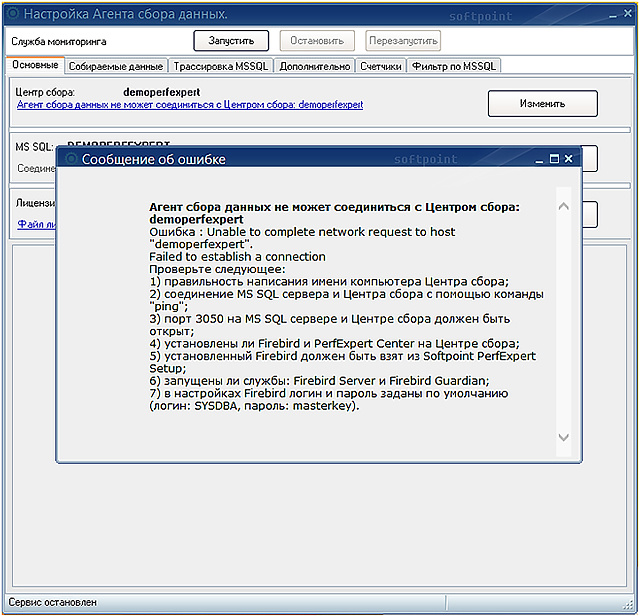
SOFTPOINT , MS SQL, .
SOFTPOINT MS SQL : SQL Server Management Studio, Transact-SQL ..

:
PERFEXPERT MS SQL .
Start () -> All programs ( ) -> PerfExpert -> PerfAgent -> .
.
« » , FireBird, , .
.
MS SQL . «» ( MS SQL).
SQL:
MS SQL «».
«» () :
MS SQL , « » .
, . MS SQL «» ( ) . , , , .
: Start () -> All programs ( ) -> PerfExpert -> PerfAgent -> .
, . Start () -> All programs ( ) -> PerfExpert -> ControlCenter -> .
, « » , MSSQL.
, , , .
: Start () -> All programs ( ) -> PerfExpert -> PerfAgent -> .
, . « » .
« » , , – , , . .
« MS SQL» .
, « » , .
«» Firebird, , .
«» , , .
« MS SQL» MS SQL. MS SQL, .
, - DocsVision Microsoft Dynamics AX «» MS SQL , , «»

DocsVision Microsoft Dynamics AX «»
PERFEXPERT - «1» 1: . , , , , 1.
1, PERFEXPERT. 1.
1 1, , Windows .
1 IntegrationService.
, , . 1, 1.
1 8.x, IntegrationService_3.0...exe 4 .
:
:
1 8 ( ) , 1.
. , !
, 1 PERFEXPERT ( 5) 1 . , 1, , , \v0.\debug ( – ) .
1 . ( , ) , .
«debug» , .
, , , , , PERFEXPERT . , «DebugView» ( technet.microsoft.com/en-us/sysinternals/bb896647 ) 1 . « ».
, , .
«()» «();»
, .
.
, . , .
, : Start () -> All programs ( ) -> PerfExpert -> Integration Service -> ». .
:
1, .
, 1 , 1 . «» .
, , «» «» . «1C_version» «1C_path», 1.
4 : «», «», «», «» .
«» . .
, . .
«» , :
MS SQL «» « » «» .
« » « » « »
«» . 1 , « ».
« 1» «» 1.
1, . , . , 1, .
« Softpoint Data Claster» «» «SOFTPOINT DATA CLUSTER» MS SQL , .
SQL 1 .
«» , , : , 1 ,
«» :

, , « » .
« » « » «».
, .
«\AppService\plugins» «%Program Files (x86)%\Softpoint\PerfExpert\AppService\plugins\» .
, :
1 .
\SoftPointPerfExpert, 1. 1 .
1 [\] mon .
mon , .
 m
m
«» 1:

, 1 «».
2 – «»
:
SPMRK_native.zip .
« » :
1 :
To implement the code of markers in the 1C configuration Thin client through the layout of the 1C configuration it is necessary:
In order to customize the collection and select the mode of displaying the values of the markers (user measurements), the type of graphs displaying them and the color settings, the option Marker Settings is selected in the Settings submenu of the main monitoring window.
The settings of the markers are made in the “Marker collection” tab of the marker settings window.
To add a marker, you must click on the “Add” button and fill in all the necessary parameters of the marker, and then click on the “Apply” button to save the settings. After that, the configuration of the markers will be completed.
The marker is edited by changing the parameters in the corresponding fields of the table.
To temporarily disable markers in the “Active” field opposite to the selected measurement, the corresponding flag is removed.
If it is necessary to delete a custom metering, the marker is selected in the table to be deleted, the “Delete” button is pressed and then the “Apply” button is used to confirm the action.
The settings for displaying markers (colors) in the main monitoring window are made in the “Display” tab of the marker settings window.

If the markers are correctly configured, each user metering will be displayed in the main window in color-image form, under the main form with regular graphs, in the form of a three-zone graph.
The parameters of the markers set in the settings, when the corresponding panel is turned on in the main monitoring window, allow you to visually determine “good”, “bad”, “excellent” online by the duration of the operation per unit of time.
Depending on the set value range, the time costs up to the minimum duration will be displayed in green (by default), falling within a specified time interval — yellow and exceeding the maximum duration — red. On the scale of the markers, when hovering over the rulers through a fraction, the red / yellow / green markers respectively are displayed.
PERFEXPERT
, .
PERFEXPERT 3.0 :
- – ,
- – MS SQL
- –
( ), .
– (24 ) MS SQL .
. – . 1 5 .
, , : FirebirdServer – , . , .
PerfExpertCenterSetup , .
, – 2 .
(), .
. MS SQL . – , ( , ).
PerfAgentSetup, , MS SQL , .
.
( )
Windows . .
, , CounterService, .
PERFEXPERT
, .
PERFEXPERT 3.0, 6 , ( – ):
- Firebird-2.5.. win32.exe Firebird2.5.._x64.
- PerfExpertCenterSetup_3.0...exe
- PerfAgentSetup_3.0...exe
- IntegrationService_3.0...exe
- 1 1
- CounterService_1.0...exe readme.txt
, , , WEB-
:
- MS Windows Server 2003 SP2
- MS SQL Server 2000
:
- CPU 4
- RAM 16
- Ethernet 100 /
:
- MS Windows Server 2003 SP2
- MS Windows SP3
:
- CPU 2 , 1
- RAM 2
- HDD 50 PERFEXPERT
PERFEXPERT
Firebird, , .
PERFEXPERT .
FIREBIRD SERVER
Firebird Server 2.5 , . «1. FireBird 2.5 , » Firebird-2.5.. win32.exe Firebird-2.5.._x64. (32- 64- ) , Firebird.
Firebird Server « SuperServer» «», , :
- Guardian
- Firebird
- Firebird system
- GDS32.DLL
, Firebird Server , . Firebird windows\system32 gds32.dll fbclient.dll ( ). , Firebird Server , .
Windows «Firebird Guardian» «Firebird Server». , .
, PerfExpertCenterSetup_3.0...exe 2. PerfExpert , » .
, MS SQL , .
, , 3. PerfAgentSetup_3.0...exe.
, , Softpoint PerfExpert Agent .
Softpoint PerfExpert Agent ,
, , « » . . « » .
, , .
, , 6 CounterService_1.0...exe.
MS SQL 1.
.
MS SQL, .
PERFEXPERT
PERFEXPERT :
- .
- «PerfExpert Center»
- «FireBird»
- «SOFTPOINT» MS SQL
- ( 1. « 1»)
- 1
:
- : Start () -> All programs ( ) -> PerfExpert -> Control Center -> . «»
- «»
- , , "%Program files%\Softpoint\PerfExpert\Control Center"
FIREBIRD SERVER
FireBird :
- : Start () -> All programs ( ) -> Firebird 2.5 (win32 64, ) -> Uninstall Firebird. «»
- «»
- , Firebird Server, "%Program Files%\Firebird\Firebird_2_5"
, FireBird , . , FireBird . .
:
- «» Start () -> All programs ( ) -> PerfExpert
-> PerfAgent -> - , , ,
- : Start () -> All programs ( ) -> PerfExpert -> PerfAgent -> . «»
- «»
- , , "%Program files%\Softpoint\PerfExpert\PerfAgent"
SOFTPOINT
SOFTPOINT , MS SQL, .
SOFTPOINT MS SQL : SQL Server Management Studio, Transact-SQL ..
SOFTPOINT , « ». , , .
:
- Start () -> All programs ( ) -> PerfExpert -> Counter Service ->
- ,
- : Start () -> All programs ( ) -> PerfExpert -> Counter Service -> . «»
- «»
- , , "%Program files%\Softpoint\PerfExpert\ Counter Service"
PERFEXPERT MS SQL .
MS SQL .
Start () -> All programs ( ) -> PerfExpert -> PerfAgent -> .
, ( \ )
.
« » , FireBird, , .
.
, . , :
MS SQL . «» ( MS SQL).
SQL:
- MS SQL. , SQL , (, softpoint11\Sql2005)
- , MS SQL Server. SOFTPOINT, MS SQL,
SOFTPOINT , , .
MS SQL «».
«» () :
- « »
- « »
MS SQL , « » .
« » .
, . MS SQL «» ( ) . , , , .
- , , «»
: Start () -> All programs ( ) -> PerfExpert -> PerfAgent -> .
, . Start () -> All programs ( ) -> PerfExpert -> ControlCenter -> .
1 , .
, « » , MSSQL.
, , , .
: Start () -> All programs ( ) -> PerfExpert -> PerfAgent -> .
, . « » .
« » , , – , , . .
« MS SQL» .
, « » , .
«» Firebird, , .
Firebird, .
«» , , .
« MS SQL» MS SQL. MS SQL, .
DOCSVISION MICROSOFT DYNAMICS AX
, - DocsVision Microsoft Dynamics AX «» MS SQL , , «»
DocsVision Microsoft Dynamics AX «»
, PERFEXPERT Microsoft Dynamics AX, Dynamics AX 2009 .
1
PERFEXPERT - «1» 1: . , , , , 1.
1, PERFEXPERT. 1.
1 ( 8.X)
1 1, , Windows .
1 8.x. 1.
1 IntegrationService.
, , . 1, 1.
1-, .
1: 8. : COM- 12900 , , , .
1 8.x, IntegrationService_3.0...exe 4 .
:
- , , «»,
- «», , , « 1»
:
- «» Start () -> All programs ( ) -> PerfExpert -> Integration Service ->
- «» , «» ,
- : Start () -> All programs ( ) -> PerfExpert -> Integration Service -> . «»
- «»
- , , "%Program files%\Softpoint\PerfExpert\AppService"
1
1 8 ( ) , 1.
1 7.7 8. ( ) .
. , !
, 1 PERFEXPERT ( 5) 1 . , 1, , , \v0.\debug ( – ) .
1 . ( , ) , .
1 . . 1 .
«debug» , .
, , , , , PERFEXPERT . , «DebugView» ( technet.microsoft.com/en-us/sysinternals/bb896647 ) 1 . « ».
, , .
«()» «();»
, .
.
, . , .
, , .. 1. , .
1 ( 8.X)
, : Start () -> All programs ( ) -> PerfExpert -> Integration Service -> ». .
:
- MS SQL
- 1 ( )
- 1,
1, .
, 1 , 1 . «» .
, , «» «» . «1C_version» «1C_path», 1.
4 : «», «», «», «» .
«» . .
, . .
«» , :
- MS SQL
- 1
MS SQL «» « » «» .
« » « » « »
«» . 1 , « ».
« 1» «» 1.
1, . , . , 1, .
« Softpoint Data Claster» «» «SOFTPOINT DATA CLUSTER» MS SQL , .
SQL 1 .
SOFTPOINT DATA CLUSTER « », . SOFTPOINT DATA CLUSTER.
«» , , : , 1 ,
«» :
- MSSQL
, , « » .
«» «» , . «».
« » « » «».
, .
«\AppService\plugins» «%Program Files (x86)%\Softpoint\PerfExpert\AppService\plugins\» .
, :
- plugin_sfp_process.dll – Windows ( )
- plugin_win32EventCollector.dll – Windows ( )
- plugin_lgf_parser.dll –
- plugin_v8vk_emplace.dll – 1
1 .
1 « »
\SoftPointPerfExpert, 1. 1 .
1 [\] mon .
mon , .
, «mon. StartCounter» «mon.StopCounter» .
m«» 1:
, 1 «».
2 – «»
1 « »
:
- AddIn_IEWindows_x86.cab
- MANIFEST.XML
- SPMRKAddInNative_1.dll
- SPMRKAddInNative_1_x64.dll
SPMRK_native.zip .
« » :
- 1
( ), . , 32- 1.
1 :
- 1 -> . :
- ( )
- :
() = " "; TestVK = ; ("\\___\SPMRKAddInNative_1.dll", "", .Native) TestVK = ("AddIn..SpMrkExt_1"); TestVK.Initialize("SQL", "", (), "", 12900) = " : " + TestVK.GetLastError(); ; = " "; ; = " 1 : " + (); ; TestVK;- In Connect an External Component, specify the path to the network resource where the marker component is located ( “path_to_component_marker” )
- In the TestVK.Initialize code ("SQLServerName", "DBName", UserName (), "ServerServiceIntegration", 12900) :
- the first parameter ( "SQLServerName" ) specifies the name of the SQL server
- second parameter ( "Name of the DB" ) - the name of the database
- the fourth parameter ( “ServerServiceIntegration” ) is the name of the computer running the integration service to which the thin client will connect
- In the 1C configurator, a module is created in General -> General modules . Module Name: Module Markers
- The properties of the module checkboxes "Server" and "Client (managed application)"
- The following code is inserted into the module:
() = ""; TestVK = .(); TestVK = (": . " + ); ; () = ""; TestVK = .(); TestVK = (": . " + ); ; TestVK.BeginMark() (" BeginMark: " + TestVK.GetLastError()); ; () = ""; TestVK = .(); TestVK = (": . " + ); ; TestVK.EndMark() ( " EndMark: " + TestVK.GetLastError() ); ; - The following code is inserted in the managed application module:
() .();
For example:() .("mark1"); .(); .("mark2"); .();
Connection via 1C configuration layout
The way of implementing markers through the layout of the configuration works only with a 32-bit 1C server.
To implement the code of markers in the 1C configuration Thin client through the layout of the 1C configuration it is necessary:
- In the 1C configurator, a module is created in General -> General modules. Module Name: Marker Component
- In the properties of the module: checkboxes “Server” and “Server call” are checked and the option “for the duration of the session” is selected in “Reuse of return values”
- The following code is inserted into the module, in which you need to configure the load type of the external component and the connection to the integration service:
() = " "; TestVK = ; (".", "", .Native) TestVK = ("AddIn..SpMrkExt_1"); TestVK.Initialize("SQL", "", (), "", 12900) = " : " + TestVK.GetLastError(); ; = " "; ; = " 1 : " + (); ; TestVK;- In the configurator, the layout is added to General -> General Packages. In the opened dialog, “Binary data” is selected, and in the “Download from file” file is selected SPMRK_native.zip . The name of the layout is indicated as “LayoutMarkers”
- In the TestVK.Initialize code ("SQLServerName", "DBName", UserName (), "ServerServiceIntegration", 12900) :
- the first parameter ( "SQLServerName" ) specifies the name of the SQL server
- second parameter ( "Name of the DB" ) - the name of the database
- the fourth parameter ( “ServerServiceIntegration” ) is the name of the computer running the integration service to which the thin client will connect
- In the 1C configurator, a module is created in General -> General modules. Module Name: Module Markers
- In the properties of the module, check boxes "Server" and "Server call"
- The following code is inserted into the module:
() = ""; TestVK = .(); TestVK = (": . " + ); ; () = ""; TestVK = .(); TestVK = (": . " + ); ; TestVK.BeginMark() (" BeginMark: " + TestVK.GetLastError()); ; () = ""; TestVK = .(); TestVK = (": . " + ); ; TestVK.EndMark() ( " EndMark: " + TestVK.GetLastError() ); ; - The following code is inserted in the managed application module:
() .();
For example:() .("mark1"); .(); .("mark2"); .();
The names of the markers are set on the basis of the markers registered through the settings in the Settings menu of the main monitoring window.
SETTING MARKERS DISPLAY
In order to customize the collection and select the mode of displaying the values of the markers (user measurements), the type of graphs displaying them and the color settings, the option Marker Settings is selected in the Settings submenu of the main monitoring window.
The settings of the markers are made in the “Marker collection” tab of the marker settings window.
The “Collecting markers” tab is active only in the on-line mode, at which information is collected. In offline mode, when viewing recorded data, this tab is not displayed in the settings window.
To add a marker, you must click on the “Add” button and fill in all the necessary parameters of the marker, and then click on the “Apply” button to save the settings. After that, the configuration of the markers will be completed.
The names of the markers must match the names specified in the configuration when adding their support.
The marker is edited by changing the parameters in the corresponding fields of the table.
To temporarily disable markers in the “Active” field opposite to the selected measurement, the corresponding flag is removed.
If it is necessary to delete a custom metering, the marker is selected in the table to be deleted, the “Delete” button is pressed and then the “Apply” button is used to confirm the action.
The settings for displaying markers (colors) in the main monitoring window are made in the “Display” tab of the marker settings window.
If the markers are correctly configured, each user metering will be displayed in the main window in color-image form, under the main form with regular graphs, in the form of a three-zone graph.
The parameters of the markers set in the settings, when the corresponding panel is turned on in the main monitoring window, allow you to visually determine “good”, “bad”, “excellent” online by the duration of the operation per unit of time.
Depending on the set value range, the time costs up to the minimum duration will be displayed in green (by default), falling within a specified time interval — yellow and exceeding the maximum duration — red. On the scale of the markers, when hovering over the rulers through a fraction, the red / yellow / green markers respectively are displayed.
Conclusion
The monitoring and diagnostic system of the PERFEXPERT DBMS makes it possible to estimate the load on all the servers of the system at a single moment in time. The ability to see the situation simultaneously from different subsystems (for example, 1C and SQL) helps to identify locks and other cases that adversely affect the performance of the entire system.
The procedure for conducting free testing
To participate in the PERFEXPERT testing campaign, you need to do the following in your infrastructure:
- Download the application form and fill it in.
- Send the application form to the address 1@stss.ru with the subject of the letter “HABR - PERFEXPERT TESTING”
- Wait for a call / letter specialist
- Get actual PERFEXPERT distribution for your situation
- Using this article or the manuals sent, proceed with installation and testing.
- After testing, you can switch to a commercial version of the software.
Thank you for your attention, waiting for your comments!
Source: https://habr.com/ru/post/334638/
All Articles