Report of the Information Security Monitoring Center for the II quarter of 2017
In the report, we collected summary statistics on information security events and incidents recorded by our corporate Monitoring Center recorded in the second quarter of 2017.
For three months, sensors recorded and analyzed 254,453,172 information security events and identified 144 incidents.
In the previous quarter of 2017, the Monitoring Center recorded 137,873,416 IS events and 98 incidents .
')
In the period from April 1 to June 30, 2017, employees of the Monitoring Center monitored the information systems of several organizations with a total number of connected nodes of about 15,500 (workstations, web, mail, file storages, VPN, etc.).
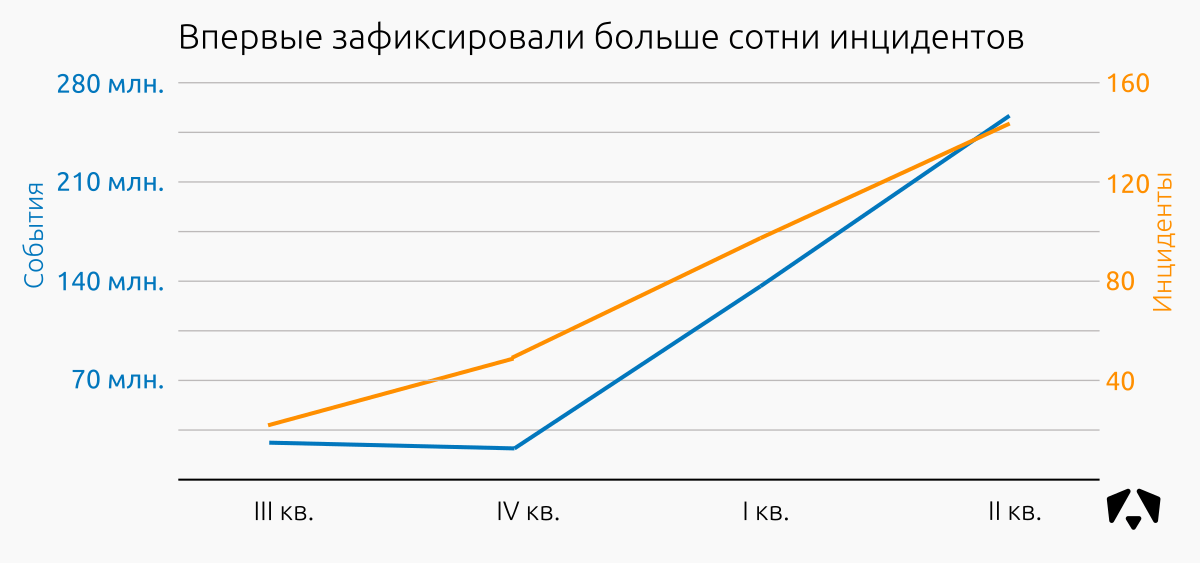
We see a significant increase in the number of recorded events (+ 85%) and incidents (+ 47%). At the same time, the number of nodes on the monitoring grew more slowly, the increase for the II quarter. 2017 was about 30%.
As will be seen in one of the graphs below, the number of attempts to exploit vulnerabilities has greatly increased (for example, EternalBlue used in the ransomware attacks of WannaCry and Petya ).
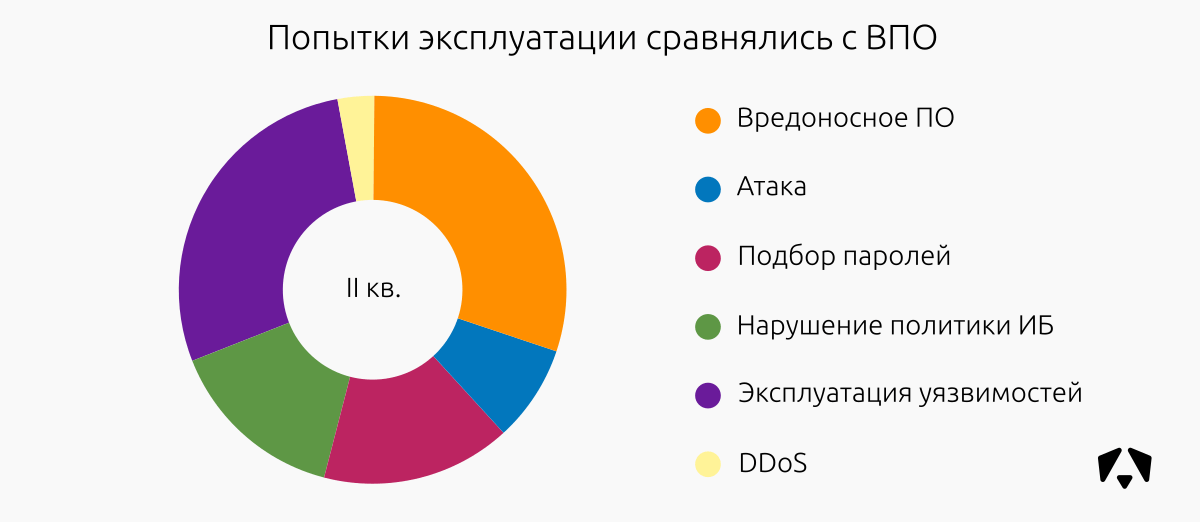
Among the 144 incidents identified:
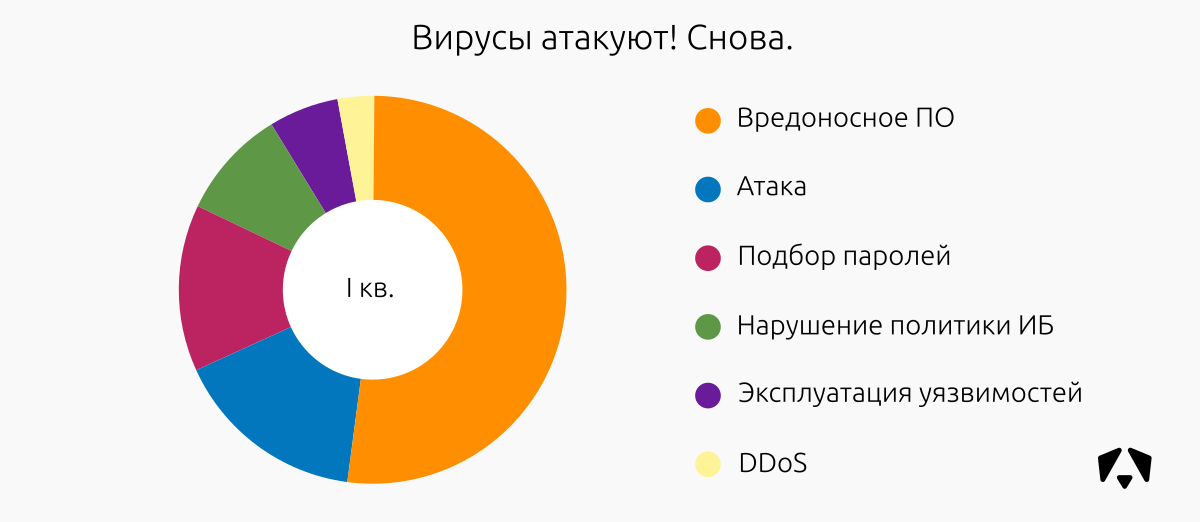
In I quarter. In 2017, the situation was a bit different:
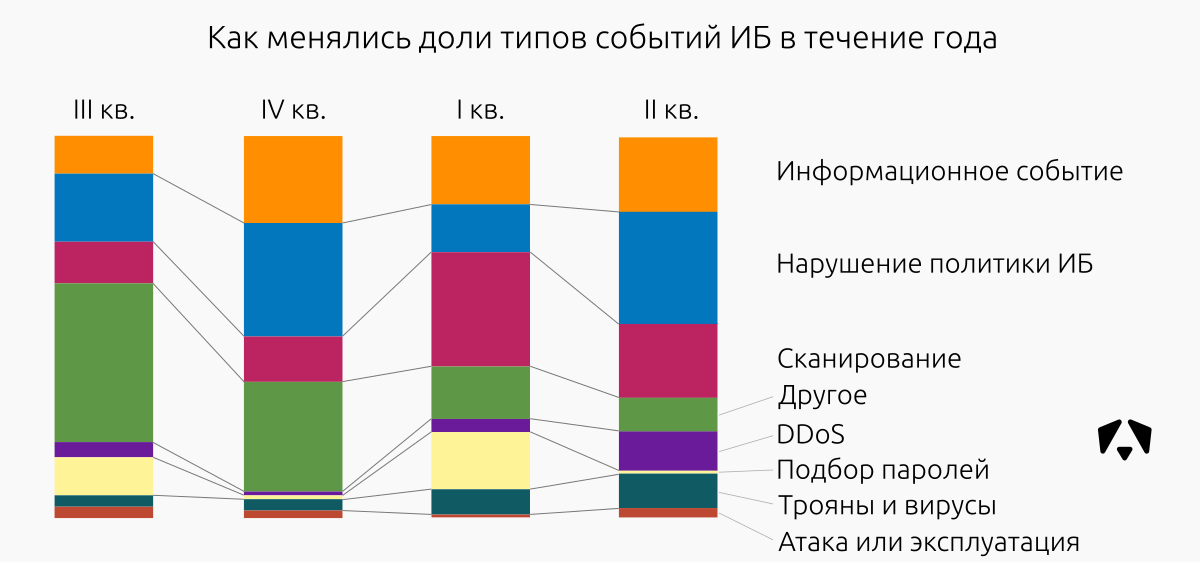
The ratio of types of reported IS incidents during the year changed as follows:
The recent publication of vulnerabilities discovered by foreign government agencies and their exploits did not go unnoticed in our Monitoring Center. We saw a distinct increase in attempts at exploitation. Fortunately, by the time of the large-scale attacks, we had already written signatures for network defenses and “caught” these attacks at an early stage, so we managed to avoid most of the VERY serious consequences.
In the first quarter of 2017, we saw attempts by some employees of organizations connected to the Monitoring Center to mine cryptocurrencies on corporate IT resources. Unfortunately, the high rate of bitcoin and ethereum provokes to continue to try to do it. Such incidents fell into the "Violation of the policy."
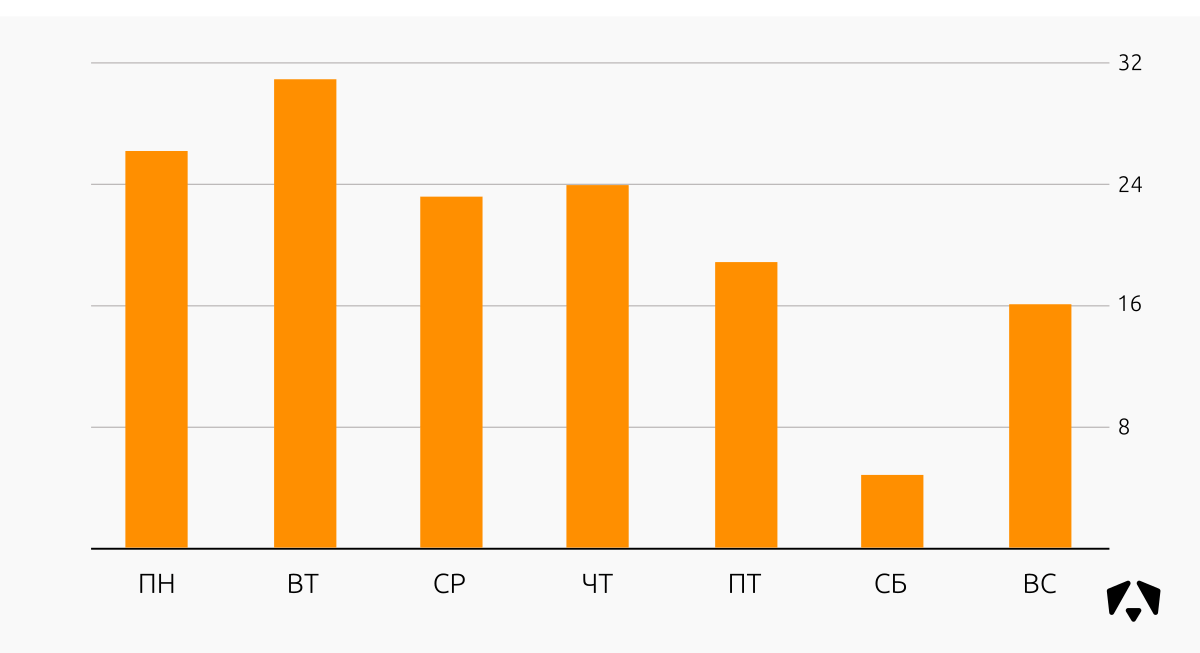
Distribution of information security incidents relative to the days of the week in Q2 2017:
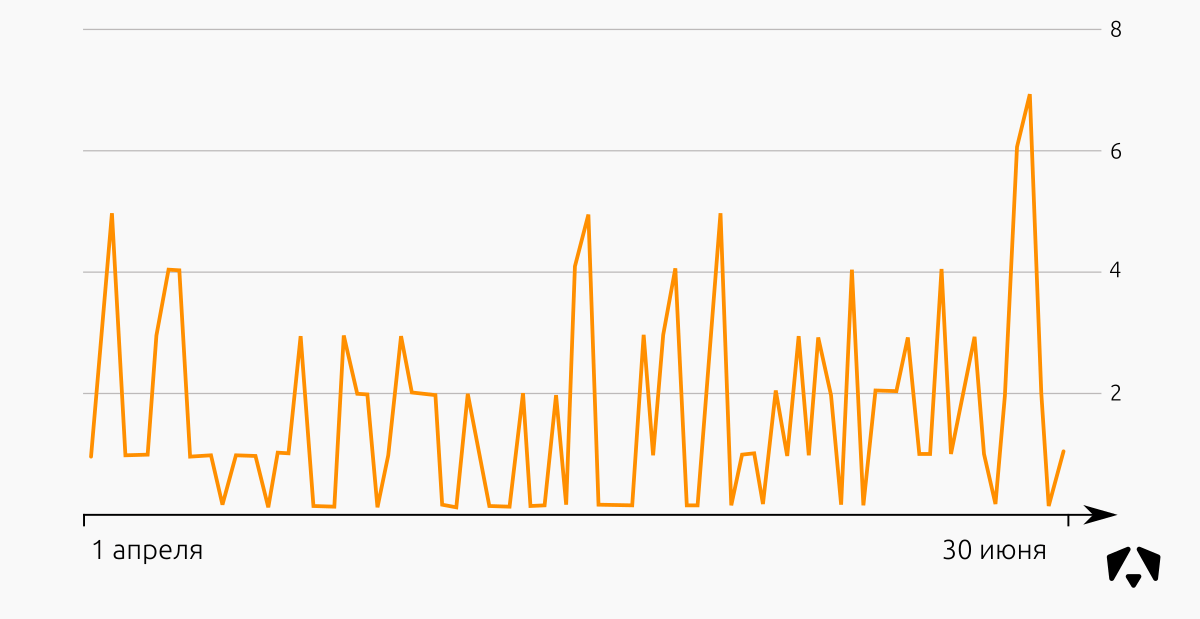
Distribution of information security incidents in the second quarter of 2017:
This time we observe a fairly even picture, without sharp peaks.
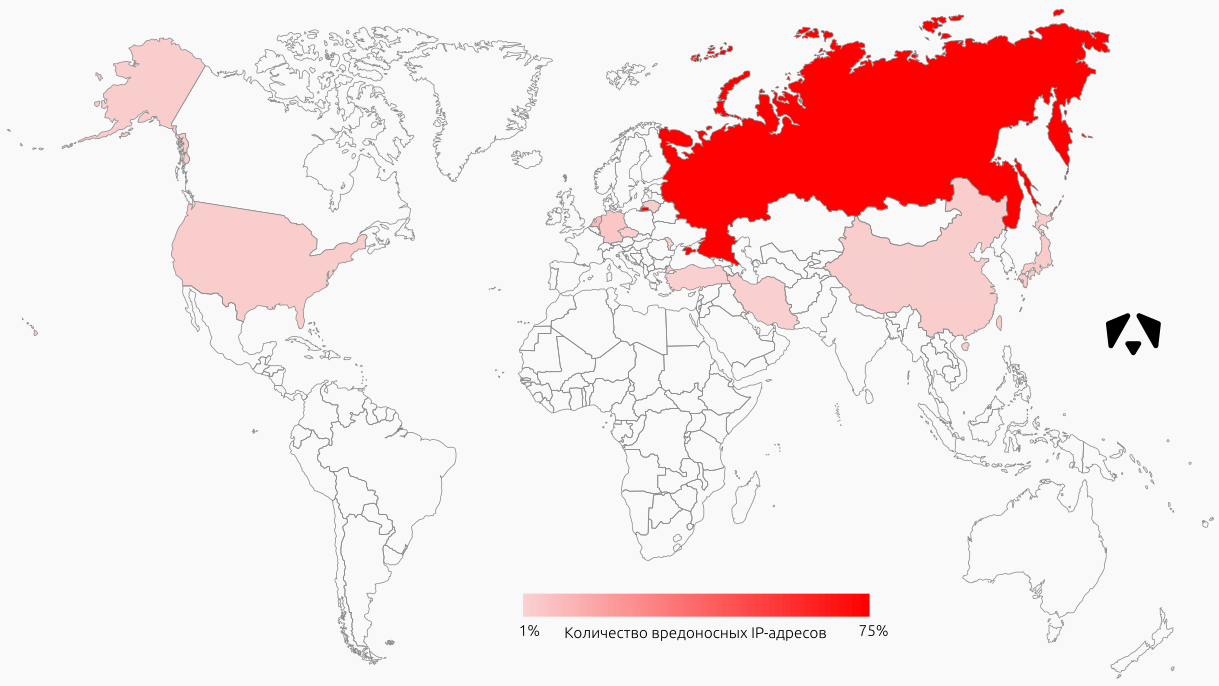
The sources of attacks in this case are IP-addresses that were participants in the network interaction with controlled addresses.
The graph shows the location of the first hundred IP addresses by the number of registered events. Most of these addresses are located in Russia, the Netherlands and Germany, although, of course, it cannot be argued that the attackers were from these countries.
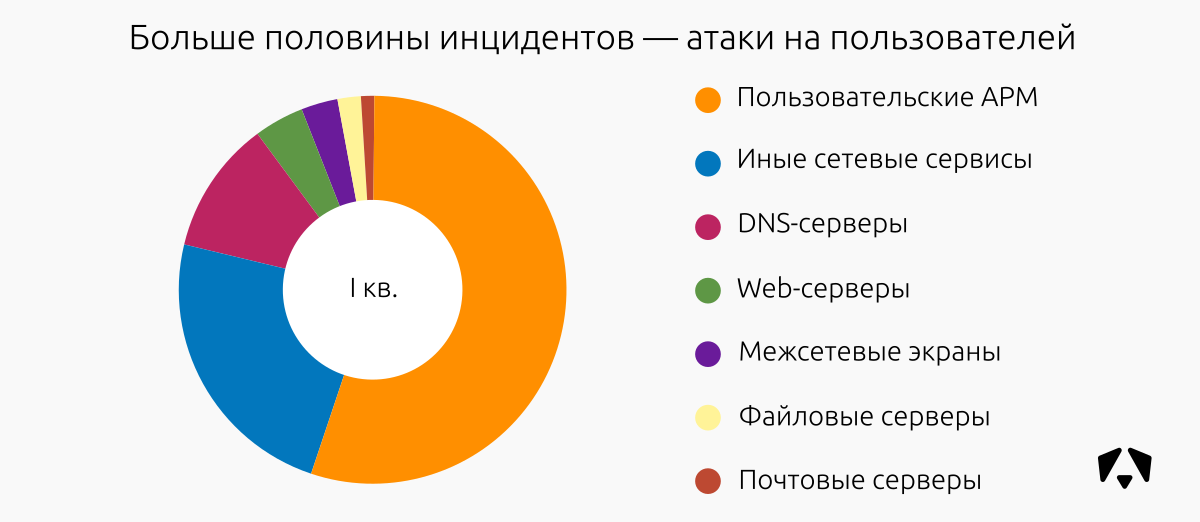
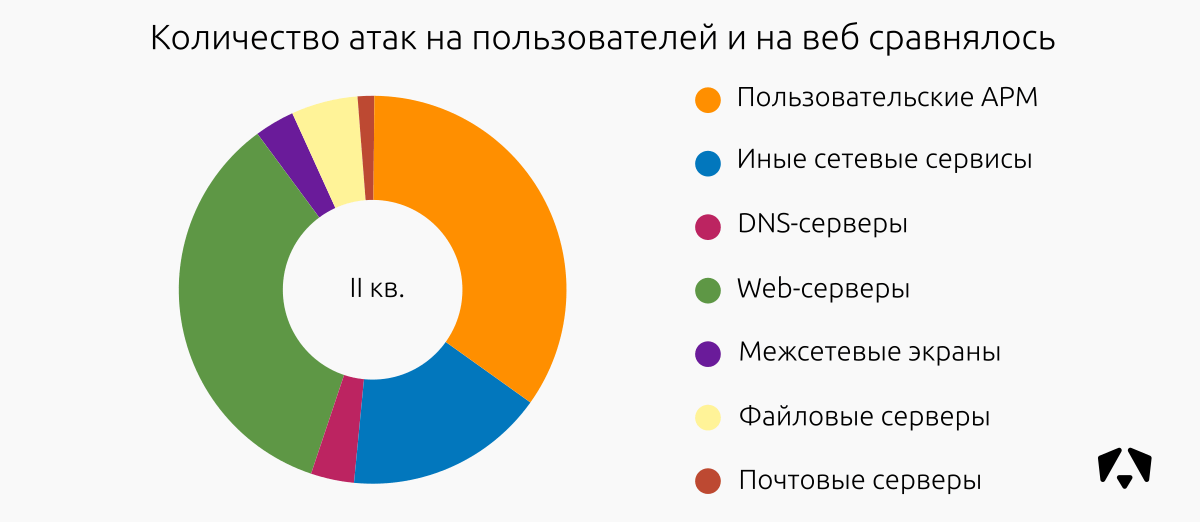
The situation on the objectives of the attacks has changed slightly compared with the previous period. In I quarter. In 2017, more than half of all attacks were directed to user jobs.
In the reporting period, web segments were also often subjected to attacks, as well as user workstations. We associate this with the composition of the monitoring nodes. There was no particular malicious activity.
The print version of the report on the site amonitoring.ru .
Report for the I quarter. 2017
Thanks to Baymaxx for helping me prepare my report. Yes, you can believe him if he answers you in the comments.
For three months, sensors recorded and analyzed 254,453,172 information security events and identified 144 incidents.
In the previous quarter of 2017, the Monitoring Center recorded 137,873,416 IS events and 98 incidents .
')
Monitoring results
In the period from April 1 to June 30, 2017, employees of the Monitoring Center monitored the information systems of several organizations with a total number of connected nodes of about 15,500 (workstations, web, mail, file storages, VPN, etc.).
We see a significant increase in the number of recorded events (+ 85%) and incidents (+ 47%). At the same time, the number of nodes on the monitoring grew more slowly, the increase for the II quarter. 2017 was about 30%.
As will be seen in one of the graphs below, the number of attempts to exploit vulnerabilities has greatly increased (for example, EternalBlue used in the ransomware attacks of WannaCry and Petya ).
Event Type Descriptions
“Informational event” - informational events that may be useful in the analysis of an incident.
“Violation of the IS policy” - events that indicate actions that allegedly violate the requirements of the IS Policy of a controlled organization.
“Attack or exploitation” - events that indicate attempts to remotely execute a code or exploit vulnerabilities in controlled resources.
"Scan" - events that indicate the study of the network before attempting an attack.
“Password Selection” - events that indicate attempts to gain access to monitored resources by selecting authentication data.
"Trojans and viruses" - events that indicate the fact of infection of controlled resources with viruses or malware activity.
“DDoS” - events that indicate attempts to carry out distributed denial of service attacks.
“Other” - events which by their nature cannot be attributed to one of the classes listed above.
Among the 144 incidents identified:
| Class incident | High criticality | Average criticality | Low criticality | Total incidents | Share of incidents |
|---|---|---|---|---|---|
| Malicious software | eight | 21 | 14 | 43 | thirty% |
| Attack | four | five | 3 | 12 | eight% |
| Password Selection | eleven | eight | four | 23 | sixteen% |
| Violation of information security policy | 2 | 6 | 13 | 21 | 15% |
| Vulnerability Exploitation | 12 | 21 | 7 | 40 | 28% |
| DDoS | 3 | 2 | five | 3% | |
| Total: | 40 | 63 | 41 | 144 | 100.0% |
In I quarter. In 2017, the situation was a bit different:
The ratio of types of reported IS incidents during the year changed as follows:
| The share of incidents,% | ||||
|---|---|---|---|---|
| Incident class | Q3 2016 | IV quarter 2016 | I quarter 2017 | Q2 2017 |
| Malicious software | 42,8 | 51 | 52 | thirty |
| DDoS | 14.3 | 1.9 | 3 | 3 |
| Violation of information security policy | 14.3 | 13.2 | 9 | 15 |
| Password Selection | 23.8 | 13.2 | 14 | sixteen |
| Attack | 11.3 | sixteen | eight | |
| Vulnerability Exploitation | 4.8 | 9.4 | 6 | 28 |
The recent publication of vulnerabilities discovered by foreign government agencies and their exploits did not go unnoticed in our Monitoring Center. We saw a distinct increase in attempts at exploitation. Fortunately, by the time of the large-scale attacks, we had already written signatures for network defenses and “caught” these attacks at an early stage, so we managed to avoid most of the VERY serious consequences.
In the first quarter of 2017, we saw attempts by some employees of organizations connected to the Monitoring Center to mine cryptocurrencies on corporate IT resources. Unfortunately, the high rate of bitcoin and ethereum provokes to continue to try to do it. Such incidents fell into the "Violation of the policy."
Distribution of information security incidents relative to the days of the week in Q2 2017:
Distribution of information security incidents in the second quarter of 2017:
This time we observe a fairly even picture, without sharp peaks.
TOP sources
The sources of attacks in this case are IP-addresses that were participants in the network interaction with controlled addresses.
The graph shows the location of the first hundred IP addresses by the number of registered events. Most of these addresses are located in Russia, the Netherlands and Germany, although, of course, it cannot be argued that the attackers were from these countries.
TOP incident-prone segments
The situation on the objectives of the attacks has changed slightly compared with the previous period. In I quarter. In 2017, more than half of all attacks were directed to user jobs.
In the reporting period, web segments were also often subjected to attacks, as well as user workstations. We associate this with the composition of the monitoring nodes. There was no particular malicious activity.
The most frequently used techniques for influencing systems that caused the IS incident
| Threat | Impact Technique |
|---|---|
| Password Selection | Attempts to select authentication information for access to services and resources of controlled organizations - RDP, SSH, SMB, DB, Web. |
| Violation of the IS policy | Violation by users / administrators of monitored resources of the requirements of IS policies regarding the use of outdated versions or untrusted software. This software can be used by an attacker to attack by exploiting a vulnerability. Also use the resources of the company for their own benefits (mining bitcoin / ethereum). Using torrent trackers. |
| Malicious software | Infecting the final system, spreading the virus over the local network, shutting down / blocking services that prevent the spread of the virus, attempting other attacks within the network to obtain critical information and transmitting to command servers. |
| Attempts to exploit vulnerabilities | The use of deficiencies in the system for the violation of KCD and the impact on the correct operation of the system. Vulnerability can be the result of programming errors, deficiencies in the design of the system, configuration errors, lack of updates. Some vulnerabilities are known only theoretically, while others are actively used and have known exploits. |
The print version of the report on the site amonitoring.ru .
Report for the I quarter. 2017
Thanks to Baymaxx for helping me prepare my report. Yes, you can believe him if he answers you in the comments.
Source: https://habr.com/ru/post/333810/
All Articles