Automation IP-network. Part 3 - Monitoring TCP Anomalies
 In the previous article, the monitoring of the speed of opening Web resources was considered. As a parallel process in measuring speed, it would be interesting to measure TCP anomalies in order to gain a deeper understanding of the possible reasons for the low speed of opening Web pages. We will try to solve this problem in this article.
TCP anomalies will be considered packets, which indicate a loss of information in the transmission process. Perhaps the most popular tool for in-depth analysis of network traffic is Wireshark and its console version tshark. Therefore, we will consider it as the initial analyzer.
The following will be referred to TCP anomalies:
- tcp retransmission - occurs when the sender re-transmits the packet after the confirmation period expires;
- tcp duplicate_ack - occurs when the same ACK number is displayed and it is less than the last byte of data sent by the sender. If the receiver detects a space in the sequence numbers, it will generate a duplicate ACK for each subsequent packet it receives on this connection until the missing packet is successfully received (retransmitted);
- tcp lost_segment - occurs when there is a gap in the sequence numbers of packets. Packet loss may result in duplicate ACK, leading to retransmissions;
- tcp.analysis.fast_retransmission - occurs when senders receive several packets, the sequence number of which is greater than the confirmed packets, in which case the sender retransmits the packet before the confirmation timer expires;
- - tcp ack_lost_segment - occurs when there is a gap in the sequence numbers of the supporting packets.
For packet analysis using tshark we will use the following expression:
')
tshark -i bce0 -t ad -qz io,stat,5,"(ip.addr==1.1.1.1) && tcp","COUNT(tcp.analysis.retransmission)(ip.addr==1.1.1.1) && tcp.analysis.retransmission","COUNT(tcp.analysis.duplicate_ack)(ip.addr==1.1.1.1) && tcp.analysis.duplicate_ack","COUNT(tcp.analysis.lost_segment)(ip.addr==1.1.1.1) && tcp.analysis.lost_segment","COUNT(tcp.analysis.fast_retransmission)(ip.addr==1.1.1.1) && tcp.analysis.fast_retransmission","COUNT(tcp.analysis.lost_segment)(ip.addr==1.1.1.1) && tcp.analysis.ack_lost_segment") where
bce0 is the name of the interface on which the packet analysis will be performed. This name in linux / Unix system can be seen with the command ifconfig.
1.1.1.1 - IP address of the studied resource
As a result of the output of the command, we obtain a table, which we will subsequently process and load into the database for plotting graphs:
Table
====================================================================================================== | IO Statistics | | | | Duration: 5. 40977 secs | | Interval: 5 secs | | | | Col 1: (ip.addr==1.1.1.1) && tcp | | 2: COUNT(tcp.analysis.retransmission)(ip.addr==1.1.1.1) && tcp.analysis.retransmission | | 3: COUNT(tcp.analysis.duplicate_ack)(ip.addr==1.1.1.1) && tcp.analysis.duplicate_ack | | 4: COUNT(tcp.analysis.lost_segment)(ip.addr==1.1.1.1) && tcp.analysis.lost_segment | | 5: COUNT(tcp.analysis.fast_retransmission)(ip.addr==1.1.1.1) && | | tcp.analysis.fast_retransmission | | 6: COUNT(tcp.analysis.lost_segment)(ip.addr==1.1.1.1) && tcp.analysis.ack_lost_segment | |----------------------------------------------------------------------------------------------------| | |1 |2 |3 |4 |5 |6 | | | Date and time | Frames | Bytes | COUNT | COUNT | COUNT | COUNT | COUNT | | |-------------------------------------------------------------------------------| | | 2017-07-10 15:00:45 | 507 | 481496 | 1 | 0 | 2 | 0 | 0 | | | 2017-07-10 15:00:50 | 0 | 0 | 0 | 0 | 0 | 0 | 0 | | ====================================================================================================== In the quality of tools as in the previous article, we will use Cacti and Python3. We are upgrading the script from the previous article, to measure the speed and TCP anomalies:
Python code
#!/usr/bin/env python # -*- coding: utf-8 -*- import datetime import re import os import subprocess import argparse import time import signal parser = argparse.ArgumentParser() parser.add_argument("-h_page", "--hostname_page", dest = "hostname_page") args = parser.parse_args() curent_time=str(datetime.datetime.now().strftime("%Y-%m-%d_%H:%M:%S_")) pid=os.getpid() ##########start Table parser############### def parser_tshark_output(open_time, parser_file): table_data = {'date':[],'1 frame':[],'2 frame':[],'retr':[],'dup_ack':[],'lost_seg':[],'fast_retr':[],'ack_lost_seg':[]} lines = open(parser_file, 'r').readlines() lookup = 'tcp.analysis.ack_lost_segment ' number = 0 for num in lines: if lookup in num: number+=lines.index(num) try: del (lines[-1]) except: pass L=open("/usr/TEST/TMP_FILES/test_tshark_temp_"+str(os.getpid())+".txt", 'w') L.writelines(lines) L.close() with open("/usr/TEST/TMP_FILES/test_tshark_temp_"+str(os.getpid())+".txt", 'r') as table: if number != 0: for _ in range(int(number+5)): next(table) #skip header for row in table: row=row.strip('\n').split('|') values = [r.strip() for r in row if r != ''] table_data['date'].append(values[0]) table_data['1 frame'].append(int(values[1])) table_data['2 frame'].append(int(values[2])) table_data['retr'].append(int(values[3])) table_data['dup_ack'].append(int(values[4])) table_data['lost_seg'].append(int(values[5])) table_data['fast_retr'].append(int(values[6])) table_data['ack_lost_seg'].append(int(values[7])) else: pass if number !=0: frames=sum(table_data['2 frame']) print ('start-frames_' + str.format("{0:.2f}", frames)+'_end-frames') tcp_errors=sum(table_data['retr'])+sum(table_data['dup_ack'])++sum(table_data['fast_retr'])+sum(table_data['ack_lost_seg']) print ('start-tcp_errors_' + str(tcp_errors)+'_end-tcp_errors') if open_time != 'open_error' and frames != 0: k=tcp_errors else: k= 'no data' else: k= 'no data' os.remove("/usr/TEST/TMP_FILES/test_tshark_temp_"+str(os.getpid())+".txt") return (k) ###########end table parser############### ###########start tshark part 1########### resault_temp=subprocess.Popen(['nslookup '+str(args.hostname_page)], bufsize=0, shell=True, stdout = subprocess.PIPE, stderr=subprocess.PIPE) data=resault_temp.communicate() ip_adr_temp=re.findall(r'(\d{1,3}\.\d{1,3}\.\d{1,3}\.\d{1,3})', str(re.findall(r'Address: (\d{1,3}\.\d{1,3}\.\d{1,3}\.\d{1,3})', str(data)))) if ip_adr_temp != []: pass else: ip_adr_temp = ['1.1.1.1'] ip_adr='' for z in ip_adr_temp: if len(ip_adr_temp)-ip_adr_temp.index(z)==1: ip_adr+='ip.addr=='+str(z)+')' else: ip_adr+='ip.addr=='+str(z)+' or ' ftcp=open('/usr/TEST/TMP_FILES/1tshark_temp'+curent_time+str(pid)+'.txt', 'w') tcp=subprocess.Popen(['timeout 180 tshark -i bce0 -t ad -qz io,stat,5,"('+str(ip_adr)+' && tcp","COUNT(tcp.analysis.retransmission)('+str(ip_adr)+' && tcp.analysis.retransmission","COUNT(tcp.analysis.duplicate_ack)('\ +str(ip_adr)+' && tcp.analysis.duplicate_ack","COUNT(tcp.analysis.lost_segment)('+str(ip_adr)+' && tcp.analysis.lost_segment","COUNT(tcp.analysis.fast_retransmission)('+str(ip_adr)+\ ' && tcp.analysis.fast_retransmission","COUNT(tcp.analysis.lost_segment)('+str(ip_adr)+' && tcp.analysis.ack_lost_segment"']\ , bufsize=0, shell=True, stdout=(ftcp))#stdout = subprocess.PIPE, stderr=subprocess.PIPE) time.sleep(2) ############start wget ################ fweb=open('/usr/TEST/TMP_FILES/web_temp'+curent_time+str(pid)+'.txt', 'w') web=subprocess.call(["timeout 120 wget -E -H -p -Q300K --user-agent=Mozilla --no-cache --no-cookies --delete-after --timeout=15 --tries=2 "+args.hostname_page+" 2>&1 | grep '\([0-9.]\+ [KM]B/s\)'"], bufsize=0, shell=True, stdout=(fweb)) fweb.close() fweb=open('/usr/TEST/TMP_FILES/web_temp'+curent_time+str(pid)+'.txt', 'r') data=fweb.read() os.remove('/usr/TEST/TMP_FILES/web_temp'+curent_time+str(pid)+'.txt') speed_temp=re.findall(r's \((.*?)B/s', str(data))#[KM]B/s', str(data))) speed_temp_si=re.findall(r's \((.*?) [KM]B/s', str(data)) try: if re.findall(r'M', str(speed_temp))==[] and re.findall(r'K', str(speed_temp))==[]: speed_="{0:.3f}".format(float(speed_temp_si[0])*0.001*8) elif re.findall(r'M', str(speed_temp))!=[]: speed_="{0:.3f}".format(float(speed_temp_si[0])*1000*8) elif re.findall(r'K', str(speed_temp))!=[]: speed_="{0:.3f}".format(float(speed_temp_si[0])*1*8) except: speed_='no_data' ##############stop wget############## ##############start tshark part2####### os.kill(tcp.pid, signal.SIGINT) ftcp.close() time.sleep(0.3) tcp_error=parser_tshark_output('1', '/usr/TEST/TMP_FILES/1tshark_temp'+curent_time+str(pid)+'.txt') os.remove('/usr/TEST/TMP_FILES/1tshark_temp'+curent_time+str(pid)+'.txt') #########resault to DB########### print ('web_speed_test:'+str(speed_)+' tcp_error:'+str(tcp_error)) Running the script should show the following (tshark, nslookup, wget utilities must be installed on the operating system):
$python3.3 web_open.py -h_page habrahabr.ru web_speed_test:10960.000 tcp_error:2.0 Next, brief instructions on how to upgrade the data in Cacti to get two graphs from one RRA:
Cacti
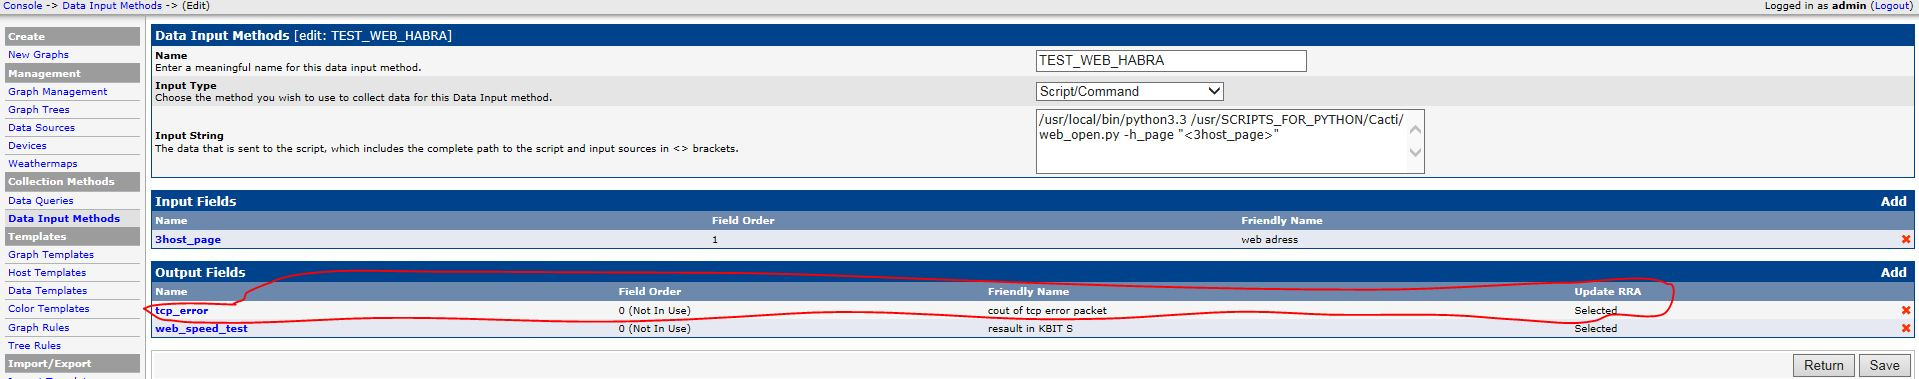
1. Add additional output Fields to Data Input Methods:
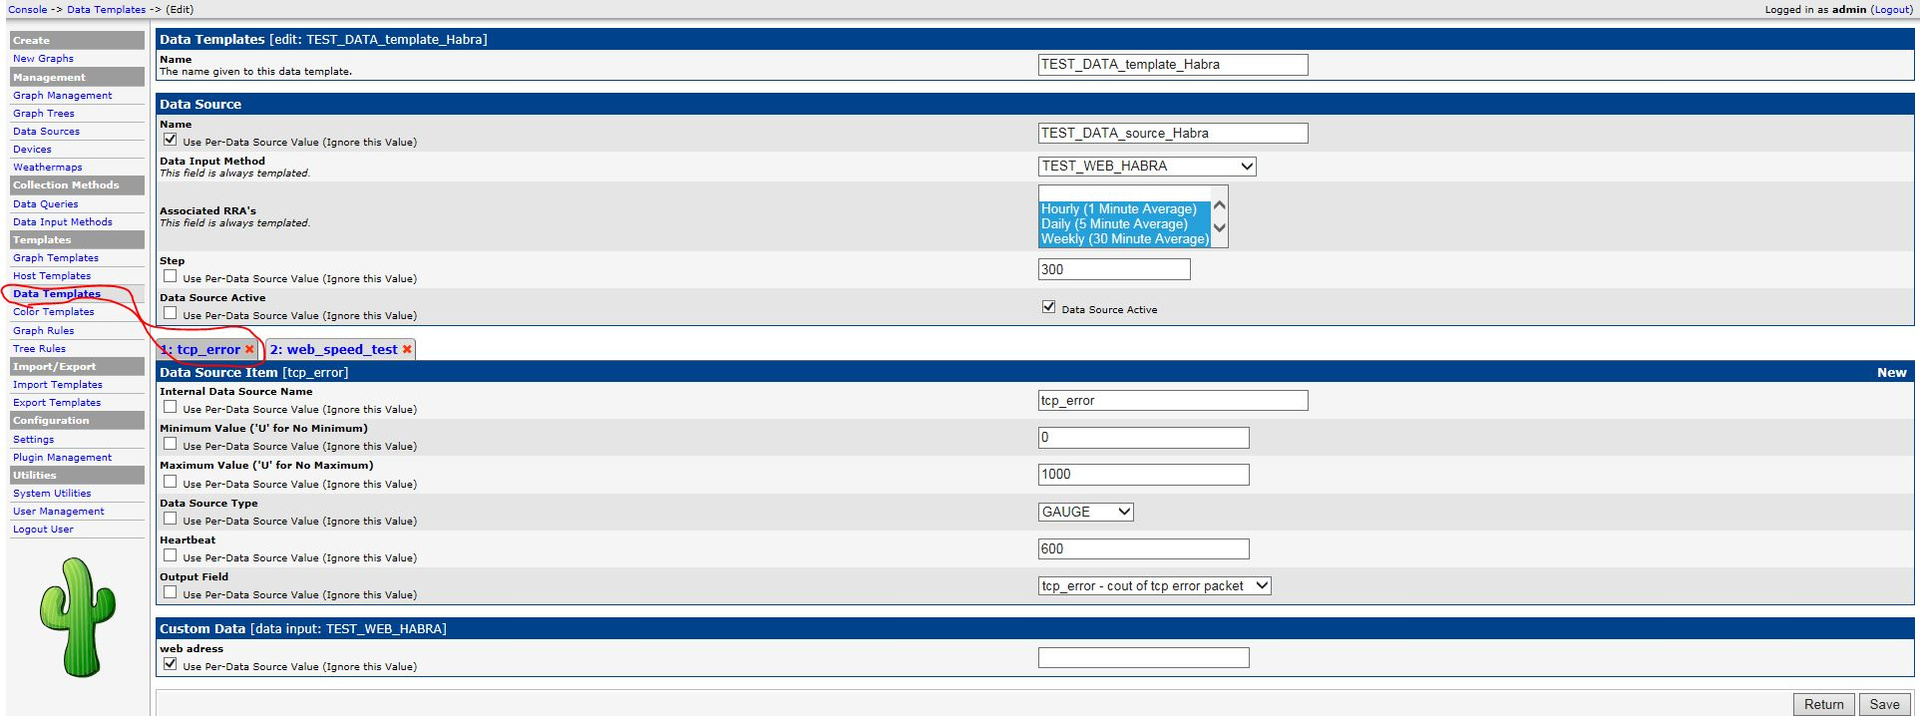
2. Add an additional area to Data Temlate tcp_error
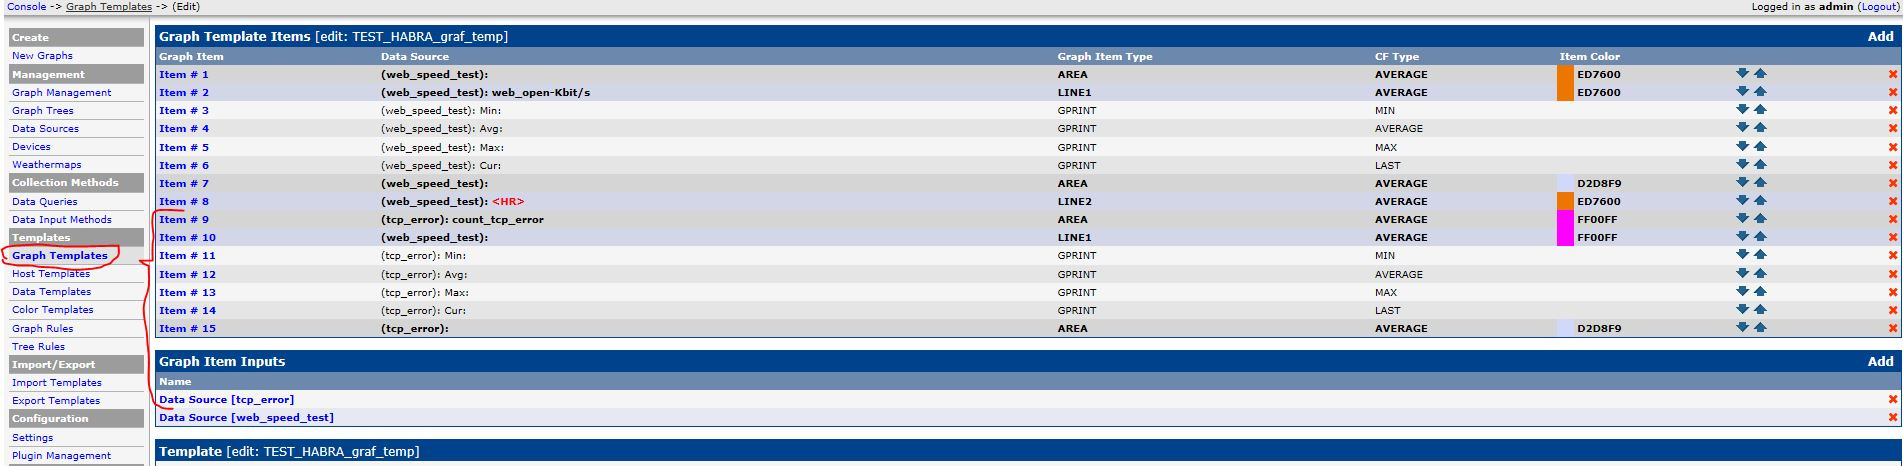
3. Copy the Graph template and add additional information to it; when setting up new graphs, initially you need to use this Template:
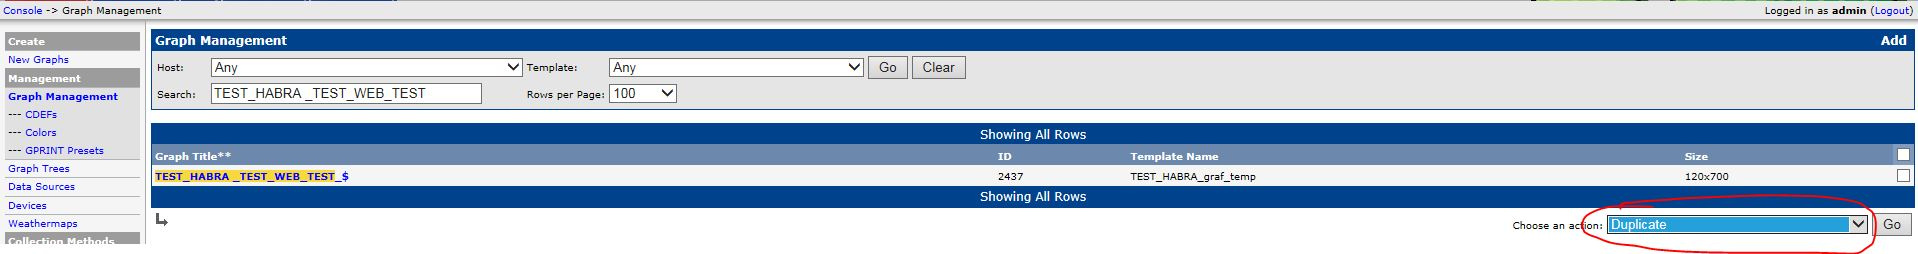
4. Set up a graph as shown in the previous article using the Template above, duplicate the graph:
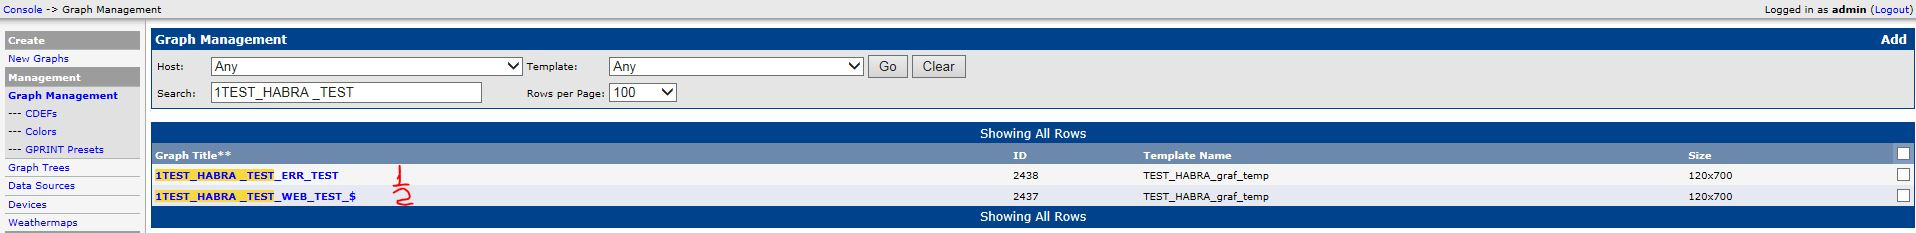
5. The result should be the following:
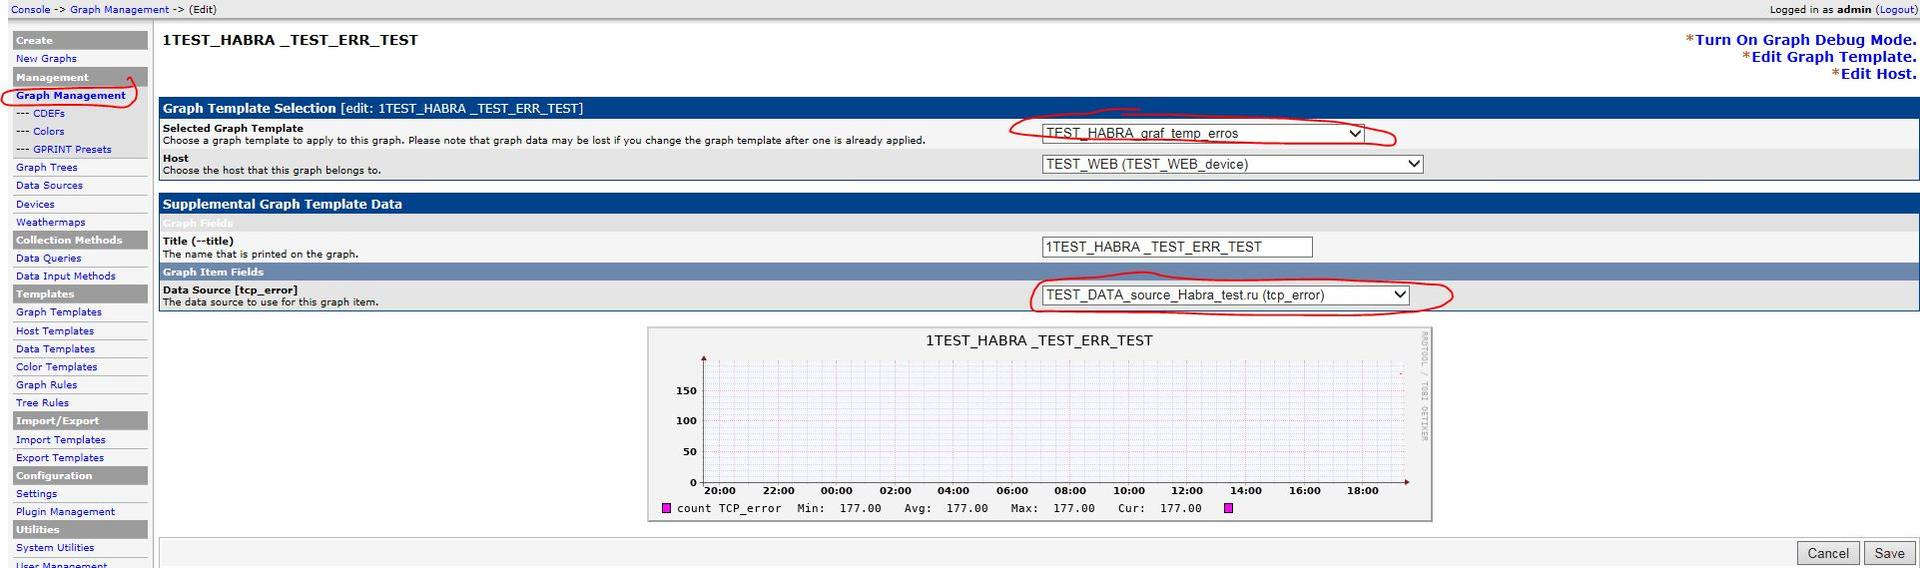
6. Change the data in the first graph to the right. First, change the Template, click save, then check that the Data Source is correct, if necessary, select the correct one:
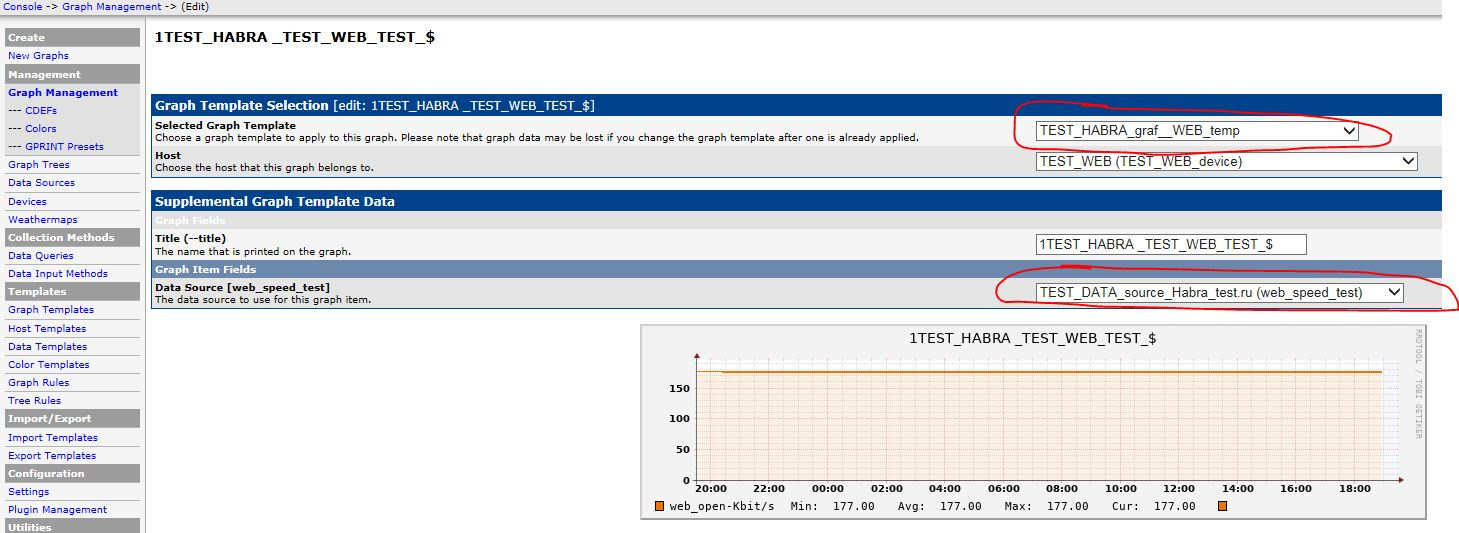
7. Change the data for the second graph:
2. Add an additional area to Data Temlate tcp_error
3. Copy the Graph template and add additional information to it; when setting up new graphs, initially you need to use this Template:
4. Set up a graph as shown in the previous article using the Template above, duplicate the graph:
5. The result should be the following:
6. Change the data in the first graph to the right. First, change the Template, click save, then check that the Data Source is correct, if necessary, select the correct one:
7. Change the data for the second graph:
If everything is done correctly, you should get the following graphs

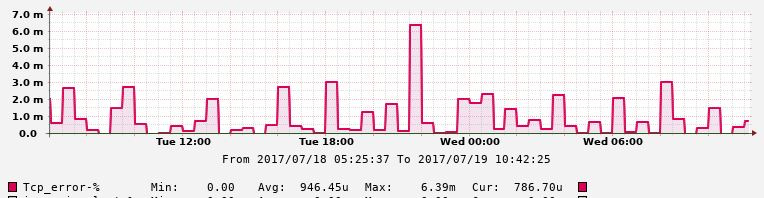
That's all, further according to the plan with positive feedback, in the following articles we will consider the modernization of this statistics.
- Adding TCP and ICMP RTD (round trip delay).
- Carrying out measurements on separate probes under control of the head server with a visualization system and a database.
- Ability to test ICMP RTD from any network router (Cisco, Juniper, Huawei).
Thank you for your time.
Source: https://habr.com/ru/post/333768/
All Articles