VAX - a tool for visual programming, or how to write SQL with a mouse
I want to tell you about the web editor I created for “visual programming” and its creation history.
Somehow I happened to face one very annoying task at work at PimPay, in which I hold the position of technical director. We have a department dealing with the claim activity with the Post of Russia. The guys are looking for lost / unpaid / undelivered items. The bottom line for developers was this task was to write a very large number of varied and huge (> 150 lines) SQL queries in the PostgreSQL dialect, which were VERY often changed and supplemented due to the active appearance of new hypotheses, as well as the receipt of new information about orders.
Naturally, we, as programmers, got tired of this thing very quickly, and immediately wanted to offer some kind of visual filter design tool, which eventually translates into SQL. At first, they wanted to stick just a lot of molds with a bunch of "inputs", but the idea quickly failed, because it was clear that all filters must be able to somehow “compose” (compose): group into groups, intersect with different AND, OR, parametrize, and so on conditions. And even the simplest filter that was actually used was starting to look awful. Plus, the idea sneaked in on the side that, in principle, these filters are a particular variant of just the general SQL collector, and in general, since it came to "visual programming", then you can try to completely ignore the subject area.
')
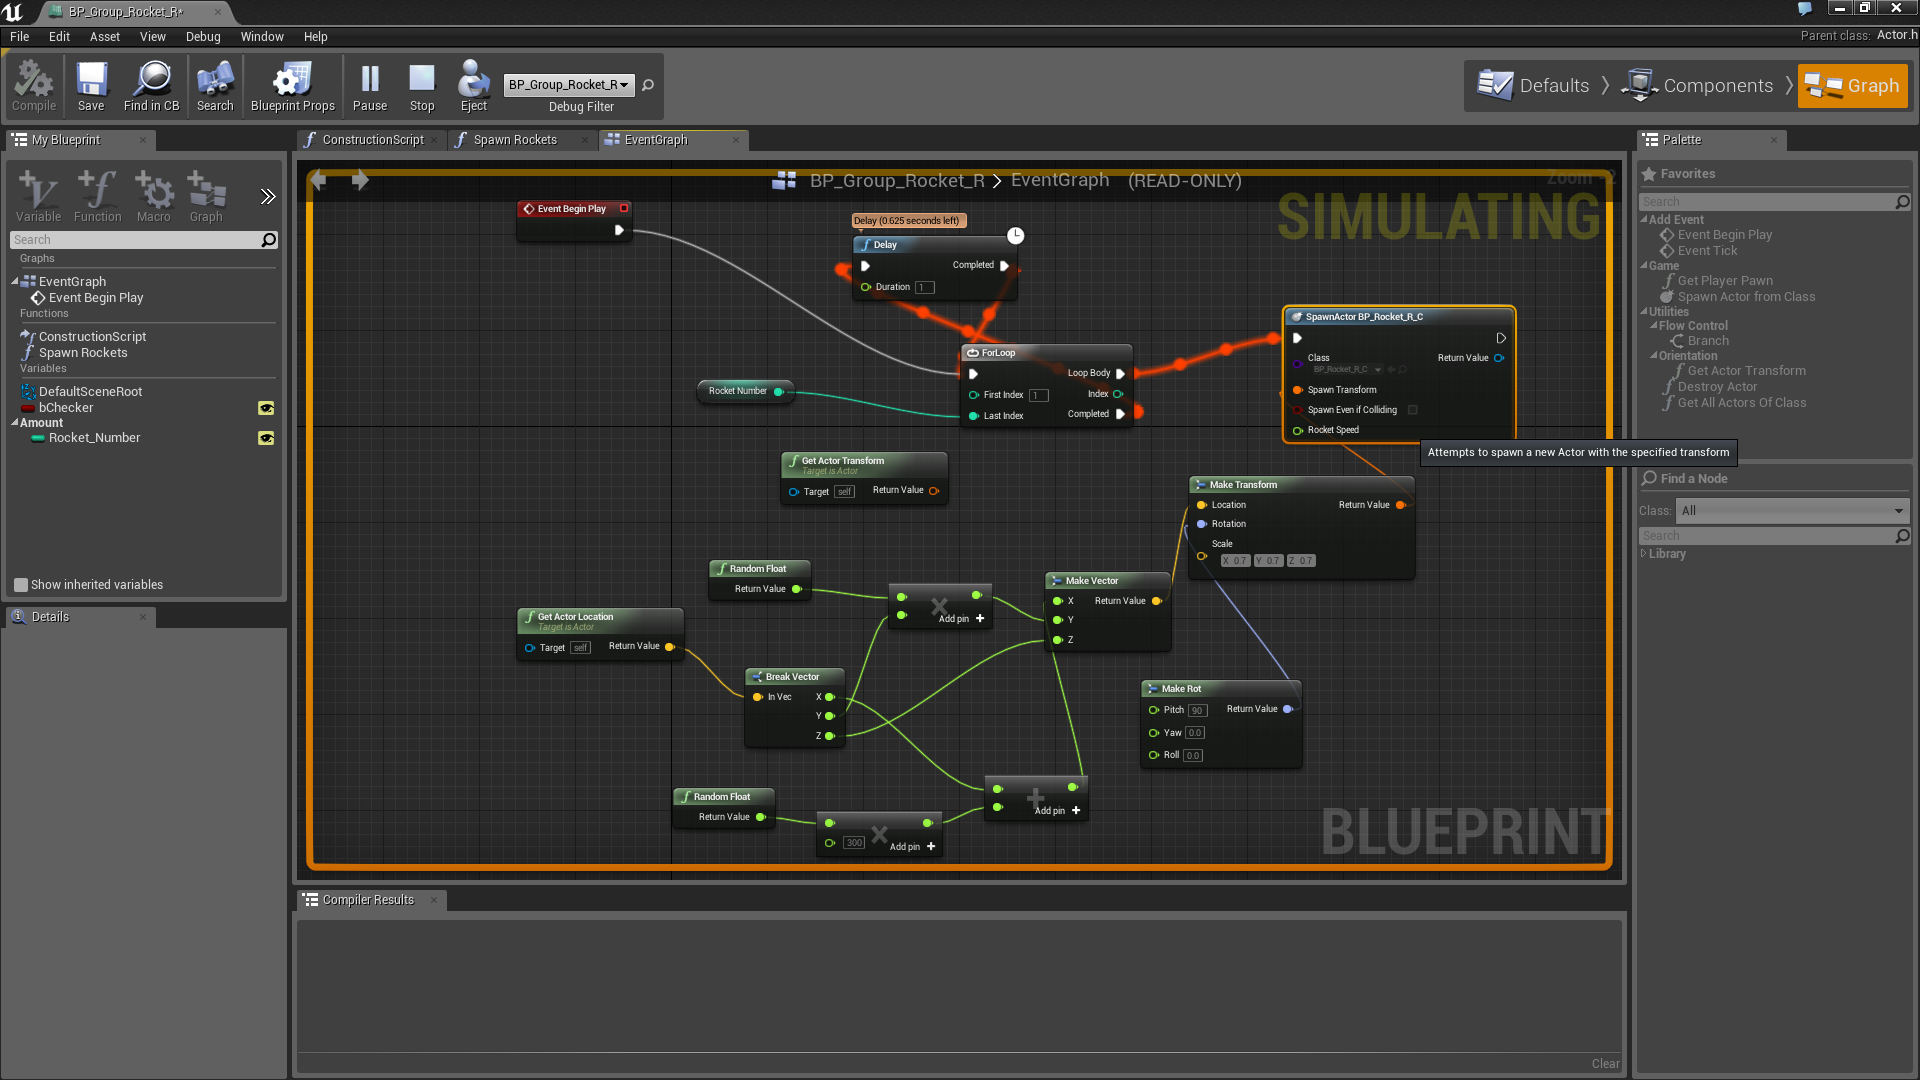
And here, as in the film “Flash of Genius”, a picture of a visual scheme editor (blueprints) from UE4 (Unreal Engine 4) came up in front of my eyes, with which the characters launched fireballs in their enemies:
Having come home that evening, I took the first JavaScript library that could draw beautiful rectangles and complex lines - it turned out to be Raphaël from our compatriot Dmitry Baranovskiy . Having drawn a couple of rectangles and pulling them with library drag-and-drop, I immediately wrote to the library author asking if he supports it. And without waiting for an answer (so far), I on the same night produced more than 1000 lines of JavaScript code, and my dream almost came true! But there was still a lot of work.
In the end, what wanted to do:
- A beautiful and easy to use editor on the web that provides tools for manipulating and linking “nodes” of different types, which are described in a domain scheme that is passed to the editor during initialization. Thereby making the editor independent of the subject area.
- The ability to serialize an acyclic user graph into a tree structure that is very easy to parse (for example JSON) and interpret in any language.
- Provide a convenient format for describing the types and components of the subject area.
- Come up with a rich system of types and constraints that will help the user to create graphs that are correct from the point of view of the subject area.
- To enable the user to create their components from combinations of existing ones.
In the end, this is what happened:

It can be seen that the blueprint consists of nodes (nodes), which are specific instances of components (component), described in the schema domain. Nodes connect the wires (wires). The wire always goes from the output of one node to the input of another (and vice versa). From one output can go a lot of wires, but only one can be tied to the input.
All inputs and outputs are of type, and accordingly impose restrictions on possible connections. For example, take the following type system:
types: # Any, - Scalar: Numeric: extends: Scalar String: extends: Scalar List: typeParams: [A] Thus, it is possible to associate an output of the Numeric type with an input of the Scalar type, but not vice versa. For parameterized types like List , covariance is implied, i.e. List [String] can be transferred to List [Scalar] , but not vice versa. Plus, there is always a super type Any , whose heir is all the other types.
The nodes can also have attributes that are not configured using wires, and the user himself enters values into them. For this, there is the concept of valuePickers, with the help of which you can set your own interface for entering attribute values. Out of the box there is just a text input and the ability to select from a predefined set of constants.
Also nodes are parameterized by type. For example, given component:
IfThenElse: typeParams: [T] in: C: Boolean out: onTrue: @T onFalse: @T When creating a node based on the IfThenElse component , the editor will ask us to specify the type T and substitute it in all places with T :
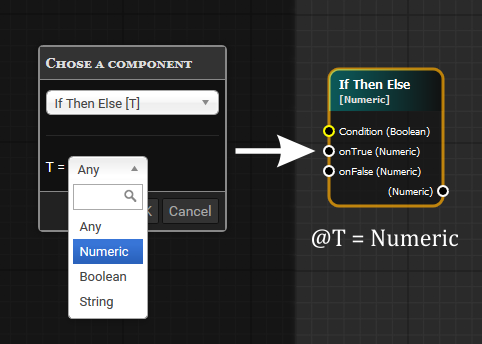
Types of inputs and outputs also assist the user in designing. If you pull the wiring from the output with the Numeric type and release the mouse, the window for creating components will pop out, filtered in such a way that only those whose conforms are compatible with the Numeric type will remain there. And even automatically linked transactions.
It all took about a clean three man-weeks, stretched for a good 5-6 months. And six months later, the forces appeared to document something and declare it to the world.
So, gentlemen, it is time to create! Take the most unreal case when you need to give a “non-technical” user the ability to visually program the process of folding numbers. We understand that we need only one type of Numeric and a couple of components: the ability to set a number ( Literal ) and the ability to add two such numbers ( Plus ). The following is an example of the scheme of this subject area: (all examples of schemes are described in YAML format for clarity, but in reality you will need to transfer native javascript objects):
types: # Any, - Numeric: color: "#fff" components: Literal: # attrs: # V: Numeric out: # O: Numeric Plus: in: # A: Numeric B: Numeric out: O: Numeric An example of an assembled editor with this scheme and a simple graph can be found here .
Play around! Click X to create a new item, delete the item by double clicking. Connect the nodes with the wires, select them all and copy and paste them through Ctrl + C and Ctrl + V. Then select all Ctrl + A and delete with Delete . After all, you can always make Undo by resorting to Ctrl + Z !
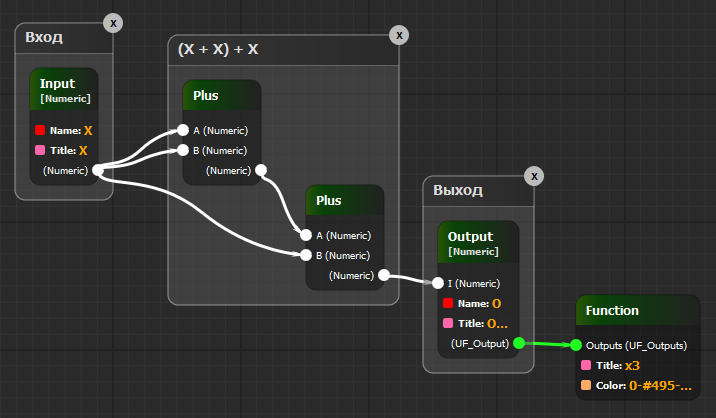
Now let's say our simple user has collected the following graph:
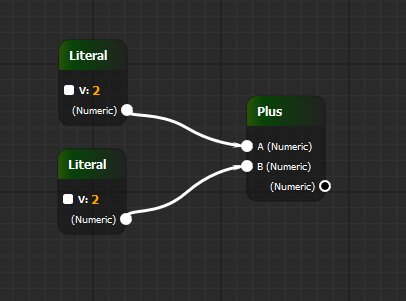
If we ask the editor to save our graph to a tree, we get:
[ { "id": 8, "c": "Plus", "links": { "A": { "id": 2, "c": "Literal", "a": { "V": "2" }, "links": {}, "out": "O" }, "B": { "id": 5, "c": "Literal", "a": { "V": "2" }, "links": {}, "out": "O" } } } ] As we see here, a tree came, which is very easy to recurse around and get some kind of result. For example, the language of our backend is also JavaScript (although it can be any).
We write a trivial code:
function walk(node) { switch (node.c) { case 'Literal': return parseFloat(node.aV); case 'Plus': return walk(node.links.A) + walk(node.links.B); default: throw new Error("Unsupported node component: " + node.component); } } walk(tree); If we walk this function on the above tree, we get 2 + 2 = 4. Voila!
A very nice bonus is the ability of the user to define their "functions" by combining existing components.
For example, even having such a scanty domain area where you can simply add numbers, the user can define his component, which will multiply the given number by three:
Now we have a custom function x3 :
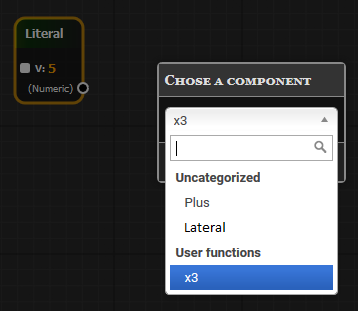
Which can be used as a new component:

In this case, a tree can be sent to the backend, where all user functions are inlined (inlined), and the developer will not even know that some nodes were part of a user function. It turns out that users themselves can enrich their design language with due imagination and perseverance.
Let us return to our first primitive example of the folding of numbers. Despite the fact that the processor is an integral device, which is the only thing that adds up - it will not be very fun to program visually to the end user at the level of adding numbers. Looking for more expressive and rich designs!
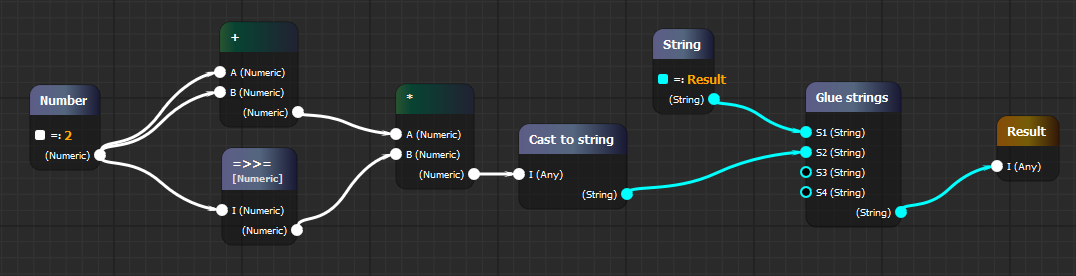
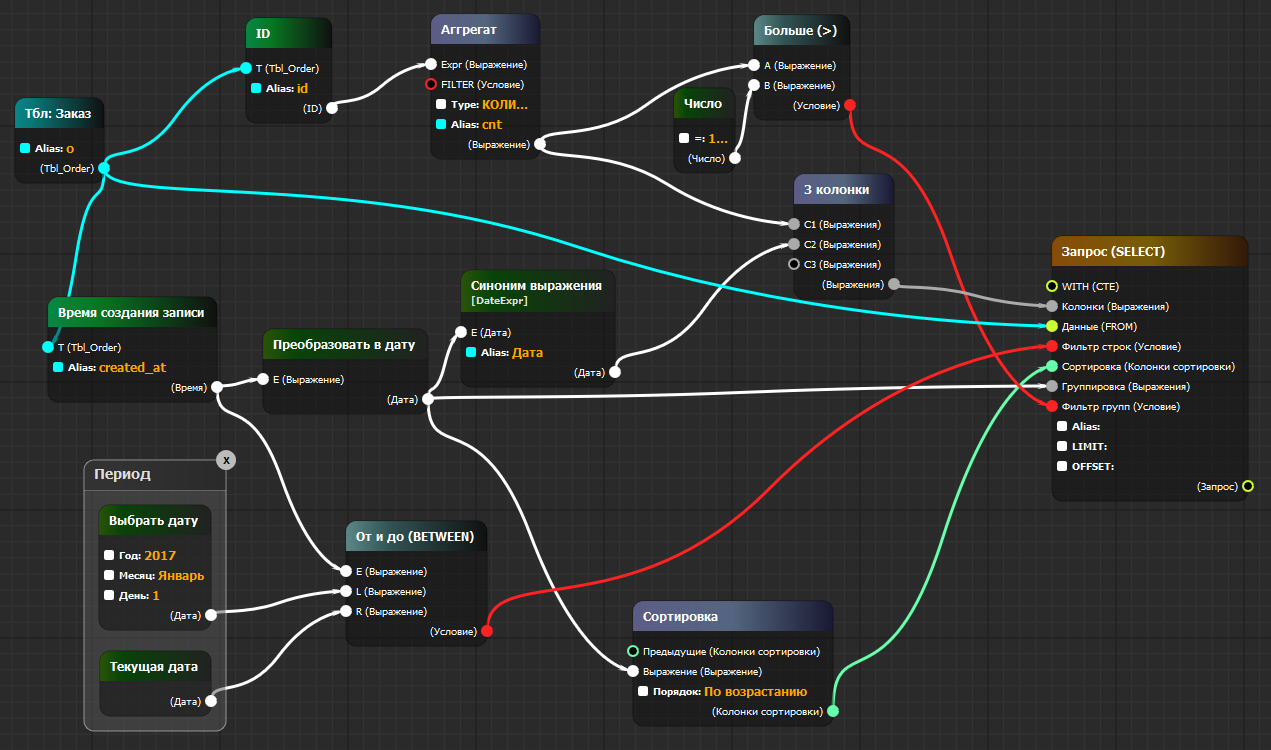
Take for example the wonderful SQL language. If you look closely, then any SQL query is actually very easy to decompose into a tree (this is what the first thing the database does when it receives your query). By writing a sufficient number of types and components, you can get something more frightening :
PS If any of the examples does not open ...
Perhaps this is due to the fact that you have already tried to save a custom function for one of the schemes. And since by default (but you can and need to define your handlers) all user functions are stored in localStorage , a situation may arise when the editor tries to load components or types that are not described in the current schema.
To do this, simply clear the current localStorage with:
To do this, simply clear the current localStorage with:
localStorage.clear() Unfortunately, the demonstration of turning this graph into real SQL will not work, because She is strongly tied to our project. But in reality this is going to the following SQL:
SELECT COUNT(o.id) AS cnt , (o.created_at)::DATE AS "" FROM tbl_order AS o WHERE o.created_at BETWEEN '2017-1-1'::DATE AND CURRENT_DATE GROUP BY (o.created_at)::DATE HAVING ( COUNT(o.id) ) > ( 100 ) ORDER BY (o.created_at)::DATE ASC Which is immediately executed and gives the finished report in Excel format. Having translated this SQL to human, we get:
Show the number of loaded orders for each day in chronological order, starting from January 1, 2017, throwing out the days where less than 100 orders were loaded. Quite a real business report!
Schema in JSON format for this example can be found here .
I will not give a full description of the type and component system in the article; I send it to the appropriate section of the documentation . But in order to heat up interest, I’m just going to “insert” a little, which can be written like this (the backlighting of the fancy YAML syntax is a bit obscure):
Plus: typeParams: [T] typeBounds: {T: {<: Expr}} # 'T' 'Expr', # , 'Expr' in: A: @T B: @T out: O: @T It’s as if you’ve declared a function in Scala:
def Plus[T <: Expr](A: T, B: T): T = A + B As a result, by preparing a sufficient number of components, and inventing a good type system (and writing a
Most importantly, I’m happy to bring this tool to the public domain on GitHub under a MIT license.
Who cares, there are ideas / tasks for the further development of the tool:
- More convenient navigation on components in the scheme + their documentation for the user
- Attribute Sockets (as in UE4)
- Ability to define attributes in custom functions.
- Read-only mode for displaying diagrams
- Custom shape nodes (as in UE4), not just rectangles
- Acceleration and optimization for working with a large number of elements
- Internationalization
- Export images to SVG / PNG
- You name it!
It will be cool if someone wants to use this tool in practice and share their experience.
PS It will be even cooler if someone joins the tool development!
PPS I conducted a presentation of the tool in the company using this document .
Source: https://habr.com/ru/post/333750/
All Articles