C / C ++ on Linux in Visual Studio Code for Beginners
Let's be honest, very few people use the GDB debugger on Linux in the console version. But what if you add a beautiful interface to it? Under the cat you will find a step-by-step instruction for debugging C / C ++ code on Linux in Visual Studio Code.
I give the word to the author.
Relatively recently, I moved to Linux. Developing on Windows is, of course, more convenient and more pleasant, but here I found an efficient way to easily and quickly debug C / C ++ code, without resorting to such methods as “printf-style debugging” and so on.
')
So let's get started. Writing in a
Today we will talk about Visual Studio Code .
Ubuntu / Debian
OpenSUSE / SLE Based Distrs
In order for VS Code to fully accompany us when working with C / C ++ files, you need to install the extension “cpptools”. It will also be useful to put one of the sets of snippets.

I strongly recommend enabling autosave of editable files, this will help us in the future.

Go ahead. Open any folder (new or not, it does not matter).

I already have a couple of files in this folder for working with C / C ++. You can copy one of your work here or create a new file.
There is nothing left. Set up a single-key compilation and learn how to debug without
Step 1 . Open the file .c / .cpp, which (necessarily) is in your folder.
Step 2 . Press Ctrl + Shift + B. VS Code will hint to you gently that he does not know how to build your project.

Step 3 . Therefore, we further configure the build task: select “Configure the build task” -> “Others”.
Step 4 . We prescribe the configuration in accordance with the sample. In fact, we are writing a script for the console, so that everyone who dealt with it will understand further. Please note that to compile the sources in the system, the compiler itself must be (gcc or another, only the value of the
Step 5 . In
Attention: If your program uses several source code files, specify them in different arguments separated by commas. Also, the
If you use
Step 6 . Next, go back to our source. And press F5 and select C ++.

Step 7 . It remains only to write the path to the program file. By default, this is

Step 8 . Everything, more we do not need anything to start using all the benefits of VS Code. Go to the main project.
First, let's compile the program (no, no, remove the terminal, now this is done by pressing Ctrl + Shift + B).

As you can see in the explorer

It's time for breakpoints. Select the line with
The line marked with a red dot on the left is the place where the program will stop at runtime.
Next, press F5.

As I said, the program stopped execution. Notice the window with local variables.
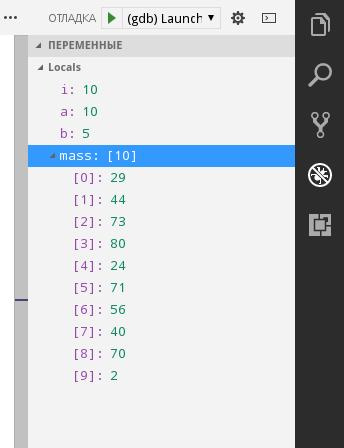
Comfortable. Also, when you stop, you can hover over variables and structures in the code and watch their values.

Also, if at some stage of execution you need to look at step-by-step execution of a particular operation, for example, in a cycle, put a breakpoint in front of it and press F10 to execute the current line without entering the subroutine and F11 with entering.
There are also cases when it is very difficult to read an expression manually, but for debugging you need to know, for example, the value of the sum of the three elements of an array, or the value of a large logical expression. For this there are control values. All this and more can show you Control Values (or "watch").

Important:
Useful shortcuts can be viewed here .

Maximilian Spiridonov - C # developer, MAI student, Microsoft Student Partner. In professional development on .NET I came back at school. About a year worked with real projects on WPF (MVVM) + C #, MySQL, more than 4 years developed on C #. The main area of interest now is mobile development on Xamarin. Also, by chance, in the sphere of interests were C / C ++ and Linux.
I give the word to the author.
Relatively recently, I moved to Linux. Developing on Windows is, of course, more convenient and more pleasant, but here I found an efficient way to easily and quickly debug C / C ++ code, without resorting to such methods as “printf-style debugging” and so on.
')
So let's get started. Writing in a
sublime (or gedit/kate/emacs ), and running in a terminal is a so-so solution, you will hardly find an error when working with dynamic memory allocation the first time. And if the project is time consuming? I have a more convenient solution. And still support Git in the editor, one pluses.Today we will talk about Visual Studio Code .
Installation
Ubuntu / Debian
- Downloading the version of the VS Code package with the .deb extension
- Go to the folder where the package was downloaded (cd ~ / Downloads or cd ~ / Downloads)
- We write where (package name) .deb is the name of the file you just downloaded:
sudo dpkg -i ( ).deb sudo apt-get install -f
OpenSUSE / SLE Based Distrs
- Install the repository:
sudo rpm --import https://packages.microsoft.com/keys/microsoft.asc sudo sh -c 'echo -e "[code]\nname=Visual Studio Code\nbaseurl=https://packages.microsoft.com/yumrepos/vscode\nenabled=1\ntype=rpm-md\ngpgcheck=1\ngpgkey=https://packages.microsoft.com/keys/microsoft.asc" > /etc/zypp/repos.d/VScode.repo' - Update the packages and install the VS Code:
sudo zypper refresh sudo zypper install code
Extensions for C / C ++
In order for VS Code to fully accompany us when working with C / C ++ files, you need to install the extension “cpptools”. It will also be useful to put one of the sets of snippets.
I strongly recommend enabling autosave of editable files, this will help us in the future.
Go ahead. Open any folder (new or not, it does not matter).
I already have a couple of files in this folder for working with C / C ++. You can copy one of your work here or create a new file.
There is nothing left. Set up a single-key compilation and learn how to debug without
printf .Step 1 . Open the file .c / .cpp, which (necessarily) is in your folder.
Step 2 . Press Ctrl + Shift + B. VS Code will hint to you gently that he does not know how to build your project.
Step 3 . Therefore, we further configure the build task: select “Configure the build task” -> “Others”.
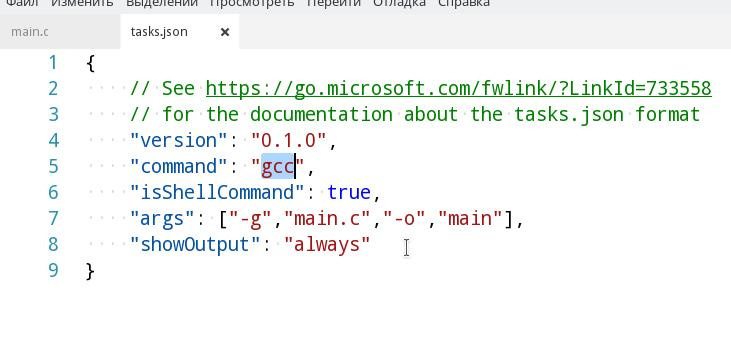
Step 4 . We prescribe the configuration in accordance with the sample. In fact, we are writing a script for the console, so that everyone who dealt with it will understand further. Please note that to compile the sources in the system, the compiler itself must be (gcc or another, only the value of the
command field will differ). Therefore, to compile .cpp, you will need to specify g++ or c++ in the command field, and gcc for .c.Step 5 . In
args write down the arguments that will be passed to the input of your compiler. I remind you that the order should be something like this: -g, < > .Attention: If your program uses several source code files, specify them in different arguments separated by commas. Also, the
-g key (or even -g3 better) is -g3 . Otherwise you will not be able to debug the program.If you use
makefile in the project for the assembly, then in the command field, enter make , and as an argument, pass a directive to the assembly.Step 6 . Next, go back to our source. And press F5 and select C ++.
Step 7 . It remains only to write the path to the program file. By default, this is
${workspaceRoot}/a.out , but I indicated the -o flag in my build file and renamed the compiled program file, so I have a path to the program: ${workspaceRoot}/main .Step 8 . Everything, more we do not need anything to start using all the benefits of VS Code. Go to the main project.
Debugging
First, let's compile the program (no, no, remove the terminal, now this is done by pressing Ctrl + Shift + B).
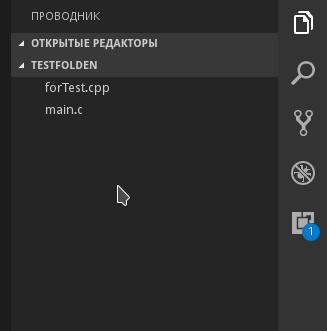
As you can see in the explorer
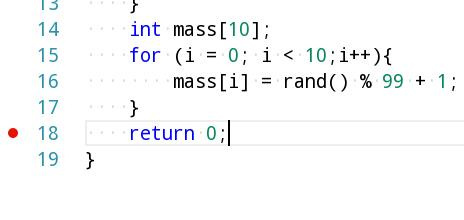
main appeared, it means everything is in order and the assembly went without errors. I do not have a very large program, but it is executed instantly. In short, the failure of pure water, because the debugging goes in a separate terminal, which closes after the program reached in main() "return 0;" .It's time for breakpoints. Select the line with
"return 0;" and press F9.The line marked with a red dot on the left is the place where the program will stop at runtime.
Next, press F5.
As I said, the program stopped execution. Notice the window with local variables.
Comfortable. Also, when you stop, you can hover over variables and structures in the code and watch their values.
Also, if at some stage of execution you need to look at step-by-step execution of a particular operation, for example, in a cycle, put a breakpoint in front of it and press F10 to execute the current line without entering the subroutine and F11 with entering.
There are also cases when it is very difficult to read an expression manually, but for debugging you need to know, for example, the value of the sum of the three elements of an array, or the value of a large logical expression. For this there are control values. All this and more can show you Control Values (or "watch").
Important:
- For each folder you need to separately configure the assembly files and the path to the program.
- VS Code will not solve your problems, but it will help to quickly deal with them. And at times.
- After each program change, it must be re-compiled by pressing Ctrl + Shift + B.
Useful shortcuts can be viewed here .
about the author
Maximilian Spiridonov - C # developer, MAI student, Microsoft Student Partner. In professional development on .NET I came back at school. About a year worked with real projects on WPF (MVVM) + C #, MySQL, more than 4 years developed on C #. The main area of interest now is mobile development on Xamarin. Also, by chance, in the sphere of interests were C / C ++ and Linux.
Source: https://habr.com/ru/post/333680/
All Articles